Sainte-Rose Airbnb Market Analysis 2025: Short Term Rental Data & Vacation Rental Statistics in Réunion, France
Is Airbnb profitable in Sainte-Rose in 2025? Explore comprehensive Airbnb analytics for Sainte-Rose, Réunion, France to uncover income potential. This 2025 STR market report for Sainte-Rose, based on AirROI data from April 2024 to March 2025, reveals key trends in the niche market of 23 active listings.
Whether you're considering an Airbnb investment in Sainte-Rose, optimizing your existing vacation rental, or exploring rental arbitrage opportunities, understanding the Sainte-Rose Airbnb data is crucial. Leveraging the low regulation environment is key to maximizing your short term rental income potential. Let's dive into the specifics.
Key Sainte-Rose Airbnb Performance Metrics Overview
Monthly Airbnb Revenue Variations & Income Potential in Sainte-Rose (2025)
Understanding the monthly revenue variations for Airbnb listings in Sainte-Rose is key to maximizing your short term rental income potential. Seasonality significantly impacts earnings. Our analysis, based on data from the past 12 months, shows that the peak revenue month for STRs in Sainte-Rose is typically July, while March often presents the lowest earnings, highlighting opportunities for strategic pricing adjustments during shoulder and low seasons. Explore the typical Airbnb income in Sainte-Rose across different performance tiers:
- Best-in-class properties (Top 10%) achieve $3,847+ monthly, often utilizing dynamic pricing and superior guest experiences.
- Strong performing properties (Top 25%) earn $2,269 or more, indicating effective management and desirable locations/amenities.
- Typical properties (Median) generate around $1,331 per month, representing the average market performance.
- Entry-level properties (Bottom 25%) see earnings around $827, often with potential for optimization.
Average Monthly Airbnb Earnings Trend in Sainte-Rose
Sainte-Rose Airbnb Occupancy Rate Trends (2025)
Maximize your bookings by understanding the Sainte-Rose STR occupancy trends. Seasonal demand shifts significantly influence how often properties are booked. Typically, Julysees the highest demand (peak season occupancy), while March experiences the lowest (low season). Effective strategies, like adjusting minimum stays or offering promotions, can boost occupancy during slower periods. Here's how different property tiers perform in Sainte-Rose:
- Best-in-class properties (Top 10%) achieve 84%+ occupancy, indicating high desirability and potentially optimized availability.
- Strong performing properties (Top 25%) maintain 71% or higher occupancy, suggesting good market fit and guest satisfaction.
- Typical properties (Median) have an occupancy rate around 49%.
- Entry-level properties (Bottom 25%) average 25% occupancy, potentially facing higher vacancy.
Average Monthly Occupancy Rate Trend in Sainte-Rose
Average Daily Rate (ADR) Airbnb Trends in Sainte-Rose (2025)
Effective short term rental pricing strategy in Sainte-Rose involves understanding monthly ADR fluctuations. The Average Daily Rate (ADR) for Airbnb in Sainte-Rose typically peaks in November and dips lowest during May. Leveraging Airbnb dynamic pricing tools or strategies based on this seasonality can significantly boost revenue. Here's a look at the typical nightly rates achieved:
- Best-in-class properties (Top 10%) command rates of $312+ per night, often due to premium features or locations.
- Strong performing properties (Top 25%) achieve nightly rates of $165 or more.
- Typical properties (Median) charge around $101 per night.
- Entry-level properties (Bottom 25%) earn around $75 per night.
Average Daily Rate (ADR) Trend by Month in Sainte-Rose
Get Live Sainte-Rose Market Intelligence 👇

Explore Real-time Analytics
Airbnb Seasonality Analysis & Trends in Sainte-Rose (2025)
Peak Season (July, December, October)
- Revenue averages $2,226 per month
- Occupancy rates average 55.8%
- Daily rates average $143
Shoulder Season
- Revenue averages $1,849 per month
- Occupancy maintains around 50.9%
- Daily rates hold near $144
Low Season (March, April, June)
- Revenue drops to average $1,475 per month
- Occupancy decreases to average 39.3%
- Daily rates adjust to average $140
Seasonality Insights for Sainte-Rose
- The Airbnb seasonality in Sainte-Rose shows moderate seasonality with distinct peak and low periods. While the sections above show seasonal averages, it's also insightful to look at the extremes:
- During the high season, the absolute peak month showcases Sainte-Rose's highest earning potential, with monthly revenues capable of climbing to $2,276, occupancy reaching a high of 61.0%, and ADRs peaking at $153.
- Conversely, the slowest single month of the year, typically falling within the low season, marks the market's lowest point. In this month, revenue might dip to $1,246, occupancy could drop to 35.5%, and ADRs may adjust down to $138.
- Understanding both the seasonal averages and these monthly peaks and troughs in revenue, occupancy, and ADR is crucial for maximizing your Airbnb profit potential in Sainte-Rose.
Seasonal Strategies for Maximizing Profit
- Peak Season: Maximize revenue through premium pricing and potentially longer minimum stays. Ensure high availability.
- Low Season: Offer competitive pricing, special promotions (e.g., extended stay discounts), and flexible cancellation policies. Target off-season travelers like remote workers or budget-conscious guests.
- Shoulder Seasons: Implement dynamic pricing that balances peak and low rates. Target weekend travelers or specific events. Offer slightly more flexible terms than peak season.
- Regularly analyze your own performance against these Sainte-Rose seasonality benchmarks and adjust your pricing and availability strategy accordingly.
Best Areas for Airbnb Investment in Sainte-Rose (2025)
Exploring the top neighborhoods for short-term rentals in Sainte-Rose? This section highlights key areas, outlining why they are attractive for hosts and guests, along with notable local attractions. Consider these locations based on your target guest profile and investment strategy.
| Neighborhood / Area | Why Host Here? (Target Guests & Appeal) | Key Attractions & Landmarks |
|---|---|---|
| Saint Gilles Les Bains | Vibrant coastal town known for its stunning beaches and water activities. It's a prime location for tourists seeking sun and sea, often attracting families and couples. | Boucan Canot Beach, Lagon de Saint Gilles, Aquarium de la Réunion, Les Roches Noires, Saint Gilles Marina, Saint Gilles Market |
| Saint Denis | The capital city of Réunion, offering rich culture, history, and urban experiences. Great for business travelers and those interested in local culture. | Le Jardin de l'État, Cathedral of Saint Denis, Porte des Laquais, Musée Léon Dierx, Rue de Paris, Cité des Arts |
| Salazie | A stunning highland area known for its lush landscapes and waterfalls. Ideal for eco-tourism and adventure seekers looking for hiking and nature experiences. | Voile de la Marie, Mafate Cirque, Hell-Bourg Village, La Nouvelle, Bruge de la Roche, Fonds des Negres Park |
| Cilaos | A mountainous village famous for its breathtaking views and hiking trails. Popular for those looking to escape to nature and enjoy outdoor activities. | Cilaos Thermal Baths, Piton des Neiges, Sentier des Fleurs, Le Takamaka, Canyon de l'Inexact, Cilaos Wine |
| Saint Pierre | A lively town known for its cultural events and vibrant markets. Attractive to tourists interested in local cuisine and arts. | Saint Pierre Beach, Marché de Saint Pierre, La Saga du Rhum, Cimetiere de Saint Pierre, Plage de Terre Sainte, Eglise de Saint Pierre |
| La Plaine des Palmistes | A picturesque village nestled in the highlands, worthwhile for tourists wanting tranquility and a connection with nature. | Cascade Biberon, Parc National de La Réunion, Telephone de La Plaine, Eglise de La Plaine, Le Petit Marche, Grands Sables |
| Etang Salé | A charming coastal destination known for its unique black sand beaches and proximity to the natural reserve. | Etang Salé Beach, L'Étang Salé Nature Reserve, Plage des Brisants, La Caverne du Loup, Parc Asterix, Domaine de La Palmeraie |
| Saint Leu | A coastal town renowned for its surfing spots and beautiful lagoons. Excellent for young travelers and water sport lovers. | Saint Leu Lagoon, Kélonia, Musee de La Mer, Plage de Saint Leu, Parc de la Pointe au Sel, Route des Tereaux |
Understanding Airbnb License Requirements & STR Laws in Sainte-Rose (2025)
While Sainte-Rose, Réunion, France currently shows low STR regulations, specific Airbnb license requirements might still exist or change. Always verify the latest short term rental regulations and Airbnb license requirements directly with local government authorities for Sainte-Rose to ensure full compliance before hosting.
(Source: AirROI data, 2025, finding no licensed listings among those analyzed)
Top Performing Airbnb Properties in Sainte-Rose (2025)
Benchmark your potential! Explore examples of top-performing Airbnb properties in Sainte-Rosebased on Trailing Twelve Month (TTM) revenue. Analyze their characteristics, revenue, occupancy rate, and ADR to understand what drives success in this market.

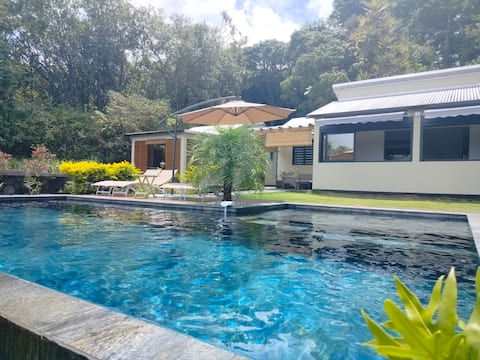
Dodoterla | The Volcano - Swimming Pool
Entire Place • 5 bedrooms
ENTIRE ACCOMMODATION "L 'ENCLOS PANDORA" A SAINTE ROSE
Entire Place • 2 bedrooms
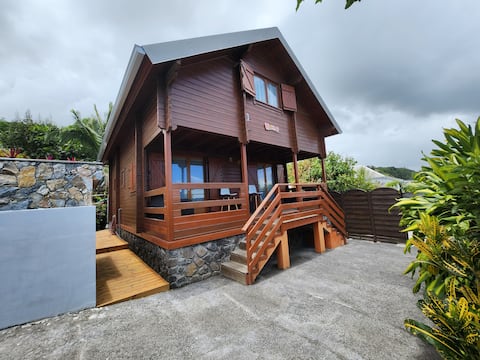
Lantern chalet
Entire Place • 3 bedrooms
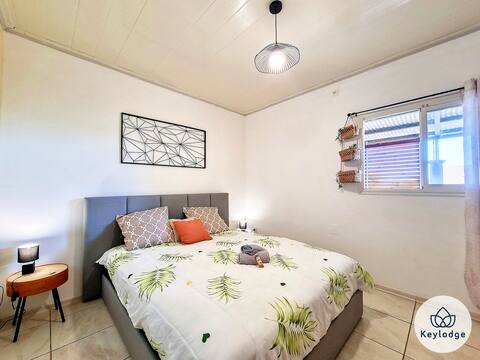
Kazolie, 3-bedroom house of 120 m² in Sainte-Rose
Entire Place • 3 bedrooms
Studio Bellevue
Entire Place • N/A
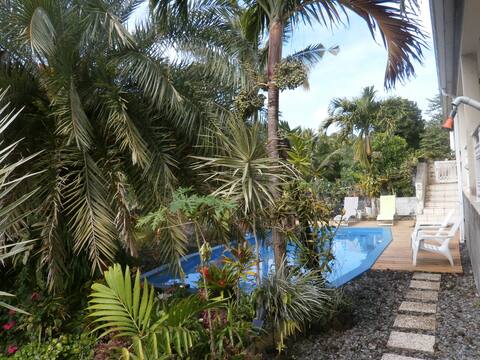
La Maison des Laves
Entire Place • 2 bedrooms
Note: Performance varies based on location, size, amenities, seasonality, and management quality. Data reflects the past 12 months.
Top Performing Airbnb Hosts in Sainte-Rose (2025)
Learn from the best! This table showcases top-performing Airbnb hosts in Sainte-Rose based on the number of properties managed and estimated total revenue over the past year. Analyze their scale and performance metrics.
| Host Name | Properties | Grossing Revenue | Stay Reviews | Avg Rating |
|---|---|---|---|---|
| Wendy | 1 | $65,434 | 3 | 5.00/5.0 |
| Sabrina | 3 | $48,594 | 8 | 1.60/5.0 |
| Thierry | 1 | $48,267 | 86 | 4.85/5.0 |
| Keylodge | 1 | $26,752 | 14 | 4.14/5.0 |
| Thierry | 1 | $22,041 | 169 | 4.95/5.0 |
| Henri | 1 | $21,561 | 105 | 4.54/5.0 |
| Angelique | 2 | $21,337 | 454 | 4.87/5.0 |
| Chantal | 1 | $21,087 | 52 | 4.90/5.0 |
| Stéphanie Et Richard | 2 | $20,108 | 6 | 4.83/5.0 |
| Laissa | 1 | $17,791 | 91 | 4.52/5.0 |
Analyzing the strategies of top hosts, such as their property selection, pricing, and guest communication, can offer valuable lessons for optimizing your own Airbnb operations in Sainte-Rose.
Dive Deeper: Advanced Sainte-Rose STR Market Data (2025)
Ready to unlock more insights? AirROI provides access to advanced metrics and comprehensive Airbnb data for Sainte-Rose. Explore detailed analytics beyond this report to refine your investment strategy, optimize pricing, and maximize your vacation rental profits.
Explore Advanced MetricsSainte-Rose Short-Term Rental Market Composition (2025): Property & Room Types
Room Type Distribution
Property Type Distribution
Market Composition Insights for Sainte-Rose
- The Sainte-Rose Airbnb market composition is heavily skewed towards Entire Home/Apt listings, which make up 82.6% of the 23 active rentals. This indicates strong guest preference for privacy and space.
- Looking at the property type distribution in Sainte-Rose, House properties are the most common (78.3%), reflecting the local real estate landscape.
- Houses represent a significant 78.3% portion, catering likely to families or larger groups.
- The presence of 13% Hotel/Boutique listings indicates integration with traditional hospitality.
- Smaller segments like outdoor/unique, others (combined 8.6%) offer potential for unique stay experiences.
Sainte-Rose Airbnb Room Capacity Analysis (2025): Bedroom Distribution
Distribution of Listings by Number of Bedrooms
Room Capacity Insights for Sainte-Rose
- The dominant room capacity in Sainte-Rose is 2 bedrooms listings, making up 30.4% of the market. This suggests a strong demand for properties suitable for couples or solo travelers.
- Together, 2 bedrooms and 3 bedrooms properties represent 56.5% of the active Airbnb listings in Sainte-Rose, indicating a high concentration in these sizes.
- A significant 34.7% of listings offer 3+ bedrooms, catering to larger groups and families seeking more space in Sainte-Rose.
Sainte-Rose Vacation Rental Guest Capacity Trends (2025)
Distribution of Listings by Guest Capacity
Guest Capacity Insights for Sainte-Rose
- The most common guest capacity trend in Sainte-Rose vacation rentals is listings accommodating 4 guests (26.1%). This suggests the primary traveler segment is likely small families or groups.
- Properties designed for 4 guests and 8+ guests dominate the Sainte-Rose STR market, accounting for 47.8% of listings.
- 39.0% of properties accommodate 6+ guests, serving the market segment for larger families or group travel in Sainte-Rose.
- On average, properties in Sainte-Rose are equipped to host 4.4 guests.
Sainte-Rose Airbnb Booking Patterns (2025): Available vs. Booked Days
Available Days Distribution
Booked Days Distribution
Booking Pattern Insights for Sainte-Rose
- The most common availability pattern in Sainte-Rose falls within the 181-270 days range, representing 34.8% of listings. This suggests many properties have significant open periods on their calendars.
- Approximately 65.2% of listings show high availability (181+ days open annually), indicating potential for increased bookings or specific owner usage patterns.
- For booked days, the 91-180 days range is most frequent in Sainte-Rose (43.5%), reflecting common guest stay durations or potential owner blocking patterns.
- A notable 34.8% of properties secure long booking periods (181+ days booked per year), highlighting successful long-term rental strategies or significant owner usage.
Sainte-Rose Airbnb Minimum Stay Requirements Analysis
Distribution of Listings by Minimum Night Requirement
1 Night
10 listings
43.5% of total
2 Nights
8 listings
34.8% of total
3 Nights
3 listings
13% of total
30+ Nights
2 listings
8.7% of total
Key Insights
- The most prevalent minimum stay requirement in Sainte-Rose is 1 Night, adopted by 43.5% of listings. This highlights the market's preference for shorter, flexible bookings.
- A strong majority (78.3%) of the Sainte-Rose Airbnb data shows acceptance of very short stays (1-2 nights), indicating a dynamic, high-turnover market.
Recommendations
- Align with the market by considering a 1 Night minimum stay, as 43.5% of Sainte-Rose hosts use this setting.
- Explore offering discounts for stays of 30+ nights to attract the 8.7% of the market seeking extended stays.
- Adjust minimum nights based on seasonality – potentially shorter during low season and longer during peak demand periods in Sainte-Rose.
Sainte-Rose Airbnb Cancellation Policy Trends Analysis (2025)
Super Strict 30 Days
2 listings
10% of total
Flexible
7 listings
35% of total
Moderate
1 listings
5% of total
Firm
5 listings
25% of total
Strict
5 listings
25% of total
Cancellation Policy Insights for Sainte-Rose
- The prevailing Airbnb cancellation policy trend in Sainte-Rose is Flexible, used by 35% of listings.
- There's a relatively balanced mix between guest-friendly (40.0%) and stricter (50.0%) policies, offering choices for different guest needs.
Recommendations for Hosts
- Consider adopting a Flexible policy to align with the 35% market standard in Sainte-Rose.
- Regularly review your cancellation policy against competitors and market demand shifts in Sainte-Rose.
Sainte-Rose STR Booking Lead Time Analysis (2025)
Average Booking Lead Time by Month
Booking Lead Time Insights for Sainte-Rose
- The overall average booking lead time for vacation rentals in Sainte-Rose is 70 days.
- Guests book furthest in advance for stays during November (average 96 days), likely coinciding with peak travel demand or local events.
- The shortest booking windows occur for stays in February (average 46 days), indicating more last-minute travel plans during this time.
- Seasonally, Summer (78 days avg.) sees the longest lead times, while Spring (63 days avg.) has the shortest, reflecting typical travel planning cycles.
Recommendations for Hosts
- Use the overall average lead time (70 days) as a baseline for your pricing and availability strategy in Sainte-Rose.
- For November stays, consider implementing length-of-stay discounts or slightly higher rates for bookings made less than 96 days out to capitalize on advance planning.
- Target marketing efforts for the Summer season well in advance (at least 78 days) to capture early planners.
- Monitor your own booking lead times against these Sainte-Rose averages to identify opportunities for dynamic pricing adjustments.
Popular & Essential Airbnb Amenities in Sainte-Rose (2025)
Amenity Prevalence
Amenity Insights for Sainte-Rose
- Essential amenities in Sainte-Rose that guests expect include: Kitchen. Lacking these (this) could significantly impact bookings.
- Popular amenities like Refrigerator, Bed linens, Dishes and silverware are common but not universal. Offering these can provide a competitive edge.
- Warning: Wifi is not universally provided but is considered essential globally. Ensure reliable Wifi is offered.
Recommendations for Hosts
- Ensure your listing includes all essential amenities for Sainte-Rose: Kitchen.
- Prioritize adding missing essentials: Kitchen.
- Consider adding popular differentiators like Refrigerator or Bed linens to increase appeal.
- Highlight unique or less common amenities you offer (e.g., hot tub, dedicated workspace, EV charger) in your listing description and photos.
- Regularly check competitor amenities in Sainte-Rose to stay competitive.
Sainte-Rose Airbnb Guest Demographics & Profile Analysis (2025)
Guest Profile Summary for Sainte-Rose
- The typical guest profile for Airbnb in Sainte-Rose consists of primarily domestic travelers (78%), often arriving from nearby Paris, typically belonging to the Post-2000s (Gen Z/Alpha) group (50%), primarily speaking French or English.
- Domestic travelers account for 78.1% of guests.
- Key international markets include France (78.1%) and Réunion (8.3%).
- Top languages spoken are French (45.1%) followed by English (33.2%).
- A significant demographic segment is the Post-2000s (Gen Z/Alpha) group, representing 50% of guests.
Recommendations for Hosts
- Target domestic marketing efforts towards travelers from Paris and Nantes.
- Tailor amenities and listing descriptions to appeal to the dominant Post-2000s (Gen Z/Alpha) demographic (e.g., highlight fast WiFi, smart home features, local guides).
- Highlight unique local experiences or amenities relevant to the primary guest profile.
- Consider seasonal promotions aligned with peak travel times for key origin markets.
Nearby Short-Term Rental Market Comparison
How does the Sainte-Rose Airbnb market stack up against its neighbors? Compare key performance metrics like average monthly revenue, ADR, and occupancy rates in surrounding areas to understand the broader regional STR landscape.
| Market | Active Properties | Monthly Revenue | Daily Rate | Avg. Occupancy |
|---|---|---|---|---|
| Cilaos | 150 | $1,799 | $132.28 | 49% |
| Salazie | 61 | $1,738 | $120.16 | 52% |
| Les Trois-Bassins | 72 | $1,705 | $179.01 | 45% |
| Saint-Paul | 1,856 | $1,590 | $151.70 | 50% |
| L'Étang-Salé | 229 | $1,431 | $138.39 | 48% |
| Saint-Leu | 583 | $1,404 | $125.31 | 51% |
| Saint-Philippe | 29 | $1,374 | $102.33 | 45% |
| La Plaine-des-Palmistes | 50 | $1,360 | $153.36 | 37% |
| Saint-Joseph | 300 | $1,354 | $128.56 | 45% |
| Petite-Île | 107 | $1,338 | $127.36 | 43% |