Soudan Airbnb Market Analysis 2025: Short Term Rental Data & Vacation Rental Statistics in Pays de la Loire, France
Is Airbnb profitable in Soudan in 2025? Explore comprehensive Airbnb analytics for Soudan, Pays de la Loire, France to uncover income potential. This 2025 STR market report for Soudan, based on AirROI data from April 2024 to March 2025, reveals key trends in the niche market of 18 active listings.
Whether you're considering an Airbnb investment in Soudan, optimizing your existing vacation rental, or exploring rental arbitrage opportunities, understanding the Soudan Airbnb data is crucial. Leveraging the low regulation environment is key to maximizing your short term rental income potential. Let's dive into the specifics.
Key Soudan Airbnb Performance Metrics Overview
Monthly Airbnb Revenue Variations & Income Potential in Soudan (2025)
Understanding the monthly revenue variations for Airbnb listings in Soudan is key to maximizing your short term rental income potential. Seasonality significantly impacts earnings. Our analysis, based on data from the past 12 months, shows that the peak revenue month for STRs in Soudan is typically May, while January often presents the lowest earnings, highlighting opportunities for strategic pricing adjustments during shoulder and low seasons. Explore the typical Airbnb income in Soudan across different performance tiers:
- Best-in-class properties (Top 10%) achieve $2,230+ monthly, often utilizing dynamic pricing and superior guest experiences.
- Strong performing properties (Top 25%) earn $1,739 or more, indicating effective management and desirable locations/amenities.
- Typical properties (Median) generate around $1,199 per month, representing the average market performance.
- Entry-level properties (Bottom 25%) see earnings around $533, often with potential for optimization.
Average Monthly Airbnb Earnings Trend in Soudan
Soudan Airbnb Occupancy Rate Trends (2025)
Maximize your bookings by understanding the Soudan STR occupancy trends. Seasonal demand shifts significantly influence how often properties are booked. Typically, Augustsees the highest demand (peak season occupancy), while January experiences the lowest (low season). Effective strategies, like adjusting minimum stays or offering promotions, can boost occupancy during slower periods. Here's how different property tiers perform in Soudan:
- Best-in-class properties (Top 10%) achieve 57%+ occupancy, indicating high desirability and potentially optimized availability.
- Strong performing properties (Top 25%) maintain 44% or higher occupancy, suggesting good market fit and guest satisfaction.
- Typical properties (Median) have an occupancy rate around 26%.
- Entry-level properties (Bottom 25%) average 14% occupancy, potentially facing higher vacancy.
Average Monthly Occupancy Rate Trend in Soudan
Average Daily Rate (ADR) Airbnb Trends in Soudan (2025)
Effective short term rental pricing strategy in Soudan involves understanding monthly ADR fluctuations. The Average Daily Rate (ADR) for Airbnb in Soudan typically peaks in July and dips lowest during February. Leveraging Airbnb dynamic pricing tools or strategies based on this seasonality can significantly boost revenue. Here's a look at the typical nightly rates achieved:
- Best-in-class properties (Top 10%) command rates of $131+ per night, often due to premium features or locations.
- Strong performing properties (Top 25%) achieve nightly rates of $118 or more.
- Typical properties (Median) charge around $101 per night.
- Entry-level properties (Bottom 25%) earn around $86 per night.
Average Daily Rate (ADR) Trend by Month in Soudan
Get Live Soudan Market Intelligence 👇

Explore Real-time Analytics
Airbnb Seasonality Analysis & Trends in Soudan (2025)
Peak Season (May, April, June)
- Revenue averages $2,171 per month
- Occupancy rates average 35.6%
- Daily rates average $109
Shoulder Season
- Revenue averages $1,124 per month
- Occupancy maintains around 34.8%
- Daily rates hold near $107
Low Season (January, February, March)
- Revenue drops to average $458 per month
- Occupancy decreases to average 16.8%
- Daily rates adjust to average $94
Seasonality Insights for Soudan
- The Airbnb seasonality in Soudan shows highly seasonal trends requiring careful strategy. While the sections above show seasonal averages, it's also insightful to look at the extremes:
- During the high season, the absolute peak month showcases Soudan's highest earning potential, with monthly revenues capable of climbing to $2,438, occupancy reaching a high of 48.4%, and ADRs peaking at $110.
- Conversely, the slowest single month of the year, typically falling within the low season, marks the market's lowest point. In this month, revenue might dip to $330, occupancy could drop to 11.6%, and ADRs may adjust down to $92.
- Understanding both the seasonal averages and these monthly peaks and troughs in revenue, occupancy, and ADR is crucial for maximizing your Airbnb profit potential in Soudan.
Seasonal Strategies for Maximizing Profit
- Peak Season: Maximize revenue through premium pricing and potentially longer minimum stays. Ensure high availability.
- Low Season: Offer competitive pricing, special promotions (e.g., extended stay discounts), and flexible cancellation policies. Target off-season travelers like remote workers or budget-conscious guests.
- Shoulder Seasons: Implement dynamic pricing that balances peak and low rates. Target weekend travelers or specific events. Offer slightly more flexible terms than peak season.
- Regularly analyze your own performance against these Soudan seasonality benchmarks and adjust your pricing and availability strategy accordingly.
Best Areas for Airbnb Investment in Soudan (2025)
Exploring the top neighborhoods for short-term rentals in Soudan? This section highlights key areas, outlining why they are attractive for hosts and guests, along with notable local attractions. Consider these locations based on your target guest profile and investment strategy.
| Neighborhood / Area | Why Host Here? (Target Guests & Appeal) | Key Attractions & Landmarks |
|---|---|---|
| Nantes City Centre | The vibrant heart of Nantes, known for its historical architecture, cultural attractions, and lively atmosphere. It is a prime location for tourists looking to explore the local culture and nightlife. | Château des Ducs de Bretagne, Les Machines de l'île, Passage Pommeraye, Nantes Cathedral, Le Lieu Unique, Île de Versailles |
| La Baule-Escoublac | A glamorous beach resort renowned for its long sandy beaches and upscale amenities. Ideal for visitors seeking a seaside getaway with plenty of water activities and relaxation. | Plage de la Baule, Casino Barrière, La Baule Market, Espace Aquatique, Parc des Dryades |
| Clisson | A picturesque town known for its Italian-inspired architecture and historical significance. Great for tourists interested in history and scenic views. | Château de Clisson, Clisson's vineyards, Les Halles de Clisson, Promenade des Coteaux, La Garenne |
| Saint-Nazaire | A coastal city with a rich maritime history and beautiful beaches. Attracts tourists who enjoy water sports and exploration of historical sites. | Escal'Atlantic, Saint-Nazaire Submarine Base, La plage de Monsieur Hulot, The Loire River, exhibitions and museums about maritime history |
| Chalonnes-sur-Loire | Located along the Loire River, this charming town offers scenic views and a peaceful atmosphere, perfect for those seeking a rural retreat yet close to Nantes. | Loire Valley vineyards, Saint-Jacques Church, The banks of the Loire, Local markets |
| Angers | Known for its historical significance and stunning architecture. Angers is filled with beautiful parks and cultural experiences, ideal for culture-loving tourists. | Château d'Angers, Tapestry of the Apocalypse, Angers Cathedral, L'Agraire Museum, Botanical Garden of Terra Botanica |
| Les Sables-d'Olonne | A popular seaside destination known for its beautiful beaches and thriving tourist activities. Perfect for families and beach lovers looking for a fun holiday. | Plage des Sables, Musee de l'Abbaye Sainte-Croix, Les Atlantes (adventure park), Parc zoologique des Sables d'Olonne |
| Saint-Malo-de-Guersac | A small, serene town close to larger cities, offering a quiet retreat surrounded by nature and an authentic French village experience. | Nature trails, Local French cuisine, Community events |
Understanding Airbnb License Requirements & STR Laws in Soudan (2025)
While Soudan, Pays de la Loire, France currently shows low STR regulations, specific Airbnb license requirements might still exist or change. Always verify the latest short term rental regulations and Airbnb license requirements directly with local government authorities for Soudan to ensure full compliance before hosting.
(Source: AirROI data, 2025, finding no licensed listings among those analyzed)
Top Performing Airbnb Properties in Soudan (2025)
Benchmark your potential! Explore examples of top-performing Airbnb properties in Soudanbased on Trailing Twelve Month (TTM) revenue. Analyze their characteristics, revenue, occupancy rate, and ADR to understand what drives success in this market.
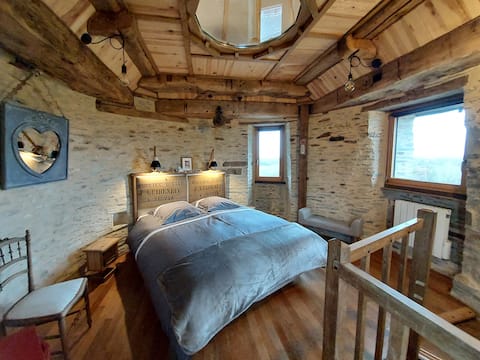
Unusual cottage in an old windmill.
Private Room • 1 bedroom
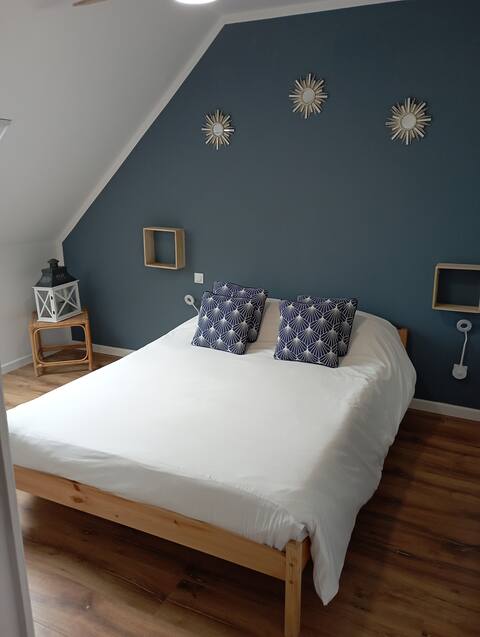
Quiet apartment "Les gîtes du petit Marcel"
Entire Place • 1 bedroom
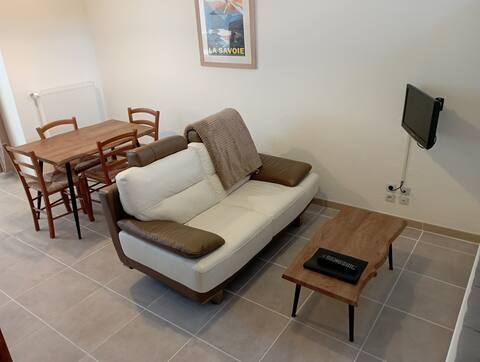
Countryside lodge "Les gîtes du petit Marcel"
Entire Place • 1 bedroom
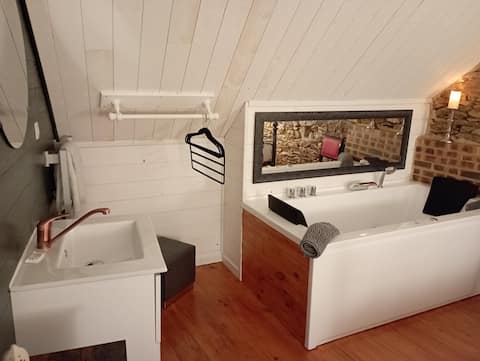
Gîte Romantique "Les gîtes du petit Marcel"
Entire Place • 1 bedroom

Gîte 1 chambre double "Londres"
Entire Place • 1 bedroom
Loft
Entire Place • 1 bedroom
Note: Performance varies based on location, size, amenities, seasonality, and management quality. Data reflects the past 12 months.
Top Performing Airbnb Hosts in Soudan (2025)
Learn from the best! This table showcases top-performing Airbnb hosts in Soudan based on the number of properties managed and estimated total revenue over the past year. Analyze their scale and performance metrics.
| Host Name | Properties | Grossing Revenue | Stay Reviews | Avg Rating |
|---|---|---|---|---|
| Mélanie | 9 | $83,375 | 38 | 3.30/5.0 |
| Corinne | 5 | $39,043 | 7 | 2.00/5.0 |
| Sophie | 1 | $19,397 | 65 | 4.95/5.0 |
| Naïma | 2 | $7,394 | 25 | 2.31/5.0 |
| Cedric | 1 | $5,664 | 13 | 5.00/5.0 |
Analyzing the strategies of top hosts, such as their property selection, pricing, and guest communication, can offer valuable lessons for optimizing your own Airbnb operations in Soudan.
Dive Deeper: Advanced Soudan STR Market Data (2025)
Ready to unlock more insights? AirROI provides access to advanced metrics and comprehensive Airbnb data for Soudan. Explore detailed analytics beyond this report to refine your investment strategy, optimize pricing, and maximize your vacation rental profits.
Explore Advanced MetricsSoudan Short-Term Rental Market Composition (2025): Property & Room Types
Room Type Distribution
Property Type Distribution
Market Composition Insights for Soudan
- The Soudan Airbnb market composition is heavily skewed towards Entire Home/Apt listings, which make up 66.7% of the 18 active rentals. This indicates strong guest preference for privacy and space.
- However, a notable 33.3% share for Private Rooms suggests opportunities for budget-conscious travelers or hosts renting out spare rooms.
- Looking at the property type distribution in Soudan, House properties are the most common (50%), reflecting the local real estate landscape.
- Houses represent a significant 50% portion, catering likely to families or larger groups.
- The presence of 27.8% Hotel/Boutique listings indicates integration with traditional hospitality.
Soudan Airbnb Room Capacity Analysis (2025): Bedroom Distribution
Distribution of Listings by Number of Bedrooms
Room Capacity Insights for Soudan
- The dominant room capacity in Soudan is 1 bedroom listings, making up 66.7% of the market. This suggests a strong demand for properties suitable for couples or solo travelers.
- Together, 1 bedroom and 3 bedrooms properties represent 77.8% of the active Airbnb listings in Soudan, indicating a high concentration in these sizes.
- With over half the market (66.7%) consisting of studios or 1-bedroom units, Soudan is particularly well-suited for individuals or couples.
Soudan Vacation Rental Guest Capacity Trends (2025)
Distribution of Listings by Guest Capacity
Guest Capacity Insights for Soudan
- The most common guest capacity trend in Soudan vacation rentals is listings accommodating 2 guests (50%). This suggests the primary traveler segment is likely couples or solo travelers.
- Properties designed for 2 guests and 4 guests dominate the Soudan STR market, accounting for 66.7% of listings.
- A significant 50.0% of listings cater specifically to 1-2 guests, highlighting strong demand from couples and solo travelers in Soudan.
- 16.7% of properties accommodate 6+ guests, serving the market segment for larger families or group travel in Soudan.
- On average, properties in Soudan are equipped to host 3.0 guests.
Soudan Airbnb Booking Patterns (2025): Available vs. Booked Days
Available Days Distribution
Booked Days Distribution
Booking Pattern Insights for Soudan
- The most common availability pattern in Soudan falls within the 271-366 days range, representing 66.7% of listings. This suggests many properties have significant open periods on their calendars.
- Approximately 100.0% of listings show high availability (181+ days open annually), indicating potential for increased bookings or specific owner usage patterns.
- For booked days, the 31-90 days range is most frequent in Soudan (50%), reflecting common guest stay durations or potential owner blocking patterns.
Soudan Airbnb Minimum Stay Requirements Analysis
Distribution of Listings by Minimum Night Requirement
1 Night
16 listings
88.9% of total
2 Nights
1 listings
5.6% of total
3 Nights
1 listings
5.6% of total
Key Insights
- The most prevalent minimum stay requirement in Soudan is 1 Night, adopted by 88.9% of listings. This highlights the market's preference for shorter, flexible bookings.
- A strong majority (94.5%) of the Soudan Airbnb data shows acceptance of very short stays (1-2 nights), indicating a dynamic, high-turnover market.
Recommendations
- Align with the market by considering a 1 Night minimum stay, as 88.9% of Soudan hosts use this setting.
- Adjust minimum nights based on seasonality – potentially shorter during low season and longer during peak demand periods in Soudan.
Soudan Airbnb Cancellation Policy Trends Analysis (2025)
Refundable
1 listings
9.1% of total
Non-refundable
1 listings
9.1% of total
Flexible
7 listings
63.6% of total
Strict
2 listings
18.2% of total
Cancellation Policy Insights for Soudan
- The prevailing Airbnb cancellation policy trend in Soudan is Flexible, used by 63.6% of listings.
- There's a relatively balanced mix between guest-friendly (63.6%) and stricter (18.2%) policies, offering choices for different guest needs.
Recommendations for Hosts
- Consider adopting a Flexible policy to align with the 63.6% market standard in Soudan.
- Given the high prevalence of Flexible policies (63.6%), offering this can enhance booking appeal, especially during shoulder seasons.
- Regularly review your cancellation policy against competitors and market demand shifts in Soudan.
Soudan STR Booking Lead Time Analysis (2025)
Average Booking Lead Time by Month
Booking Lead Time Insights for Soudan
- The overall average booking lead time for vacation rentals in Soudan is 26 days.
- Guests book furthest in advance for stays during May (average 93 days), likely coinciding with peak travel demand or local events.
- The shortest booking windows occur for stays in November (average 11 days), indicating more last-minute travel plans during this time.
- Seasonally, Spring (70 days avg.) sees the longest lead times, while Winter (18 days avg.) has the shortest, reflecting typical travel planning cycles.
Recommendations for Hosts
- Use the overall average lead time (26 days) as a baseline for your pricing and availability strategy in Soudan.
- For May stays, consider implementing length-of-stay discounts or slightly higher rates for bookings made less than 93 days out to capitalize on advance planning.
- During November, focus on last-minute booking availability and promotions, as guests book with very short notice (11 days avg.).
- Target marketing efforts for the Spring season well in advance (at least 70 days) to capture early planners.
- Monitor your own booking lead times against these Soudan averages to identify opportunities for dynamic pricing adjustments.
Popular & Essential Airbnb Amenities in Soudan (2025)
Amenity Prevalence
Amenity Insights for Soudan
- Essential amenities in Soudan that guests expect include: Wifi, Smoke alarm, Heating. Lacking these (any) could significantly impact bookings.
- Popular amenities like Free parking on premises, Essentials, Hot water are common but not universal. Offering these can provide a competitive edge.
Recommendations for Hosts
- Ensure your listing includes all essential amenities for Soudan: Wifi, Smoke alarm, Heating.
- Consider adding popular differentiators like Free parking on premises or Essentials to increase appeal.
- Highlight unique or less common amenities you offer (e.g., hot tub, dedicated workspace, EV charger) in your listing description and photos.
- Regularly check competitor amenities in Soudan to stay competitive.
Soudan Airbnb Guest Demographics & Profile Analysis (2025)
Guest Profile Summary for Soudan
- The typical guest profile for Airbnb in Soudan consists of primarily domestic travelers (81%), often arriving from nearby Rennes, typically belonging to the Post-2000s (Gen Z/Alpha) group (50%), primarily speaking French or English.
- Domestic travelers account for 80.6% of guests.
- Key international markets include France (80.6%) and Germany (5.6%).
- Top languages spoken are French (50%) followed by English (32.4%).
- A significant demographic segment is the Post-2000s (Gen Z/Alpha) group, representing 50% of guests.
Recommendations for Hosts
- Target domestic marketing efforts towards travelers from Rennes and Piriac-sur-Mer.
- Tailor amenities and listing descriptions to appeal to the dominant Post-2000s (Gen Z/Alpha) demographic (e.g., highlight fast WiFi, smart home features, local guides).
- Highlight unique local experiences or amenities relevant to the primary guest profile.
- Consider seasonal promotions aligned with peak travel times for key origin markets.
Nearby Short-Term Rental Market Comparison
How does the Soudan Airbnb market stack up against its neighbors? Compare key performance metrics like average monthly revenue, ADR, and occupancy rates in surrounding areas to understand the broader regional STR landscape.
| Market | Active Properties | Monthly Revenue | Daily Rate | Avg. Occupancy |
|---|---|---|---|---|
| Moulins-le-Carbonnel | 11 | $3,213 | $320.85 | 35% |
| Vallon-sur-Gée | 11 | $2,913 | $379.01 | 30% |
| Bourneau | 11 | $2,747 | $442.07 | 35% |
| Nuaillé-d'Aunis | 10 | $2,741 | $373.83 | 37% |
| Le Bois-Plage-en-Ré | 303 | $2,528 | $284.63 | 45% |
| Chambellay | 11 | $2,525 | $255.24 | 34% |
| Sainte-Florence | 10 | $2,445 | $233.78 | 46% |
| La Flotte | 396 | $2,382 | $236.53 | 46% |
| Forges | 11 | $2,314 | $220.63 | 39% |
| Dœuil-sur-le-Mignon | 12 | $2,283 | $481.91 | 21% |