Sainte-Suzanne-et-Chammes Airbnb Market Analysis 2025: Short Term Rental Data & Vacation Rental Statistics in Pays de la Loire, France
Is Airbnb profitable in Sainte-Suzanne-et-Chammes in 2025? Explore comprehensive Airbnb analytics for Sainte-Suzanne-et-Chammes, Pays de la Loire, France to uncover income potential. This 2025 STR market report for Sainte-Suzanne-et-Chammes, based on AirROI data from April 2024 to March 2025, reveals key trends in the niche market of 23 active listings.
Whether you're considering an Airbnb investment in Sainte-Suzanne-et-Chammes, optimizing your existing vacation rental, or exploring rental arbitrage opportunities, understanding the Sainte-Suzanne-et-Chammes Airbnb data is crucial. Understanding the local regulations is key to maximizing your short term rental income potential. Let's dive into the specifics.
Key Sainte-Suzanne-et-Chammes Airbnb Performance Metrics Overview
Monthly Airbnb Revenue Variations & Income Potential in Sainte-Suzanne-et-Chammes (2025)
Understanding the monthly revenue variations for Airbnb listings in Sainte-Suzanne-et-Chammes is key to maximizing your short term rental income potential. Seasonality significantly impacts earnings. Our analysis, based on data from the past 12 months, shows that the peak revenue month for STRs in Sainte-Suzanne-et-Chammes is typically August, while February often presents the lowest earnings, highlighting opportunities for strategic pricing adjustments during shoulder and low seasons. Explore the typical Airbnb income in Sainte-Suzanne-et-Chammes across different performance tiers:
- Best-in-class properties (Top 10%) achieve $2,541+ monthly, often utilizing dynamic pricing and superior guest experiences.
- Strong performing properties (Top 25%) earn $1,734 or more, indicating effective management and desirable locations/amenities.
- Typical properties (Median) generate around $1,060 per month, representing the average market performance.
- Entry-level properties (Bottom 25%) see earnings around $551, often with potential for optimization.
Average Monthly Airbnb Earnings Trend in Sainte-Suzanne-et-Chammes
Sainte-Suzanne-et-Chammes Airbnb Occupancy Rate Trends (2025)
Maximize your bookings by understanding the Sainte-Suzanne-et-Chammes STR occupancy trends. Seasonal demand shifts significantly influence how often properties are booked. Typically, Augustsees the highest demand (peak season occupancy), while March experiences the lowest (low season). Effective strategies, like adjusting minimum stays or offering promotions, can boost occupancy during slower periods. Here's how different property tiers perform in Sainte-Suzanne-et-Chammes:
- Best-in-class properties (Top 10%) achieve 67%+ occupancy, indicating high desirability and potentially optimized availability.
- Strong performing properties (Top 25%) maintain 50% or higher occupancy, suggesting good market fit and guest satisfaction.
- Typical properties (Median) have an occupancy rate around 32%.
- Entry-level properties (Bottom 25%) average 15% occupancy, potentially facing higher vacancy.
Average Monthly Occupancy Rate Trend in Sainte-Suzanne-et-Chammes
Average Daily Rate (ADR) Airbnb Trends in Sainte-Suzanne-et-Chammes (2025)
Effective short term rental pricing strategy in Sainte-Suzanne-et-Chammes involves understanding monthly ADR fluctuations. The Average Daily Rate (ADR) for Airbnb in Sainte-Suzanne-et-Chammes typically peaks in April and dips lowest during March. Leveraging Airbnb dynamic pricing tools or strategies based on this seasonality can significantly boost revenue. Here's a look at the typical nightly rates achieved:
- Best-in-class properties (Top 10%) command rates of $233+ per night, often due to premium features or locations.
- Strong performing properties (Top 25%) achieve nightly rates of $172 or more.
- Typical properties (Median) charge around $107 per night.
- Entry-level properties (Bottom 25%) earn around $65 per night.
Average Daily Rate (ADR) Trend by Month in Sainte-Suzanne-et-Chammes
Get Live Sainte-Suzanne-et-Chammes Market Intelligence 👇

Explore Real-time Analytics
Airbnb Seasonality Analysis & Trends in Sainte-Suzanne-et-Chammes (2025)
Peak Season (August, July, December)
- Revenue averages $1,961 per month
- Occupancy rates average 46.0%
- Daily rates average $154
Shoulder Season
- Revenue averages $1,278 per month
- Occupancy maintains around 35.6%
- Daily rates hold near $159
Low Season (January, February, March)
- Revenue drops to average $771 per month
- Occupancy decreases to average 26.6%
- Daily rates adjust to average $134
Seasonality Insights for Sainte-Suzanne-et-Chammes
- The Airbnb seasonality in Sainte-Suzanne-et-Chammes shows highly seasonal trends requiring careful strategy. While the sections above show seasonal averages, it's also insightful to look at the extremes:
- During the high season, the absolute peak month showcases Sainte-Suzanne-et-Chammes's highest earning potential, with monthly revenues capable of climbing to $2,257, occupancy reaching a high of 54.1%, and ADRs peaking at $165.
- Conversely, the slowest single month of the year, typically falling within the low season, marks the market's lowest point. In this month, revenue might dip to $699, occupancy could drop to 21.8%, and ADRs may adjust down to $129.
- Understanding both the seasonal averages and these monthly peaks and troughs in revenue, occupancy, and ADR is crucial for maximizing your Airbnb profit potential in Sainte-Suzanne-et-Chammes.
Seasonal Strategies for Maximizing Profit
- Peak Season: Maximize revenue through premium pricing and potentially longer minimum stays. Ensure high availability.
- Low Season: Offer competitive pricing, special promotions (e.g., extended stay discounts), and flexible cancellation policies. Target off-season travelers like remote workers or budget-conscious guests.
- Shoulder Seasons: Implement dynamic pricing that balances peak and low rates. Target weekend travelers or specific events. Offer slightly more flexible terms than peak season.
- Regularly analyze your own performance against these Sainte-Suzanne-et-Chammes seasonality benchmarks and adjust your pricing and availability strategy accordingly.
Best Areas for Airbnb Investment in Sainte-Suzanne-et-Chammes (2025)
Exploring the top neighborhoods for short-term rentals in Sainte-Suzanne-et-Chammes? This section highlights key areas, outlining why they are attractive for hosts and guests, along with notable local attractions. Consider these locations based on your target guest profile and investment strategy.
| Neighborhood / Area | Why Host Here? (Target Guests & Appeal) | Key Attractions & Landmarks |
|---|---|---|
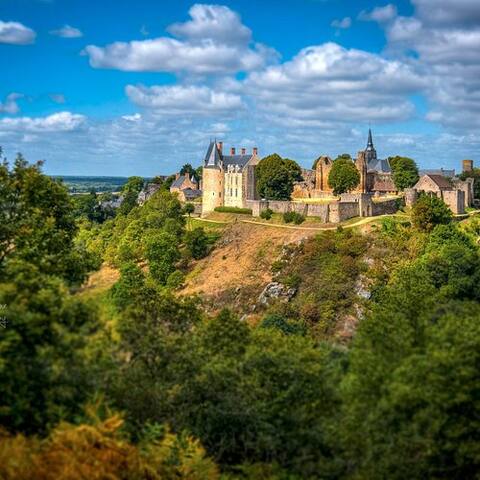
| Sainte-Suzanne | A historic village known for its medieval architecture and beautiful views. A charming destination for tourists interested in history and culture, with local festivals and events throughout the year. | Château de Sainte-Suzanne, Forteresse de Sainte-Suzanne, Local artisan markets, Festival de l'histoire, Nearby hiking trails |
| Chammes | A quiet commune surrounded by nature, appealing to those looking for a peaceful retreat. Ideal for families and nature lovers who enjoy outdoor activities like hiking and cycling. | Nature parks, Cycling routes, Local gastronomy, Fishing opportunities, Riverside picnics |
| Le Mans | A major city nearby with a rich history and vibrant cultural scene. Attracts tourists for its famous 24-hour race and beautiful old town, providing a lively urban experience. | Cité Plantagenêt, 24 Hours of Le Mans Museum, Le Mans Cathedral, Local restaurants and cafes, Events and festivals |
| Angers | A larger city known for its impressive chateau and rich history. Offers a mix of urban and cultural attractions, appealing to a wide range of tourists. | Château d'Angers, TGV access to Paris, The Tanjore Garden, Theater and cultural events, Wine tours in the region |
| Laval | Known for its historical sites and beautiful green spaces. A good base for exploring the Mayenne department, appealing to both history buffs and outdoor enthusiasts. | Laval Cathedral, Cistercian Abbey of Saint-Pierre, Jardin de la Perrine, Local markets, Nearby rivers and lakes |
| Château-Gontier | A picturesque town along the Mayenne River, known for its charming streets and local culture. Attractive for tourists looking for a quaint French experience. | The Mayenne River, Local art galleries, Historical buildings, Festivals and events, Relaxing riverside walks |
| Mayenne | A scenic area with beautiful countryside and small villages, ideal for those seeking tranquility. Popular for countryside retreats and eco-tourism. | Countryside trails, Historic Churches, Local farms, Traditional markets, Nature reserves |
| Saumur | Famous for its wine and historic chateau, attracting tourists interested in French culture and gastronomy. A bustling area during the summer with many festivals. | Château de Saumur, Caves of Saumur, Wine tasting tours, Troglodyte houses, Local markets |
Understanding Airbnb License Requirements & STR Laws in Sainte-Suzanne-et-Chammes (2025)
With 22% of listings showing registration in 2025, understanding potential Airbnb license requirements is crucial in Sainte-Suzanne-et-Chammes. Always verify the latest short term rental regulations and Airbnb license requirements directly with local government authorities for Sainte-Suzanne-et-Chammes to ensure full compliance before hosting.
(Source: AirROI data, 2025, based on 22% licensed listings)
Top Performing Airbnb Properties in Sainte-Suzanne-et-Chammes (2025)
Benchmark your potential! Explore examples of top-performing Airbnb properties in Sainte-Suzanne-et-Chammesbased on Trailing Twelve Month (TTM) revenue. Analyze their characteristics, revenue, occupancy rate, and ADR to understand what drives success in this market.
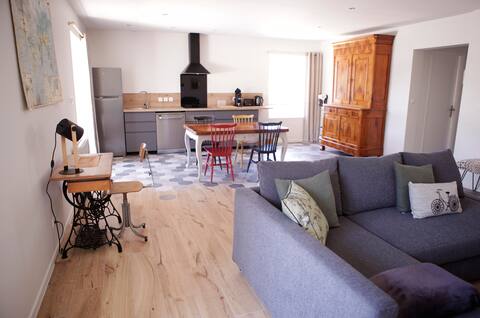
Le grand Loré 11 personnes
Entire Place • 4 bedrooms

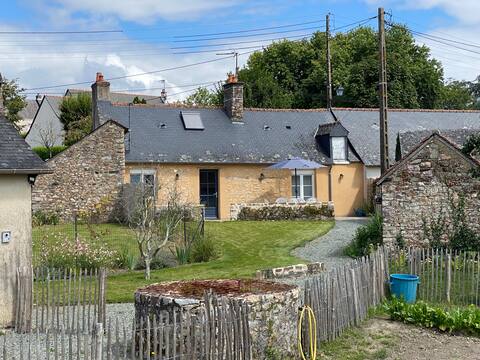
Large family home in Sainte Suzanne
Entire Place • 4 bedrooms

House in the heart of the medieval city
Entire Place • 3 bedrooms
Hosting Sainte Suzanne
Entire Place • 3 bedrooms
Gîte du Petit Rocher near the historic center
Entire Place • 2 bedrooms

Formidable house
Entire Place • 3 bedrooms
Note: Performance varies based on location, size, amenities, seasonality, and management quality. Data reflects the past 12 months.
Top Performing Airbnb Hosts in Sainte-Suzanne-et-Chammes (2025)
Learn from the best! This table showcases top-performing Airbnb hosts in Sainte-Suzanne-et-Chammes based on the number of properties managed and estimated total revenue over the past year. Analyze their scale and performance metrics.
| Host Name | Properties | Grossing Revenue | Stay Reviews | Avg Rating |
|---|---|---|---|---|
| Céline Martine | 2 | $46,325 | 15 | 2.50/5.0 |
| Valérie | 4 | $36,319 | 53 | 4.87/5.0 |
| Marie-Noëlle | 1 | $27,262 | 65 | 4.97/5.0 |
| Aurélie | 1 | $26,190 | 42 | 5.00/5.0 |
| Julien | 1 | $22,330 | 26 | 4.81/5.0 |
| Carol-Marie | 2 | $21,986 | 189 | 4.93/5.0 |
| Didier-Florence | 1 | $20,028 | 83 | 4.94/5.0 |
| Jacky | 1 | $16,102 | 227 | 4.78/5.0 |
| Alexandre | 1 | $13,718 | 9 | 4.44/5.0 |
| Michèle | 2 | $8,080 | 75 | 4.82/5.0 |
Analyzing the strategies of top hosts, such as their property selection, pricing, and guest communication, can offer valuable lessons for optimizing your own Airbnb operations in Sainte-Suzanne-et-Chammes.
Dive Deeper: Advanced Sainte-Suzanne-et-Chammes STR Market Data (2025)
Ready to unlock more insights? AirROI provides access to advanced metrics and comprehensive Airbnb data for Sainte-Suzanne-et-Chammes. Explore detailed analytics beyond this report to refine your investment strategy, optimize pricing, and maximize your vacation rental profits.
Explore Advanced MetricsSainte-Suzanne-et-Chammes Short-Term Rental Market Composition (2025): Property & Room Types
Room Type Distribution
Property Type Distribution
Market Composition Insights for Sainte-Suzanne-et-Chammes
- The Sainte-Suzanne-et-Chammes Airbnb market composition is heavily skewed towards Entire Home/Apt listings, which make up 65.2% of the 23 active rentals. This indicates strong guest preference for privacy and space.
- However, a notable 34.8% share for Private Rooms suggests opportunities for budget-conscious travelers or hosts renting out spare rooms.
- Looking at the property type distribution in Sainte-Suzanne-et-Chammes, House properties are the most common (56.5%), reflecting the local real estate landscape.
- Houses represent a significant 56.5% portion, catering likely to families or larger groups.
- The presence of 21.7% Hotel/Boutique listings indicates integration with traditional hospitality.
- Smaller segments like others (combined 4.3%) offer potential for unique stay experiences.
Sainte-Suzanne-et-Chammes Airbnb Room Capacity Analysis (2025): Bedroom Distribution
Distribution of Listings by Number of Bedrooms
Room Capacity Insights for Sainte-Suzanne-et-Chammes
- The dominant room capacity in Sainte-Suzanne-et-Chammes is 1 bedroom listings, making up 39.1% of the market. This suggests a strong demand for properties suitable for couples or solo travelers.
- Together, 1 bedroom and 2 bedrooms properties represent 56.5% of the active Airbnb listings in Sainte-Suzanne-et-Chammes, indicating a high concentration in these sizes.
- A significant 26.0% of listings offer 3+ bedrooms, catering to larger groups and families seeking more space in Sainte-Suzanne-et-Chammes.
Sainte-Suzanne-et-Chammes Vacation Rental Guest Capacity Trends (2025)
Distribution of Listings by Guest Capacity
Guest Capacity Insights for Sainte-Suzanne-et-Chammes
- The most common guest capacity trend in Sainte-Suzanne-et-Chammes vacation rentals is listings accommodating 4 guests (26.1%). This suggests the primary traveler segment is likely small families or groups.
- Properties designed for 4 guests and 8+ guests dominate the Sainte-Suzanne-et-Chammes STR market, accounting for 43.5% of listings.
- 21.7% of properties accommodate 6+ guests, serving the market segment for larger families or group travel in Sainte-Suzanne-et-Chammes.
- On average, properties in Sainte-Suzanne-et-Chammes are equipped to host 3.8 guests.
Sainte-Suzanne-et-Chammes Airbnb Booking Patterns (2025): Available vs. Booked Days
Available Days Distribution
Booked Days Distribution
Booking Pattern Insights for Sainte-Suzanne-et-Chammes
- The most common availability pattern in Sainte-Suzanne-et-Chammes falls within the 271-366 days range, representing 56.5% of listings. This suggests many properties have significant open periods on their calendars.
- Approximately 82.6% of listings show high availability (181+ days open annually), indicating potential for increased bookings or specific owner usage patterns.
- For booked days, the 31-90 days range is most frequent in Sainte-Suzanne-et-Chammes (39.1%), reflecting common guest stay durations or potential owner blocking patterns.
- A notable 17.4% of properties secure long booking periods (181+ days booked per year), highlighting successful long-term rental strategies or significant owner usage.
Sainte-Suzanne-et-Chammes Airbnb Minimum Stay Requirements Analysis
Distribution of Listings by Minimum Night Requirement
1 Night
11 listings
50% of total
2 Nights
6 listings
27.3% of total
3 Nights
1 listings
4.5% of total
30+ Nights
4 listings
18.2% of total
Key Insights
- The most prevalent minimum stay requirement in Sainte-Suzanne-et-Chammes is 1 Night, adopted by 50% of listings. This highlights the market's preference for shorter, flexible bookings.
- A strong majority (77.3%) of the Sainte-Suzanne-et-Chammes Airbnb data shows acceptance of very short stays (1-2 nights), indicating a dynamic, high-turnover market.
- A significant segment (18.2%) caters to monthly stays (30+ nights) in Sainte-Suzanne-et-Chammes, pointing to opportunities in the extended-stay market.
Recommendations
- Align with the market by considering a 1 Night minimum stay, as 50% of Sainte-Suzanne-et-Chammes hosts use this setting.
- Explore offering discounts for stays of 30+ nights to attract the 18.2% of the market seeking extended stays.
- Adjust minimum nights based on seasonality – potentially shorter during low season and longer during peak demand periods in Sainte-Suzanne-et-Chammes.
Sainte-Suzanne-et-Chammes Airbnb Cancellation Policy Trends Analysis (2025)
Flexible
4 listings
19% of total
Moderate
6 listings
28.6% of total
Firm
5 listings
23.8% of total
Strict
6 listings
28.6% of total
Cancellation Policy Insights for Sainte-Suzanne-et-Chammes
- The prevailing Airbnb cancellation policy trend in Sainte-Suzanne-et-Chammes is Moderate, used by 28.6% of listings.
- A majority (52.4%) of hosts in Sainte-Suzanne-et-Chammes utilize Firm or Strict policies, indicating a market where hosts prioritize booking security.
Recommendations for Hosts
- Consider adopting a Moderate policy to align with the 28.6% market standard in Sainte-Suzanne-et-Chammes.
- Regularly review your cancellation policy against competitors and market demand shifts in Sainte-Suzanne-et-Chammes.
Sainte-Suzanne-et-Chammes STR Booking Lead Time Analysis (2025)
Average Booking Lead Time by Month
Booking Lead Time Insights for Sainte-Suzanne-et-Chammes
- The overall average booking lead time for vacation rentals in Sainte-Suzanne-et-Chammes is 47 days.
- Guests book furthest in advance for stays during June (average 71 days), likely coinciding with peak travel demand or local events.
- The shortest booking windows occur for stays in February (average 18 days), indicating more last-minute travel plans during this time.
- Seasonally, Summer (63 days avg.) sees the longest lead times, while Winter (30 days avg.) has the shortest, reflecting typical travel planning cycles.
Recommendations for Hosts
- Use the overall average lead time (47 days) as a baseline for your pricing and availability strategy in Sainte-Suzanne-et-Chammes.
- For June stays, consider implementing length-of-stay discounts or slightly higher rates for bookings made less than 71 days out to capitalize on advance planning.
- Target marketing efforts for the Summer season well in advance (at least 63 days) to capture early planners.
- Monitor your own booking lead times against these Sainte-Suzanne-et-Chammes averages to identify opportunities for dynamic pricing adjustments.
Popular & Essential Airbnb Amenities in Sainte-Suzanne-et-Chammes (2025)
Amenity Prevalence
Amenity Insights for Sainte-Suzanne-et-Chammes
- Popular amenities like Free parking on premises, Wifi, Essentials are common but not universal. Offering these can provide a competitive edge.
- Warning: Wifi is not universally provided but is considered essential globally. Ensure reliable Wifi is offered.
Recommendations for Hosts
- Consider adding popular differentiators like Free parking on premises or Wifi to increase appeal.
- Highlight unique or less common amenities you offer (e.g., hot tub, dedicated workspace, EV charger) in your listing description and photos.
- Regularly check competitor amenities in Sainte-Suzanne-et-Chammes to stay competitive.
Sainte-Suzanne-et-Chammes Airbnb Guest Demographics & Profile Analysis (2025)
Guest Profile Summary for Sainte-Suzanne-et-Chammes
- The typical guest profile for Airbnb in Sainte-Suzanne-et-Chammes consists of primarily domestic travelers (79%), often arriving from nearby Paris, typically belonging to the Post-2000s (Gen Z/Alpha) group (50%), primarily speaking French or English.
- Domestic travelers account for 79.0% of guests.
- Key international markets include France (79%) and United Kingdom (7.6%).
- Top languages spoken are French (43.8%) followed by English (39.3%).
- A significant demographic segment is the Post-2000s (Gen Z/Alpha) group, representing 50% of guests.
Recommendations for Hosts
- Target domestic marketing efforts towards travelers from Paris and Rennes.
- Tailor amenities and listing descriptions to appeal to the dominant Post-2000s (Gen Z/Alpha) demographic (e.g., highlight fast WiFi, smart home features, local guides).
- Highlight unique local experiences or amenities relevant to the primary guest profile.
- Consider seasonal promotions aligned with peak travel times for key origin markets.
Nearby Short-Term Rental Market Comparison
How does the Sainte-Suzanne-et-Chammes Airbnb market stack up against its neighbors? Compare key performance metrics like average monthly revenue, ADR, and occupancy rates in surrounding areas to understand the broader regional STR landscape.
| Market | Active Properties | Monthly Revenue | Daily Rate | Avg. Occupancy |
|---|---|---|---|---|
| La Poterie-Cap-d'Antifer | 11 | $5,076 | $293.95 | 55% |
| Bonneville-sur-Touques | 16 | $3,903 | $367.00 | 40% |
| Luneray | 12 | $3,745 | $526.24 | 42% |
| Saint-Étienne-la-Thillaye | 24 | $3,459 | $325.89 | 42% |
| Cricquebœuf | 10 | $3,417 | $268.29 | 46% |
| Caumont | 11 | $3,350 | $286.17 | 49% |
| Coteaux-sur-Loire | 19 | $3,328 | $270.00 | 41% |
| Moulins-le-Carbonnel | 11 | $3,213 | $320.85 | 35% |
| Gonneville-en-Auge | 12 | $3,061 | $235.90 | 40% |
| Villiers-sur-Loir | 10 | $2,967 | $216.51 | 41% |