Saint-Mars-la-Réorthe Airbnb Market Analysis 2025: Short Term Rental Data & Vacation Rental Statistics in Pays de la Loire, France
Is Airbnb profitable in Saint-Mars-la-Réorthe in 2025? Explore comprehensive Airbnb analytics for Saint-Mars-la-Réorthe, Pays de la Loire, France to uncover income potential. This 2025 STR market report for Saint-Mars-la-Réorthe, based on AirROI data from April 2024 to March 2025, reveals key trends in the niche market of 17 active listings.
Whether you're considering an Airbnb investment in Saint-Mars-la-Réorthe, optimizing your existing vacation rental, or exploring rental arbitrage opportunities, understanding the Saint-Mars-la-Réorthe Airbnb data is crucial. Understanding the local regulations is key to maximizing your short term rental income potential. Let's dive into the specifics.
Key Saint-Mars-la-Réorthe Airbnb Performance Metrics Overview
Monthly Airbnb Revenue Variations & Income Potential in Saint-Mars-la-Réorthe (2025)
Understanding the monthly revenue variations for Airbnb listings in Saint-Mars-la-Réorthe is key to maximizing your short term rental income potential. Seasonality significantly impacts earnings. Our analysis, based on data from the past 12 months, shows that the peak revenue month for STRs in Saint-Mars-la-Réorthe is typically June, while January often presents the lowest earnings, highlighting opportunities for strategic pricing adjustments during shoulder and low seasons. Explore the typical Airbnb income in Saint-Mars-la-Réorthe across different performance tiers:
- Best-in-class properties (Top 10%) achieve $5,050+ monthly, often utilizing dynamic pricing and superior guest experiences.
- Strong performing properties (Top 25%) earn $3,071 or more, indicating effective management and desirable locations/amenities.
- Typical properties (Median) generate around $1,850 per month, representing the average market performance.
- Entry-level properties (Bottom 25%) see earnings around $1,261, often with potential for optimization.
Average Monthly Airbnb Earnings Trend in Saint-Mars-la-Réorthe
Saint-Mars-la-Réorthe Airbnb Occupancy Rate Trends (2025)
Maximize your bookings by understanding the Saint-Mars-la-Réorthe STR occupancy trends. Seasonal demand shifts significantly influence how often properties are booked. Typically, Augustsees the highest demand (peak season occupancy), while January experiences the lowest (low season). Effective strategies, like adjusting minimum stays or offering promotions, can boost occupancy during slower periods. Here's how different property tiers perform in Saint-Mars-la-Réorthe:
- Best-in-class properties (Top 10%) achieve 70%+ occupancy, indicating high desirability and potentially optimized availability.
- Strong performing properties (Top 25%) maintain 53% or higher occupancy, suggesting good market fit and guest satisfaction.
- Typical properties (Median) have an occupancy rate around 37%.
- Entry-level properties (Bottom 25%) average 20% occupancy, potentially facing higher vacancy.
Average Monthly Occupancy Rate Trend in Saint-Mars-la-Réorthe
Average Daily Rate (ADR) Airbnb Trends in Saint-Mars-la-Réorthe (2025)
Effective short term rental pricing strategy in Saint-Mars-la-Réorthe involves understanding monthly ADR fluctuations. The Average Daily Rate (ADR) for Airbnb in Saint-Mars-la-Réorthe typically peaks in December and dips lowest during September. Leveraging Airbnb dynamic pricing tools or strategies based on this seasonality can significantly boost revenue. Here's a look at the typical nightly rates achieved:
- Best-in-class properties (Top 10%) command rates of $471+ per night, often due to premium features or locations.
- Strong performing properties (Top 25%) achieve nightly rates of $238 or more.
- Typical properties (Median) charge around $120 per night.
- Entry-level properties (Bottom 25%) earn around $97 per night.
Average Daily Rate (ADR) Trend by Month in Saint-Mars-la-Réorthe
Get Live Saint-Mars-la-Réorthe Market Intelligence 👇

Explore Real-time Analytics
Airbnb Seasonality Analysis & Trends in Saint-Mars-la-Réorthe (2025)
Peak Season (June, May, August)
- Revenue averages $3,906 per month
- Occupancy rates average 54.5%
- Daily rates average $188
Shoulder Season
- Revenue averages $2,495 per month
- Occupancy maintains around 42.1%
- Daily rates hold near $196
Low Season (January, February, March)
- Revenue drops to average $1,026 per month
- Occupancy decreases to average 22.0%
- Daily rates adjust to average $205
Seasonality Insights for Saint-Mars-la-Réorthe
- The Airbnb seasonality in Saint-Mars-la-Réorthe shows highly seasonal trends requiring careful strategy. While the sections above show seasonal averages, it's also insightful to look at the extremes:
- During the high season, the absolute peak month showcases Saint-Mars-la-Réorthe's highest earning potential, with monthly revenues capable of climbing to $3,942, occupancy reaching a high of 70.8%, and ADRs peaking at $222.
- Conversely, the slowest single month of the year, typically falling within the low season, marks the market's lowest point. In this month, revenue might dip to $759, occupancy could drop to 14.3%, and ADRs may adjust down to $182.
- Understanding both the seasonal averages and these monthly peaks and troughs in revenue, occupancy, and ADR is crucial for maximizing your Airbnb profit potential in Saint-Mars-la-Réorthe.
Seasonal Strategies for Maximizing Profit
- Peak Season: Maximize revenue through premium pricing and potentially longer minimum stays. Ensure high availability.
- Low Season: Offer competitive pricing, special promotions (e.g., extended stay discounts), and flexible cancellation policies. Target off-season travelers like remote workers or budget-conscious guests.
- Shoulder Seasons: Implement dynamic pricing that balances peak and low rates. Target weekend travelers or specific events. Offer slightly more flexible terms than peak season.
- Regularly analyze your own performance against these Saint-Mars-la-Réorthe seasonality benchmarks and adjust your pricing and availability strategy accordingly.
Best Areas for Airbnb Investment in Saint-Mars-la-Réorthe (2025)
Exploring the top neighborhoods for short-term rentals in Saint-Mars-la-Réorthe? This section highlights key areas, outlining why they are attractive for hosts and guests, along with notable local attractions. Consider these locations based on your target guest profile and investment strategy.
| Neighborhood / Area | Why Host Here? (Target Guests & Appeal) | Key Attractions & Landmarks |
|---|---|---|
| La Vallée de la Sèvre | A tranquil valley perfect for nature lovers, ideal for those seeking relaxation away from city life. | Sèvre Nantaise River, Château de Talmont, Hiking trails, Canoeing, Local hiking paths |
| Les Herbiers | A vibrant town close to the Puy du Fou theme park, popular with families and tourists. | Puy du Fou, Château des Gilles, Local markets, Cultural events, Nearby lakes |
| Château de la Flocellière | Historic château offering a unique stay experience. Great for romantic getaways and family gatherings. | Château de la Flocellière, Surrounding gardens, Historical tours, Local vineyards, Art exhibitions |
| Montaigu | A charming town with rich history and picturesque streets, appealing to those interested in local culture. | Historic center, Church of Saint-Georges, Local festivals, Nearby countryside, Riverside walks |
| Saint-Fulgent | A quaint town with local charm and a close proximity to nature, perfect for scenic getaways. | Saint-Fulgent Church, Local artisanal shops, Nearby forests, Trails for cycling and hiking, Local cuisine |
| Les Sables-d'Olonne | A beautiful coastal town known for its beaches and oceanic activities, making it attractive for beach lovers. | La Grande Plage, Les Sables-d'Olonne Aquarium, Harbor tours, Coastal walks, Water sports |
| Fontenay-le-Comte | A historical town known for its rich architectural heritage, attracting history enthusiasts. | Place Bressuire, The Castle of Fontenay-le-Comte, Museums, Local festivals, Scenic parks |
| Terra Botanica | An eco-park and botanical garden that offers unique experiences in nature and is suited for families. | Botanical exhibits, Themed gardens, Family-friendly activities, Workshops, Nearby hotels |
Understanding Airbnb License Requirements & STR Laws in Saint-Mars-la-Réorthe (2025)
With 12% of listings showing registration in 2025, understanding potential Airbnb license requirements is crucial in Saint-Mars-la-Réorthe. Always verify the latest short term rental regulations and Airbnb license requirements directly with local government authorities for Saint-Mars-la-Réorthe to ensure full compliance before hosting.
(Source: AirROI data, 2025, based on 12% licensed listings)
Top Performing Airbnb Properties in Saint-Mars-la-Réorthe (2025)
Benchmark your potential! Explore examples of top-performing Airbnb properties in Saint-Mars-la-Réorthebased on Trailing Twelve Month (TTM) revenue. Analyze their characteristics, revenue, occupancy rate, and ADR to understand what drives success in this market.
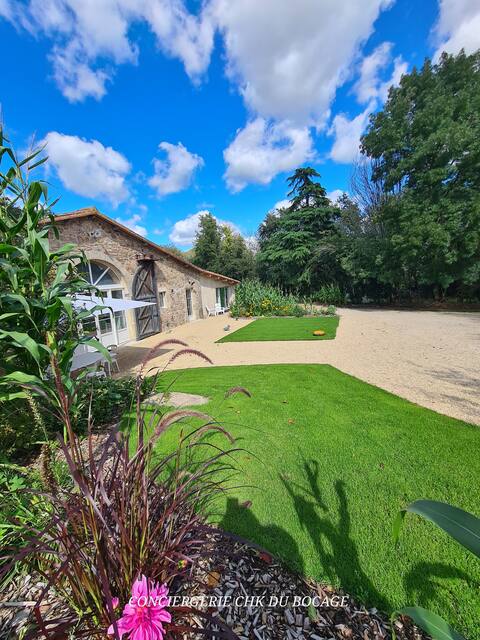
Gite Le Puy Martineau indoor pool
Entire Place • 4 bedrooms
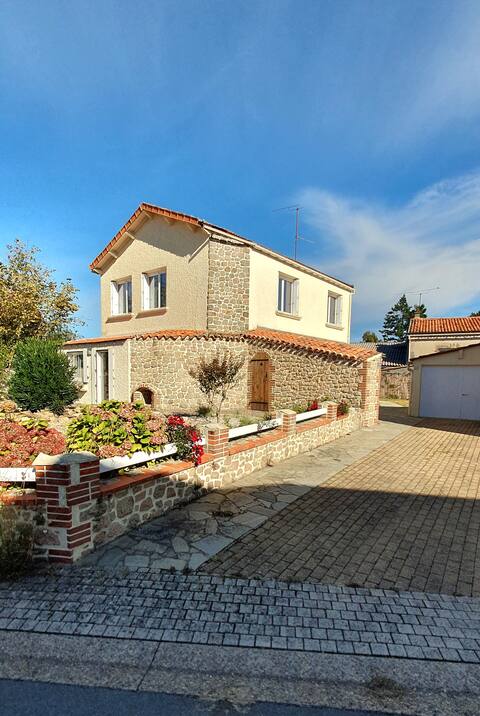
Le Marsiluga Maison 12 pers 6 min from Puy du Fou
Entire Place • 5 bedrooms
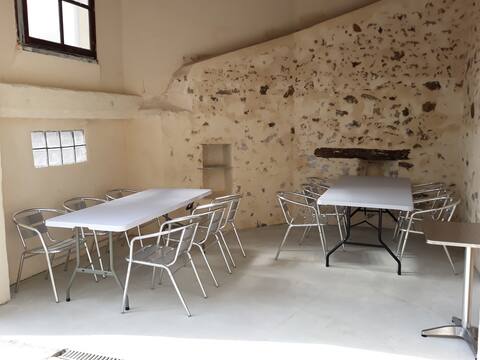
large gite of the marsi fountain 24 pers.
Private Room • 6 bedrooms
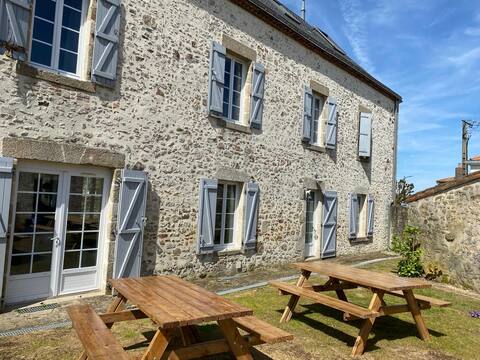
La Belle Step family cottage -10min from Puy du Fou
Entire Place • 4 bedrooms
Maison des Mésanges 3 mins from Puy du Fou
Entire Place • 4 bedrooms
cottage near Puy du Fou les Epesses 15 pers.
Entire Place • 4 bedrooms
Note: Performance varies based on location, size, amenities, seasonality, and management quality. Data reflects the past 12 months.
Top Performing Airbnb Hosts in Saint-Mars-la-Réorthe (2025)
Learn from the best! This table showcases top-performing Airbnb hosts in Saint-Mars-la-Réorthe based on the number of properties managed and estimated total revenue over the past year. Analyze their scale and performance metrics.
| Host Name | Properties | Grossing Revenue | Stay Reviews | Avg Rating |
|---|---|---|---|---|
| CHK Conciergerie | 2 | $121,614 | 33 | 4.78/5.0 |
| Bernard | 2 | $66,603 | 18 | 5.00/5.0 |
| Corentin | 1 | $47,676 | 41 | 4.95/5.0 |
| Omnubo Collection | 2 | $37,146 | 9 | 2.44/5.0 |
| Eric | 2 | $29,146 | 266 | 4.94/5.0 |
| Délizia EtJérôme | 1 | $28,704 | 75 | 5.00/5.0 |
| Anaïs | 1 | $24,938 | 34 | 5.00/5.0 |
| Martine | 1 | $21,466 | 252 | 5.00/5.0 |
| Eric | 1 | $19,053 | 46 | 4.78/5.0 |
| Host #269815640 | 1 | $16,437 | 31 | 4.84/5.0 |
Analyzing the strategies of top hosts, such as their property selection, pricing, and guest communication, can offer valuable lessons for optimizing your own Airbnb operations in Saint-Mars-la-Réorthe.
Dive Deeper: Advanced Saint-Mars-la-Réorthe STR Market Data (2025)
Ready to unlock more insights? AirROI provides access to advanced metrics and comprehensive Airbnb data for Saint-Mars-la-Réorthe. Explore detailed analytics beyond this report to refine your investment strategy, optimize pricing, and maximize your vacation rental profits.
Explore Advanced MetricsSaint-Mars-la-Réorthe Short-Term Rental Market Composition (2025): Property & Room Types
Room Type Distribution
Property Type Distribution
Market Composition Insights for Saint-Mars-la-Réorthe
- The Saint-Mars-la-Réorthe Airbnb market composition is heavily skewed towards Entire Home/Apt listings, which make up 82.4% of the 17 active rentals. This indicates strong guest preference for privacy and space.
- Looking at the property type distribution in Saint-Mars-la-Réorthe, House properties are the most common (58.8%), reflecting the local real estate landscape.
- Houses represent a significant 58.8% portion, catering likely to families or larger groups.
- The presence of 29.4% Hotel/Boutique listings indicates integration with traditional hospitality.
Saint-Mars-la-Réorthe Airbnb Room Capacity Analysis (2025): Bedroom Distribution
Distribution of Listings by Number of Bedrooms
Room Capacity Insights for Saint-Mars-la-Réorthe
- The dominant room capacity in Saint-Mars-la-Réorthe is 2 bedrooms listings, making up 29.4% of the market. This suggests a strong demand for properties suitable for couples or solo travelers.
- Together, 2 bedrooms and 1 bedroom properties represent 52.9% of the active Airbnb listings in Saint-Mars-la-Réorthe, indicating a high concentration in these sizes.
- A significant 35.3% of listings offer 3+ bedrooms, catering to larger groups and families seeking more space in Saint-Mars-la-Réorthe.
Saint-Mars-la-Réorthe Vacation Rental Guest Capacity Trends (2025)
Distribution of Listings by Guest Capacity
Guest Capacity Insights for Saint-Mars-la-Réorthe
- The most common guest capacity trend in Saint-Mars-la-Réorthe vacation rentals is listings accommodating 8+ guests (35.3%). This suggests the primary traveler segment is likely larger groups.
- Properties designed for 8+ guests and 4 guests dominate the Saint-Mars-la-Réorthe STR market, accounting for 70.6% of listings.
- 41.2% of properties accommodate 6+ guests, serving the market segment for larger families or group travel in Saint-Mars-la-Réorthe.
- On average, properties in Saint-Mars-la-Réorthe are equipped to host 5.2 guests.
Saint-Mars-la-Réorthe Airbnb Booking Patterns (2025): Available vs. Booked Days
Available Days Distribution
Booked Days Distribution
Booking Pattern Insights for Saint-Mars-la-Réorthe
- The most common availability pattern in Saint-Mars-la-Réorthe falls within the 181-270 days range, representing 41.2% of listings. This suggests many properties have significant open periods on their calendars.
- Approximately 64.7% of listings show high availability (181+ days open annually), indicating potential for increased bookings or specific owner usage patterns.
- For booked days, the 91-180 days range is most frequent in Saint-Mars-la-Réorthe (47.1%), reflecting common guest stay durations or potential owner blocking patterns.
- A notable 35.3% of properties secure long booking periods (181+ days booked per year), highlighting successful long-term rental strategies or significant owner usage.
Saint-Mars-la-Réorthe Airbnb Minimum Stay Requirements Analysis
Distribution of Listings by Minimum Night Requirement
1 Night
1 listings
6.7% of total
2 Nights
13 listings
86.7% of total
30+ Nights
1 listings
6.7% of total
Key Insights
- The most prevalent minimum stay requirement in Saint-Mars-la-Réorthe is 2 Nights, adopted by 86.7% of listings. This highlights the market's preference for shorter, flexible bookings.
- A strong majority (93.4%) of the Saint-Mars-la-Réorthe Airbnb data shows acceptance of very short stays (1-2 nights), indicating a dynamic, high-turnover market.
Recommendations
- Align with the market by considering a 2 Nights minimum stay, as 86.7% of Saint-Mars-la-Réorthe hosts use this setting.
- If feasible, allowing 1-night stays, especially midweek or during low season, could capture last-minute bookings, as only 6.7% currently do.
- A 2-night minimum appears standard (86.7%). Consider this for weekends or peak periods.
- Explore offering discounts for stays of 30+ nights to attract the 6.7% of the market seeking extended stays.
- Adjust minimum nights based on seasonality – potentially shorter during low season and longer during peak demand periods in Saint-Mars-la-Réorthe.
Saint-Mars-la-Réorthe Airbnb Cancellation Policy Trends Analysis (2025)
Flexible
5 listings
35.7% of total
Moderate
4 listings
28.6% of total
Firm
3 listings
21.4% of total
Strict
2 listings
14.3% of total
Cancellation Policy Insights for Saint-Mars-la-Réorthe
- The prevailing Airbnb cancellation policy trend in Saint-Mars-la-Réorthe is Flexible, used by 35.7% of listings.
- There's a relatively balanced mix between guest-friendly (64.3%) and stricter (35.7%) policies, offering choices for different guest needs.
Recommendations for Hosts
- Consider adopting a Flexible policy to align with the 35.7% market standard in Saint-Mars-la-Réorthe.
- Using a Strict policy might deter some guests, as only 14.3% of listings use it. Evaluate if potential revenue protection outweighs possible lower booking rates.
- Regularly review your cancellation policy against competitors and market demand shifts in Saint-Mars-la-Réorthe.
Saint-Mars-la-Réorthe STR Booking Lead Time Analysis (2025)
Average Booking Lead Time by Month
Booking Lead Time Insights for Saint-Mars-la-Réorthe
- The overall average booking lead time for vacation rentals in Saint-Mars-la-Réorthe is 76 days.
- Guests book furthest in advance for stays during June (average 164 days), likely coinciding with peak travel demand or local events.
- The shortest booking windows occur for stays in November (average 48 days), indicating more last-minute travel plans during this time.
- Seasonally, Spring (131 days avg.) sees the longest lead times, while Fall (57 days avg.) has the shortest, reflecting typical travel planning cycles.
Recommendations for Hosts
- Use the overall average lead time (76 days) as a baseline for your pricing and availability strategy in Saint-Mars-la-Réorthe.
- For June stays, consider implementing length-of-stay discounts or slightly higher rates for bookings made less than 164 days out to capitalize on advance planning.
- Target marketing efforts for the Spring season well in advance (at least 131 days) to capture early planners.
- Monitor your own booking lead times against these Saint-Mars-la-Réorthe averages to identify opportunities for dynamic pricing adjustments.
Popular & Essential Airbnb Amenities in Saint-Mars-la-Réorthe (2025)
Amenity Prevalence
Amenity Insights for Saint-Mars-la-Réorthe
- Essential amenities in Saint-Mars-la-Réorthe that guests expect include: Free parking on premises, Heating, Wifi. Lacking these (any) could significantly impact bookings.
- Popular amenities like Hot water, Kitchen, Smoke alarm are common but not universal. Offering these can provide a competitive edge.
Recommendations for Hosts
- Ensure your listing includes all essential amenities for Saint-Mars-la-Réorthe: Free parking on premises, Heating, Wifi.
- Consider adding popular differentiators like Hot water or Kitchen to increase appeal.
- Highlight unique or less common amenities you offer (e.g., hot tub, dedicated workspace, EV charger) in your listing description and photos.
- Regularly check competitor amenities in Saint-Mars-la-Réorthe to stay competitive.
Saint-Mars-la-Réorthe Airbnb Guest Demographics & Profile Analysis (2025)
Guest Profile Summary for Saint-Mars-la-Réorthe
- The typical guest profile for Airbnb in Saint-Mars-la-Réorthe consists of primarily domestic travelers (93%), often arriving from nearby Paris, typically belonging to the Post-2000s (Gen Z/Alpha) group (50%), primarily speaking French or English.
- Domestic travelers account for 93.1% of guests.
- Key international markets include France (93.1%) and United Kingdom (2.5%).
- Top languages spoken are French (49.1%) followed by English (33.7%).
- A significant demographic segment is the Post-2000s (Gen Z/Alpha) group, representing 50% of guests.
Recommendations for Hosts
- Target domestic marketing efforts towards travelers from Paris and Bordeaux.
- Tailor amenities and listing descriptions to appeal to the dominant Post-2000s (Gen Z/Alpha) demographic (e.g., highlight fast WiFi, smart home features, local guides).
- Highlight unique local experiences or amenities relevant to the primary guest profile.
- Consider seasonal promotions aligned with peak travel times for key origin markets.
Nearby Short-Term Rental Market Comparison
How does the Saint-Mars-la-Réorthe Airbnb market stack up against its neighbors? Compare key performance metrics like average monthly revenue, ADR, and occupancy rates in surrounding areas to understand the broader regional STR landscape.
| Market | Active Properties | Monthly Revenue | Daily Rate | Avg. Occupancy |
|---|---|---|---|---|
| Coteaux-sur-Loire | 19 | $3,328 | $270.00 | 41% |
| Villiers-sur-Loir | 10 | $2,967 | $216.51 | 41% |
| Artannes-sur-Indre | 21 | $2,949 | $275.91 | 41% |
| Vallon-sur-Gée | 11 | $2,913 | $379.01 | 30% |
| Bourneau | 11 | $2,747 | $442.07 | 35% |
| Nuaillé-d'Aunis | 10 | $2,741 | $373.83 | 37% |
| Ambillou | 18 | $2,701 | $370.97 | 28% |
| Le Bois-Plage-en-Ré | 303 | $2,528 | $284.63 | 45% |
| Chambellay | 11 | $2,525 | $255.24 | 34% |
| Le Grand-Pressigny | 11 | $2,511 | $266.72 | 31% |