Saint-Julien-des-Landes Airbnb Market Analysis 2025: Short Term Rental Data & Vacation Rental Statistics in Pays de la Loire, France
Is Airbnb profitable in Saint-Julien-des-Landes in 2025? Explore comprehensive Airbnb analytics for Saint-Julien-des-Landes, Pays de la Loire, France to uncover income potential. This 2025 STR market report for Saint-Julien-des-Landes, based on AirROI data from April 2024 to March 2025, reveals key trends in the niche market of 29 active listings.
Whether you're considering an Airbnb investment in Saint-Julien-des-Landes, optimizing your existing vacation rental, or exploring rental arbitrage opportunities, understanding the Saint-Julien-des-Landes Airbnb data is crucial. Understanding the local regulations is key to maximizing your short term rental income potential. Let's dive into the specifics.
Key Saint-Julien-des-Landes Airbnb Performance Metrics Overview
Monthly Airbnb Revenue Variations & Income Potential in Saint-Julien-des-Landes (2025)
Understanding the monthly revenue variations for Airbnb listings in Saint-Julien-des-Landes is key to maximizing your short term rental income potential. Seasonality significantly impacts earnings. Our analysis, based on data from the past 12 months, shows that the peak revenue month for STRs in Saint-Julien-des-Landes is typically August, while March often presents the lowest earnings, highlighting opportunities for strategic pricing adjustments during shoulder and low seasons. Explore the typical Airbnb income in Saint-Julien-des-Landes across different performance tiers:
- Best-in-class properties (Top 10%) achieve $3,126+ monthly, often utilizing dynamic pricing and superior guest experiences.
- Strong performing properties (Top 25%) earn $2,013 or more, indicating effective management and desirable locations/amenities.
- Typical properties (Median) generate around $1,189 per month, representing the average market performance.
- Entry-level properties (Bottom 25%) see earnings around $648, often with potential for optimization.
Average Monthly Airbnb Earnings Trend in Saint-Julien-des-Landes
Saint-Julien-des-Landes Airbnb Occupancy Rate Trends (2025)
Maximize your bookings by understanding the Saint-Julien-des-Landes STR occupancy trends. Seasonal demand shifts significantly influence how often properties are booked. Typically, Augustsees the highest demand (peak season occupancy), while March experiences the lowest (low season). Effective strategies, like adjusting minimum stays or offering promotions, can boost occupancy during slower periods. Here's how different property tiers perform in Saint-Julien-des-Landes:
- Best-in-class properties (Top 10%) achieve 76%+ occupancy, indicating high desirability and potentially optimized availability.
- Strong performing properties (Top 25%) maintain 55% or higher occupancy, suggesting good market fit and guest satisfaction.
- Typical properties (Median) have an occupancy rate around 40%.
- Entry-level properties (Bottom 25%) average 21% occupancy, potentially facing higher vacancy.
Average Monthly Occupancy Rate Trend in Saint-Julien-des-Landes
Average Daily Rate (ADR) Airbnb Trends in Saint-Julien-des-Landes (2025)
Effective short term rental pricing strategy in Saint-Julien-des-Landes involves understanding monthly ADR fluctuations. The Average Daily Rate (ADR) for Airbnb in Saint-Julien-des-Landes typically peaks in November and dips lowest during April. Leveraging Airbnb dynamic pricing tools or strategies based on this seasonality can significantly boost revenue. Here's a look at the typical nightly rates achieved:
- Best-in-class properties (Top 10%) command rates of $297+ per night, often due to premium features or locations.
- Strong performing properties (Top 25%) achieve nightly rates of $179 or more.
- Typical properties (Median) charge around $111 per night.
- Entry-level properties (Bottom 25%) earn around $77 per night.
Average Daily Rate (ADR) Trend by Month in Saint-Julien-des-Landes
Get Live Saint-Julien-des-Landes Market Intelligence 👇

Explore Real-time Analytics
Airbnb Seasonality Analysis & Trends in Saint-Julien-des-Landes (2025)
Peak Season (August, June, July)
- Revenue averages $2,286 per month
- Occupancy rates average 53.8%
- Daily rates average $145
Shoulder Season
- Revenue averages $1,449 per month
- Occupancy maintains around 38.7%
- Daily rates hold near $145
Low Season (January, February, March)
- Revenue drops to average $754 per month
- Occupancy decreases to average 30.4%
- Daily rates adjust to average $151
Seasonality Insights for Saint-Julien-des-Landes
- The Airbnb seasonality in Saint-Julien-des-Landes shows highly seasonal trends requiring careful strategy. While the sections above show seasonal averages, it's also insightful to look at the extremes:
- During the high season, the absolute peak month showcases Saint-Julien-des-Landes's highest earning potential, with monthly revenues capable of climbing to $2,701, occupancy reaching a high of 64.5%, and ADRs peaking at $160.
- Conversely, the slowest single month of the year, typically falling within the low season, marks the market's lowest point. In this month, revenue might dip to $461, occupancy could drop to 16.2%, and ADRs may adjust down to $139.
- Understanding both the seasonal averages and these monthly peaks and troughs in revenue, occupancy, and ADR is crucial for maximizing your Airbnb profit potential in Saint-Julien-des-Landes.
Seasonal Strategies for Maximizing Profit
- Peak Season: Maximize revenue through premium pricing and potentially longer minimum stays. Ensure high availability.
- Low Season: Offer competitive pricing, special promotions (e.g., extended stay discounts), and flexible cancellation policies. Target off-season travelers like remote workers or budget-conscious guests.
- Shoulder Seasons: Implement dynamic pricing that balances peak and low rates. Target weekend travelers or specific events. Offer slightly more flexible terms than peak season.
- Regularly analyze your own performance against these Saint-Julien-des-Landes seasonality benchmarks and adjust your pricing and availability strategy accordingly.
Best Areas for Airbnb Investment in Saint-Julien-des-Landes (2025)
Exploring the top neighborhoods for short-term rentals in Saint-Julien-des-Landes? This section highlights key areas, outlining why they are attractive for hosts and guests, along with notable local attractions. Consider these locations based on your target guest profile and investment strategy.
| Neighborhood / Area | Why Host Here? (Target Guests & Appeal) | Key Attractions & Landmarks |
|---|---|---|
| Les Sables-d'Olonne | A vibrant coastal city known for its beautiful beaches, charming promenade, and maritime heritage. It's a popular summer destination for tourists, making it ideal for Airbnb hosting. | Les Sables-d'Olonne Beach, Promenade de l'Océan, Parc zoologique des Sables d'Olonne, Les Atlantes Casino, La Chaume |
| Saint-Gilles-Croix-de-Vie | A charming seaside town known for its picturesque harbor and beaches. Ideal for families and beachgoers, attracting visitors for water sports and relaxation. | Plage de Boisvinet, Fishing port, Promenade en bord de mer, Lounge beaches, Local markets |
| Talmont-Saint-Hilaire | A historical town with a rich heritage, featuring the medieval Château de Talmont. It attracts history enthusiasts as well as beach lovers. | Château de Talmont, Plage de Talmont, Bicycle paths, Les Marais de Talmont, Local restaurants |
| La Roche-sur-Yon | The industrial and administrative center of Vendée with a vibrant cultural scene. Ideal for business travelers and those visiting local attractions. | Place Napoléon, Parc des expositions, Museums, Shopping centers, Local gastronomy |
| L'Aiguillon-sur-Mer | A small coastal village famous for its natural beauty and proximity to the marshes. It attracts nature lovers and those looking to escape the city. | Marais Poitevin, Bicycle trails, Beaches, Local wildlife, Fishing opportunities |
| Saint-Jean-de-Monts | A popular seaside resort with stunning beaches and a family-friendly atmosphere. Great for summer vacation rentals. | Les Plages de Saint-Jean-de-Monts, Wooded areas, Water sports, Campsites, Lively market |
| Challans | A town known for its market and traditional Vendée culture. It attracts tourists interested in local products and heritage. | Challans Market, Historic center, Local cuisine, Cultural events, Nearby beaches |
| Noirmoutier-en-l'Île | An idyllic island with a mix of beaches and charming villages. A perfect retreat for tourists looking for tranquility and nature. | Noirmoutier Beach, Castle of Noirmoutier, Salt marshes, Cycle routes, Local seafood |
Understanding Airbnb License Requirements & STR Laws in Saint-Julien-des-Landes (2025)
With 14% of listings showing registration in 2025, understanding potential Airbnb license requirements is crucial in Saint-Julien-des-Landes. Always verify the latest short term rental regulations and Airbnb license requirements directly with local government authorities for Saint-Julien-des-Landes to ensure full compliance before hosting.
(Source: AirROI data, 2025, based on 14% licensed listings)
Top Performing Airbnb Properties in Saint-Julien-des-Landes (2025)
Benchmark your potential! Explore examples of top-performing Airbnb properties in Saint-Julien-des-Landesbased on Trailing Twelve Month (TTM) revenue. Analyze their characteristics, revenue, occupancy rate, and ADR to understand what drives success in this market.
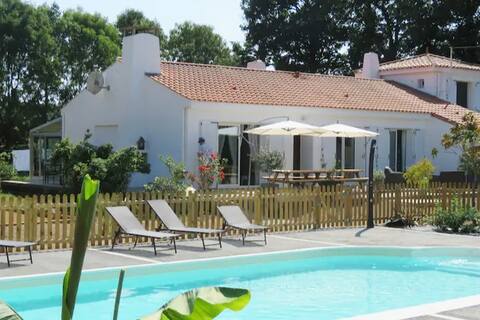
Saint-Julien-des-Landes: family holiday
Entire Place • 4 bedrooms
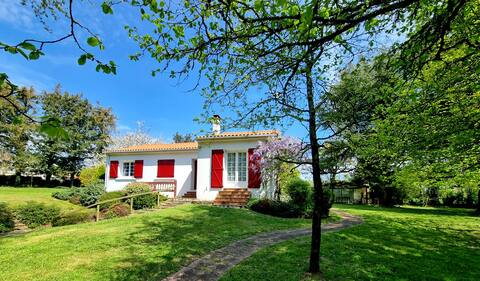
Peaceful villa, 6 people. +1 child, huge garden
Entire Place • 3 bedrooms
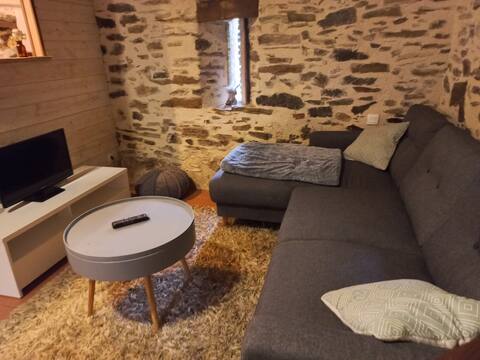
L 'L'Asinerie
Entire Place • 2 bedrooms
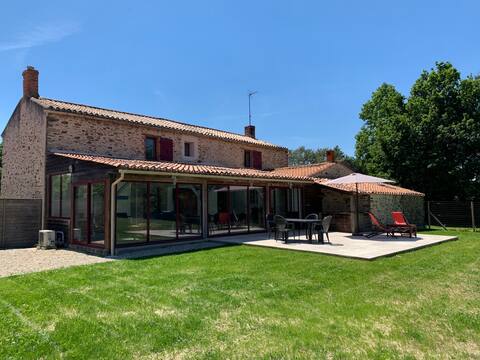
Country home in Vendee
Entire Place • 4 bedrooms

new cottage 15 min from the ocean, 1 hour from Puy du Fou
Entire Place • 2 bedrooms
Studio Le Petit Julien
Entire Place • 1 bedroom
Note: Performance varies based on location, size, amenities, seasonality, and management quality. Data reflects the past 12 months.
Top Performing Airbnb Hosts in Saint-Julien-des-Landes (2025)
Learn from the best! This table showcases top-performing Airbnb hosts in Saint-Julien-des-Landes based on the number of properties managed and estimated total revenue over the past year. Analyze their scale and performance metrics.
| Host Name | Properties | Grossing Revenue | Stay Reviews | Avg Rating |
|---|---|---|---|---|
| Céline | 2 | $33,024 | 29 | 4.56/5.0 |
| Florent | 1 | $24,746 | 33 | 4.94/5.0 |
| Thierry | 1 | $22,182 | 21 | 4.90/5.0 |
| Anita | 2 | $21,377 | 96 | 4.92/5.0 |
| Marine | 1 | $20,597 | 39 | 4.79/5.0 |
| Amandine | 2 | $19,396 | 107 | 4.92/5.0 |
| Théo | 3 | $19,265 | 32 | 4.80/5.0 |
| Patrick | 1 | $19,040 | 31 | 4.90/5.0 |
| Holidu | 1 | $18,695 | 19 | 4.84/5.0 |
| Host #482715271 | 3 | $18,366 | 0 | 0.00/5.0 |
Analyzing the strategies of top hosts, such as their property selection, pricing, and guest communication, can offer valuable lessons for optimizing your own Airbnb operations in Saint-Julien-des-Landes.
Dive Deeper: Advanced Saint-Julien-des-Landes STR Market Data (2025)
Ready to unlock more insights? AirROI provides access to advanced metrics and comprehensive Airbnb data for Saint-Julien-des-Landes. Explore detailed analytics beyond this report to refine your investment strategy, optimize pricing, and maximize your vacation rental profits.
Explore Advanced MetricsSaint-Julien-des-Landes Short-Term Rental Market Composition (2025): Property & Room Types
Room Type Distribution
Property Type Distribution
Market Composition Insights for Saint-Julien-des-Landes
- The Saint-Julien-des-Landes Airbnb market composition is heavily skewed towards Entire Home/Apt listings, which make up 89.7% of the 29 active rentals. This indicates strong guest preference for privacy and space.
- Looking at the property type distribution in Saint-Julien-des-Landes, House properties are the most common (86.2%), reflecting the local real estate landscape.
- Houses represent a significant 86.2% portion, catering likely to families or larger groups.
- Smaller segments like unique stays, hotel/boutique, apartment/condo, others (combined 13.6%) offer potential for unique stay experiences.
Saint-Julien-des-Landes Airbnb Room Capacity Analysis (2025): Bedroom Distribution
Distribution of Listings by Number of Bedrooms
Room Capacity Insights for Saint-Julien-des-Landes
- The dominant room capacity in Saint-Julien-des-Landes is 2 bedrooms listings, making up 31% of the market. This suggests a strong demand for properties suitable for couples or solo travelers.
- Together, 2 bedrooms and 3 bedrooms properties represent 51.7% of the active Airbnb listings in Saint-Julien-des-Landes, indicating a high concentration in these sizes.
- A significant 41.3% of listings offer 3+ bedrooms, catering to larger groups and families seeking more space in Saint-Julien-des-Landes.
Saint-Julien-des-Landes Vacation Rental Guest Capacity Trends (2025)
Distribution of Listings by Guest Capacity
Guest Capacity Insights for Saint-Julien-des-Landes
- The most common guest capacity trend in Saint-Julien-des-Landes vacation rentals is listings accommodating 8+ guests (20.7%). This suggests the primary traveler segment is likely larger groups.
- Properties designed for 8+ guests and 5 guests dominate the Saint-Julien-des-Landes STR market, accounting for 37.9% of listings.
- 37.9% of properties accommodate 6+ guests, serving the market segment for larger families or group travel in Saint-Julien-des-Landes.
- On average, properties in Saint-Julien-des-Landes are equipped to host 4.7 guests.
Saint-Julien-des-Landes Airbnb Booking Patterns (2025): Available vs. Booked Days
Available Days Distribution
Booked Days Distribution
Booking Pattern Insights for Saint-Julien-des-Landes
- The most common availability pattern in Saint-Julien-des-Landes falls within the 271-366 days range, representing 51.7% of listings. This suggests many properties have significant open periods on their calendars.
- Approximately 86.2% of listings show high availability (181+ days open annually), indicating potential for increased bookings or specific owner usage patterns.
- For booked days, the 91-180 days range is most frequent in Saint-Julien-des-Landes (37.9%), reflecting common guest stay durations or potential owner blocking patterns.
- A notable 13.8% of properties secure long booking periods (181+ days booked per year), highlighting successful long-term rental strategies or significant owner usage.
Saint-Julien-des-Landes Airbnb Minimum Stay Requirements Analysis
Distribution of Listings by Minimum Night Requirement
1 Night
11 listings
44% of total
2 Nights
8 listings
32% of total
3 Nights
1 listings
4% of total
4-6 Nights
4 listings
16% of total
7-29 Nights
1 listings
4% of total
Key Insights
- The most prevalent minimum stay requirement in Saint-Julien-des-Landes is 1 Night, adopted by 44% of listings. This highlights the market's preference for shorter, flexible bookings.
- A strong majority (76.0%) of the Saint-Julien-des-Landes Airbnb data shows acceptance of very short stays (1-2 nights), indicating a dynamic, high-turnover market.
Recommendations
- Align with the market by considering a 1 Night minimum stay, as 44% of Saint-Julien-des-Landes hosts use this setting.
- Adjust minimum nights based on seasonality – potentially shorter during low season and longer during peak demand periods in Saint-Julien-des-Landes.
Saint-Julien-des-Landes Airbnb Cancellation Policy Trends Analysis (2025)
Flexible
4 listings
16% of total
Moderate
8 listings
32% of total
Firm
4 listings
16% of total
Strict
9 listings
36% of total
Cancellation Policy Insights for Saint-Julien-des-Landes
- The prevailing Airbnb cancellation policy trend in Saint-Julien-des-Landes is Strict, used by 36% of listings.
- A majority (52.0%) of hosts in Saint-Julien-des-Landes utilize Firm or Strict policies, indicating a market where hosts prioritize booking security.
Recommendations for Hosts
- Consider adopting a Strict policy to align with the 36% market standard in Saint-Julien-des-Landes.
- With 36% using Strict terms, this is a viable option in Saint-Julien-des-Landes, particularly for high-value properties or during peak demand periods.
- Regularly review your cancellation policy against competitors and market demand shifts in Saint-Julien-des-Landes.
Saint-Julien-des-Landes STR Booking Lead Time Analysis (2025)
Average Booking Lead Time by Month
Booking Lead Time Insights for Saint-Julien-des-Landes
- The overall average booking lead time for vacation rentals in Saint-Julien-des-Landes is 65 days.
- Guests book furthest in advance for stays during December (average 94 days), likely coinciding with peak travel demand or local events.
- The shortest booking windows occur for stays in January (average 31 days), indicating more last-minute travel plans during this time.
- Seasonally, Fall (81 days avg.) sees the longest lead times, while Winter (58 days avg.) has the shortest, reflecting typical travel planning cycles.
Recommendations for Hosts
- Use the overall average lead time (65 days) as a baseline for your pricing and availability strategy in Saint-Julien-des-Landes.
- For December stays, consider implementing length-of-stay discounts or slightly higher rates for bookings made less than 94 days out to capitalize on advance planning.
- Target marketing efforts for the Fall season well in advance (at least 81 days) to capture early planners.
- Monitor your own booking lead times against these Saint-Julien-des-Landes averages to identify opportunities for dynamic pricing adjustments.
Popular & Essential Airbnb Amenities in Saint-Julien-des-Landes (2025)
Amenity Prevalence
Amenity Insights for Saint-Julien-des-Landes
- Popular amenities like Hot water, Dishes and silverware, Kitchen are common but not universal. Offering these can provide a competitive edge.
- Warning: Wifi is not universally provided but is considered essential globally. Ensure reliable Wifi is offered.
Recommendations for Hosts
- Consider adding popular differentiators like Hot water or Dishes and silverware to increase appeal.
- Highlight unique or less common amenities you offer (e.g., hot tub, dedicated workspace, EV charger) in your listing description and photos.
- Regularly check competitor amenities in Saint-Julien-des-Landes to stay competitive.
Saint-Julien-des-Landes Airbnb Guest Demographics & Profile Analysis (2025)
Guest Profile Summary for Saint-Julien-des-Landes
- The typical guest profile for Airbnb in Saint-Julien-des-Landes consists of primarily domestic travelers (88%), often arriving from nearby Paris, typically belonging to the Post-2000s (Gen Z/Alpha) group (50%), primarily speaking French or English.
- Domestic travelers account for 88.1% of guests.
- Key international markets include France (88.1%) and United Kingdom (5.6%).
- Top languages spoken are French (55.4%) followed by English (28.4%).
- A significant demographic segment is the Post-2000s (Gen Z/Alpha) group, representing 50% of guests.
Recommendations for Hosts
- Target domestic marketing efforts towards travelers from Paris and Nantes.
- Tailor amenities and listing descriptions to appeal to the dominant Post-2000s (Gen Z/Alpha) demographic (e.g., highlight fast WiFi, smart home features, local guides).
- Highlight unique local experiences or amenities relevant to the primary guest profile.
- Consider seasonal promotions aligned with peak travel times for key origin markets.
Nearby Short-Term Rental Market Comparison
How does the Saint-Julien-des-Landes Airbnb market stack up against its neighbors? Compare key performance metrics like average monthly revenue, ADR, and occupancy rates in surrounding areas to understand the broader regional STR landscape.
| Market | Active Properties | Monthly Revenue | Daily Rate | Avg. Occupancy |
|---|---|---|---|---|
| Vallon-sur-Gée | 11 | $2,913 | $379.01 | 30% |
| Bourneau | 11 | $2,747 | $442.07 | 35% |
| Nuaillé-d'Aunis | 10 | $2,741 | $373.83 | 37% |
| Le Bois-Plage-en-Ré | 303 | $2,528 | $284.63 | 45% |
| Chambellay | 11 | $2,525 | $255.24 | 34% |
| Sainte-Florence | 10 | $2,445 | $233.78 | 46% |
| Saint-Hippolyte | 10 | $2,443 | $204.98 | 44% |
| Abzac | 12 | $2,415 | $349.03 | 36% |
| La Flotte | 396 | $2,382 | $236.53 | 46% |
| Saint-Georges-des-Coteaux | 12 | $2,335 | $187.61 | 43% |