Saint-Jean-de-Boiseau Airbnb Market Analysis 2025: Short Term Rental Data & Vacation Rental Statistics in Pays de la Loire, France
Is Airbnb profitable in Saint-Jean-de-Boiseau in 2025? Explore comprehensive Airbnb analytics for Saint-Jean-de-Boiseau, Pays de la Loire, France to uncover income potential. This 2025 STR market report for Saint-Jean-de-Boiseau, based on AirROI data from April 2024 to March 2025, reveals key trends in the niche market of 23 active listings.
Whether you're considering an Airbnb investment in Saint-Jean-de-Boiseau, optimizing your existing vacation rental, or exploring rental arbitrage opportunities, understanding the Saint-Jean-de-Boiseau Airbnb data is crucial. Leveraging the low regulation environment is key to maximizing your short term rental income potential. Let's dive into the specifics.
Key Saint-Jean-de-Boiseau Airbnb Performance Metrics Overview
Monthly Airbnb Revenue Variations & Income Potential in Saint-Jean-de-Boiseau (2025)
Understanding the monthly revenue variations for Airbnb listings in Saint-Jean-de-Boiseau is key to maximizing your short term rental income potential. Seasonality significantly impacts earnings. Our analysis, based on data from the past 12 months, shows that the peak revenue month for STRs in Saint-Jean-de-Boiseau is typically August, while March often presents the lowest earnings, highlighting opportunities for strategic pricing adjustments during shoulder and low seasons. Explore the typical Airbnb income in Saint-Jean-de-Boiseau across different performance tiers:
- Best-in-class properties (Top 10%) achieve $1,891+ monthly, often utilizing dynamic pricing and superior guest experiences.
- Strong performing properties (Top 25%) earn $1,235 or more, indicating effective management and desirable locations/amenities.
- Typical properties (Median) generate around $783 per month, representing the average market performance.
- Entry-level properties (Bottom 25%) see earnings around $494, often with potential for optimization.
Average Monthly Airbnb Earnings Trend in Saint-Jean-de-Boiseau
Saint-Jean-de-Boiseau Airbnb Occupancy Rate Trends (2025)
Maximize your bookings by understanding the Saint-Jean-de-Boiseau STR occupancy trends. Seasonal demand shifts significantly influence how often properties are booked. Typically, Augustsees the highest demand (peak season occupancy), while January experiences the lowest (low season). Effective strategies, like adjusting minimum stays or offering promotions, can boost occupancy during slower periods. Here's how different property tiers perform in Saint-Jean-de-Boiseau:
- Best-in-class properties (Top 10%) achieve 77%+ occupancy, indicating high desirability and potentially optimized availability.
- Strong performing properties (Top 25%) maintain 65% or higher occupancy, suggesting good market fit and guest satisfaction.
- Typical properties (Median) have an occupancy rate around 47%.
- Entry-level properties (Bottom 25%) average 30% occupancy, potentially facing higher vacancy.
Average Monthly Occupancy Rate Trend in Saint-Jean-de-Boiseau
Average Daily Rate (ADR) Airbnb Trends in Saint-Jean-de-Boiseau (2025)
Effective short term rental pricing strategy in Saint-Jean-de-Boiseau involves understanding monthly ADR fluctuations. The Average Daily Rate (ADR) for Airbnb in Saint-Jean-de-Boiseau typically peaks in July and dips lowest during March. Leveraging Airbnb dynamic pricing tools or strategies based on this seasonality can significantly boost revenue. Here's a look at the typical nightly rates achieved:
- Best-in-class properties (Top 10%) command rates of $117+ per night, often due to premium features or locations.
- Strong performing properties (Top 25%) achieve nightly rates of $97 or more.
- Typical properties (Median) charge around $55 per night.
- Entry-level properties (Bottom 25%) earn around $45 per night.
Average Daily Rate (ADR) Trend by Month in Saint-Jean-de-Boiseau
Get Live Saint-Jean-de-Boiseau Market Intelligence 👇

Explore Real-time Analytics
Airbnb Seasonality Analysis & Trends in Saint-Jean-de-Boiseau (2025)
Peak Season (August, July, September)
- Revenue averages $1,477 per month
- Occupancy rates average 61.0%
- Daily rates average $76
Shoulder Season
- Revenue averages $885 per month
- Occupancy maintains around 46.8%
- Daily rates hold near $73
Low Season (January, February, March)
- Revenue drops to average $547 per month
- Occupancy decreases to average 34.0%
- Daily rates adjust to average $67
Seasonality Insights for Saint-Jean-de-Boiseau
- The Airbnb seasonality in Saint-Jean-de-Boiseau shows highly seasonal trends requiring careful strategy. While the sections above show seasonal averages, it's also insightful to look at the extremes:
- During the high season, the absolute peak month showcases Saint-Jean-de-Boiseau's highest earning potential, with monthly revenues capable of climbing to $1,666, occupancy reaching a high of 68.9%, and ADRs peaking at $76.
- Conversely, the slowest single month of the year, typically falling within the low season, marks the market's lowest point. In this month, revenue might dip to $458, occupancy could drop to 27.5%, and ADRs may adjust down to $66.
- Understanding both the seasonal averages and these monthly peaks and troughs in revenue, occupancy, and ADR is crucial for maximizing your Airbnb profit potential in Saint-Jean-de-Boiseau.
Seasonal Strategies for Maximizing Profit
- Peak Season: Maximize revenue through premium pricing and potentially longer minimum stays. Ensure high availability.
- Low Season: Offer competitive pricing, special promotions (e.g., extended stay discounts), and flexible cancellation policies. Target off-season travelers like remote workers or budget-conscious guests.
- Shoulder Seasons: Implement dynamic pricing that balances peak and low rates. Target weekend travelers or specific events. Offer slightly more flexible terms than peak season.
- Regularly analyze your own performance against these Saint-Jean-de-Boiseau seasonality benchmarks and adjust your pricing and availability strategy accordingly.
Best Areas for Airbnb Investment in Saint-Jean-de-Boiseau (2025)
Exploring the top neighborhoods for short-term rentals in Saint-Jean-de-Boiseau? This section highlights key areas, outlining why they are attractive for hosts and guests, along with notable local attractions. Consider these locations based on your target guest profile and investment strategy.
| Neighborhood / Area | Why Host Here? (Target Guests & Appeal) | Key Attractions & Landmarks |
|---|---|---|
| Centre-City | The central part of Saint-Jean-de-Boiseau offers easy access to local shops, restaurants, and public transport. Ideal for tourists wanting to experience the local culture and amenities. | Les Halles de Saint-Jean-de-Boiseau, Saint-Jean-de-Boiseau Church, Local markets, Cafés and bistros |
| Lac de Grand-Lieu | A beautiful natural area perfect for outdoor enthusiasts. This location offers activities such as hiking, bird watching, and enjoying nature, making it attractive for eco-tourism. | Grand-Lieu Lake, Hiking trails, Bird watching sites, Picnic areas |
| Île de Nantes | Just a short drive away, this area is known for its innovative art and cultural scene. Perfect for visitors wanting a mix of nature and vibrant city life. | Les Machines de l'île, Nantes Museum of Arts, Nantes Botanical Garden, Quai des Antilles |
| Parc de la Beaujoire | This green space offers great venues for sports and events. It's appealing for families and travelers looking for relaxation and activities in nature. | Beaujoire Stadium, Parks and gardens, Walking and cycling paths, Events and festivals |
| Château de Clisson | A historic town nearby with a stunning castle. Great for those interested in history and architecture, attracting day-trippers and history buffs. | Clisson Castle, Historic town center, Wine tasting, Local festivals |
| Sèvre Riverbanks | Scenic riverside location that attracts tourists for boating and picnics. Great for those wanting a peaceful getaway near the water. | Sèvre River, Boating opportunities, Walking trails, Nature reserves |
| Nantes City Center | A larger nearby city with a vibrant urban atmosphere, shopping, dining, and entertainment options. Very appealing to a wide range of travelers. | Château des Ducs de Bretagne, Les Machines de l'île, Shopping streets, Cultural events and exhibitions |
| Brière Regional Nature Park | A unique wetland area known for its biodiversity and beauty. This location is popular for eco-tourists and those seeking outdoor adventure. | Brière marshes, Boat tours, Wildlife observation, Hiking paths |
Understanding Airbnb License Requirements & STR Laws in Saint-Jean-de-Boiseau (2025)
While Saint-Jean-de-Boiseau, Pays de la Loire, France currently shows low STR regulations, specific Airbnb license requirements might still exist or change. Always verify the latest short term rental regulations and Airbnb license requirements directly with local government authorities for Saint-Jean-de-Boiseau to ensure full compliance before hosting.
(Source: AirROI data, 2025, based on 4% licensed listings)
Top Performing Airbnb Properties in Saint-Jean-de-Boiseau (2025)
Benchmark your potential! Explore examples of top-performing Airbnb properties in Saint-Jean-de-Boiseaubased on Trailing Twelve Month (TTM) revenue. Analyze their characteristics, revenue, occupancy rate, and ADR to understand what drives success in this market.
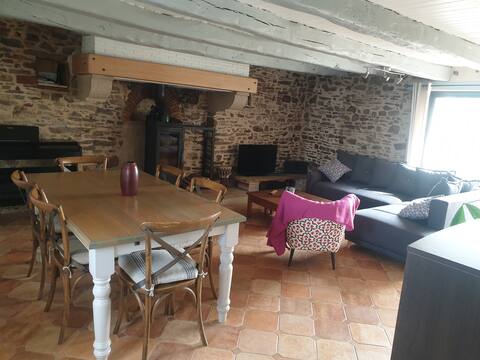
Warm house between City, Countryside and Sea
Entire Place • 4 bedrooms
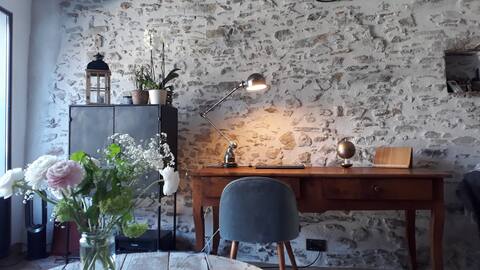
"Bed and Books" cottage on the Loire à Vélo route
Entire Place • 2 bedrooms
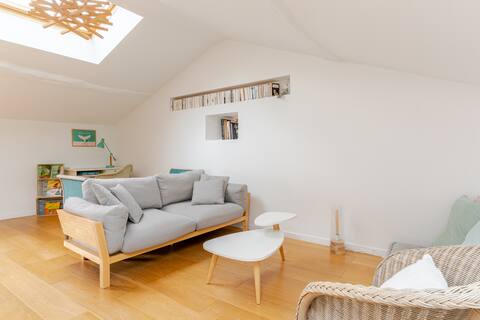
LOFT COCOONING 77m2
Entire Place • 2 bedrooms
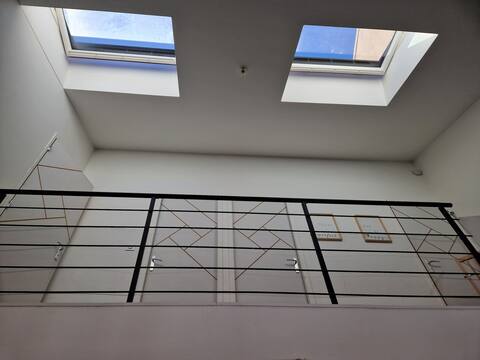
"La maison verte" in Saint-Jean-de-Boiseau
Entire Place • 2 bedrooms

Gîte de la vallée
Entire Place • 1 bedroom
Le Pressoir - Quiet and sunny cottage.
Entire Place • 1 bedroom
Note: Performance varies based on location, size, amenities, seasonality, and management quality. Data reflects the past 12 months.
Top Performing Airbnb Hosts in Saint-Jean-de-Boiseau (2025)
Learn from the best! This table showcases top-performing Airbnb hosts in Saint-Jean-de-Boiseau based on the number of properties managed and estimated total revenue over the past year. Analyze their scale and performance metrics.
| Host Name | Properties | Grossing Revenue | Stay Reviews | Avg Rating |
|---|---|---|---|---|
| Stéphane | 1 | $20,714 | 9 | 4.78/5.0 |
| Alexandrine | 1 | $19,239 | 185 | 4.98/5.0 |
| Hervé | 2 | $17,129 | 18 | 2.39/5.0 |
| Host #61999776 | 1 | $13,327 | 121 | 4.81/5.0 |
| Alexandra | 1 | $12,679 | 33 | 4.70/5.0 |
| Luc Et Muriel | 1 | $11,114 | 299 | 4.91/5.0 |
| Claire | 1 | $10,177 | 16 | 5.00/5.0 |
| Jacqueline | 1 | $9,307 | 327 | 4.76/5.0 |
| Host #405571306 | 1 | $9,135 | 176 | 4.81/5.0 |
| Solenne | 1 | $8,891 | 9 | 4.78/5.0 |
Analyzing the strategies of top hosts, such as their property selection, pricing, and guest communication, can offer valuable lessons for optimizing your own Airbnb operations in Saint-Jean-de-Boiseau.
Dive Deeper: Advanced Saint-Jean-de-Boiseau STR Market Data (2025)
Ready to unlock more insights? AirROI provides access to advanced metrics and comprehensive Airbnb data for Saint-Jean-de-Boiseau. Explore detailed analytics beyond this report to refine your investment strategy, optimize pricing, and maximize your vacation rental profits.
Explore Advanced MetricsSaint-Jean-de-Boiseau Short-Term Rental Market Composition (2025): Property & Room Types
Room Type Distribution
Property Type Distribution
Market Composition Insights for Saint-Jean-de-Boiseau
- The Saint-Jean-de-Boiseau Airbnb market composition is heavily skewed towards Entire Home/Apt listings, which make up 78.3% of the 23 active rentals. This indicates strong guest preference for privacy and space.
- Looking at the property type distribution in Saint-Jean-de-Boiseau, House properties are the most common (52.2%), reflecting the local real estate landscape.
- Houses represent a significant 52.2% portion, catering likely to families or larger groups.
- The presence of 26.1% Hotel/Boutique listings indicates integration with traditional hospitality.
Saint-Jean-de-Boiseau Airbnb Room Capacity Analysis (2025): Bedroom Distribution
Distribution of Listings by Number of Bedrooms
Room Capacity Insights for Saint-Jean-de-Boiseau
- The dominant room capacity in Saint-Jean-de-Boiseau is 1 bedroom listings, making up 47.8% of the market. This suggests a strong demand for properties suitable for couples or solo travelers.
- Together, 1 bedroom and 2 bedrooms properties represent 65.2% of the active Airbnb listings in Saint-Jean-de-Boiseau, indicating a high concentration in these sizes.
Saint-Jean-de-Boiseau Vacation Rental Guest Capacity Trends (2025)
Distribution of Listings by Guest Capacity
Guest Capacity Insights for Saint-Jean-de-Boiseau
- The most common guest capacity trend in Saint-Jean-de-Boiseau vacation rentals is listings accommodating 2 guests (34.8%). This suggests the primary traveler segment is likely couples or solo travelers.
- Properties designed for 2 guests and 3 guests dominate the Saint-Jean-de-Boiseau STR market, accounting for 47.8% of listings.
- 17.3% of properties accommodate 6+ guests, serving the market segment for larger families or group travel in Saint-Jean-de-Boiseau.
- On average, properties in Saint-Jean-de-Boiseau are equipped to host 2.9 guests.
Saint-Jean-de-Boiseau Airbnb Booking Patterns (2025): Available vs. Booked Days
Available Days Distribution
Booked Days Distribution
Booking Pattern Insights for Saint-Jean-de-Boiseau
- The most common availability pattern in Saint-Jean-de-Boiseau falls within the 271-366 days range, representing 43.5% of listings. This suggests many properties have significant open periods on their calendars.
- Approximately 69.6% of listings show high availability (181+ days open annually), indicating potential for increased bookings or specific owner usage patterns.
- For booked days, the 31-90 days range is most frequent in Saint-Jean-de-Boiseau (34.8%), reflecting common guest stay durations or potential owner blocking patterns.
- A notable 30.4% of properties secure long booking periods (181+ days booked per year), highlighting successful long-term rental strategies or significant owner usage.
Saint-Jean-de-Boiseau Airbnb Minimum Stay Requirements Analysis
Distribution of Listings by Minimum Night Requirement
1 Night
5 listings
26.3% of total
2 Nights
10 listings
52.6% of total
3 Nights
2 listings
10.5% of total
4-6 Nights
1 listings
5.3% of total
30+ Nights
1 listings
5.3% of total
Key Insights
- The most prevalent minimum stay requirement in Saint-Jean-de-Boiseau is 2 Nights, adopted by 52.6% of listings. This highlights the market's preference for shorter, flexible bookings.
- A strong majority (78.9%) of the Saint-Jean-de-Boiseau Airbnb data shows acceptance of very short stays (1-2 nights), indicating a dynamic, high-turnover market.
Recommendations
- Align with the market by considering a 2 Nights minimum stay, as 52.6% of Saint-Jean-de-Boiseau hosts use this setting.
- If feasible, allowing 1-night stays, especially midweek or during low season, could capture last-minute bookings, as only 26.3% currently do.
- Explore offering discounts for stays of 30+ nights to attract the 5.3% of the market seeking extended stays.
- Adjust minimum nights based on seasonality – potentially shorter during low season and longer during peak demand periods in Saint-Jean-de-Boiseau.
Saint-Jean-de-Boiseau Airbnb Cancellation Policy Trends Analysis (2025)
Flexible
9 listings
45% of total
Moderate
10 listings
50% of total
Firm
1 listings
5% of total
Cancellation Policy Insights for Saint-Jean-de-Boiseau
- The prevailing Airbnb cancellation policy trend in Saint-Jean-de-Boiseau is Moderate, used by 50% of listings.
- The market strongly favors guest-friendly terms, with 95.0% of listings offering Flexible or Moderate policies. This suggests guests in Saint-Jean-de-Boiseau may expect booking flexibility.
Recommendations for Hosts
- Consider adopting a Moderate policy to align with the 50% market standard in Saint-Jean-de-Boiseau.
- Regularly review your cancellation policy against competitors and market demand shifts in Saint-Jean-de-Boiseau.
Saint-Jean-de-Boiseau STR Booking Lead Time Analysis (2025)
Average Booking Lead Time by Month
Booking Lead Time Insights for Saint-Jean-de-Boiseau
- The overall average booking lead time for vacation rentals in Saint-Jean-de-Boiseau is 51 days.
- Guests book furthest in advance for stays during June (average 72 days), likely coinciding with peak travel demand or local events.
- The shortest booking windows occur for stays in November (average 12 days), indicating more last-minute travel plans during this time.
- Seasonally, Summer (63 days avg.) sees the longest lead times, while Winter (33 days avg.) has the shortest, reflecting typical travel planning cycles.
Recommendations for Hosts
- Use the overall average lead time (51 days) as a baseline for your pricing and availability strategy in Saint-Jean-de-Boiseau.
- For June stays, consider implementing length-of-stay discounts or slightly higher rates for bookings made less than 72 days out to capitalize on advance planning.
- During November, focus on last-minute booking availability and promotions, as guests book with very short notice (12 days avg.).
- Target marketing efforts for the Summer season well in advance (at least 63 days) to capture early planners.
- Monitor your own booking lead times against these Saint-Jean-de-Boiseau averages to identify opportunities for dynamic pricing adjustments.
Popular & Essential Airbnb Amenities in Saint-Jean-de-Boiseau (2025)
Amenity Prevalence
Amenity Insights for Saint-Jean-de-Boiseau
- Essential amenities in Saint-Jean-de-Boiseau that guests expect include: Hot water, Heating. Lacking these (any) could significantly impact bookings.
- Popular amenities like Smoke alarm, Wifi, Kitchen are common but not universal. Offering these can provide a competitive edge.
- Warning: Wifi is not universally provided but is considered essential globally. Ensure reliable Wifi is offered.
Recommendations for Hosts
- Ensure your listing includes all essential amenities for Saint-Jean-de-Boiseau: Hot water, Heating.
- Prioritize adding missing essentials: Heating.
- Consider adding popular differentiators like Smoke alarm or Wifi to increase appeal.
- Highlight unique or less common amenities you offer (e.g., hot tub, dedicated workspace, EV charger) in your listing description and photos.
- Regularly check competitor amenities in Saint-Jean-de-Boiseau to stay competitive.
Saint-Jean-de-Boiseau Airbnb Guest Demographics & Profile Analysis (2025)
Guest Profile Summary for Saint-Jean-de-Boiseau
- The typical guest profile for Airbnb in Saint-Jean-de-Boiseau consists of primarily domestic travelers (88%), often arriving from nearby Paris, typically belonging to the Post-2000s (Gen Z/Alpha) group (50%), primarily speaking French or English.
- Domestic travelers account for 88.1% of guests.
- Key international markets include France (88.1%) and Belgium (4.3%).
- Top languages spoken are French (49.7%) followed by English (31.6%).
- A significant demographic segment is the Post-2000s (Gen Z/Alpha) group, representing 50% of guests.
Recommendations for Hosts
- Target domestic marketing efforts towards travelers from Paris and Nantes.
- Tailor amenities and listing descriptions to appeal to the dominant Post-2000s (Gen Z/Alpha) demographic (e.g., highlight fast WiFi, smart home features, local guides).
- Highlight unique local experiences or amenities relevant to the primary guest profile.
- Consider seasonal promotions aligned with peak travel times for key origin markets.
Nearby Short-Term Rental Market Comparison
How does the Saint-Jean-de-Boiseau Airbnb market stack up against its neighbors? Compare key performance metrics like average monthly revenue, ADR, and occupancy rates in surrounding areas to understand the broader regional STR landscape.
| Market | Active Properties | Monthly Revenue | Daily Rate | Avg. Occupancy |
|---|---|---|---|---|
| Moulins-le-Carbonnel | 11 | $3,213 | $320.85 | 35% |
| Vallon-sur-Gée | 11 | $2,913 | $379.01 | 30% |
| Bourneau | 11 | $2,747 | $442.07 | 35% |
| Nuaillé-d'Aunis | 10 | $2,741 | $373.83 | 37% |
| Le Bois-Plage-en-Ré | 303 | $2,528 | $284.63 | 45% |
| Chambellay | 11 | $2,525 | $255.24 | 34% |
| Sainte-Florence | 10 | $2,445 | $233.78 | 46% |
| La Flotte | 396 | $2,382 | $236.53 | 46% |
| Forges | 11 | $2,314 | $220.63 | 39% |
| Dœuil-sur-le-Mignon | 12 | $2,283 | $481.91 | 21% |