Saint-Herblain Airbnb Market Analysis 2025: Short Term Rental Data & Vacation Rental Statistics in Pays de la Loire, France
Is Airbnb profitable in Saint-Herblain in 2025? Explore comprehensive Airbnb analytics for Saint-Herblain, Pays de la Loire, France to uncover income potential. This 2025 STR market report for Saint-Herblain, based on AirROI data from April 2024 to March 2025, reveals key trends in the niche market of 156 active listings.
Whether you're considering an Airbnb investment in Saint-Herblain, optimizing your existing vacation rental, or exploring rental arbitrage opportunities, understanding the Saint-Herblain Airbnb data is crucial. Understanding the local regulations is key to maximizing your short term rental income potential. Let's dive into the specifics.
Key Saint-Herblain Airbnb Performance Metrics Overview
Monthly Airbnb Revenue Variations & Income Potential in Saint-Herblain (2025)
Understanding the monthly revenue variations for Airbnb listings in Saint-Herblain is key to maximizing your short term rental income potential. Seasonality significantly impacts earnings. Our analysis, based on data from the past 12 months, shows that the peak revenue month for STRs in Saint-Herblain is typically May, while March often presents the lowest earnings, highlighting opportunities for strategic pricing adjustments during shoulder and low seasons. Explore the typical Airbnb income in Saint-Herblain across different performance tiers:
- Best-in-class properties (Top 10%) achieve $2,535+ monthly, often utilizing dynamic pricing and superior guest experiences.
- Strong performing properties (Top 25%) earn $1,479 or more, indicating effective management and desirable locations/amenities.
- Typical properties (Median) generate around $901 per month, representing the average market performance.
- Entry-level properties (Bottom 25%) see earnings around $440, often with potential for optimization.
Average Monthly Airbnb Earnings Trend in Saint-Herblain
Saint-Herblain Airbnb Occupancy Rate Trends (2025)
Maximize your bookings by understanding the Saint-Herblain STR occupancy trends. Seasonal demand shifts significantly influence how often properties are booked. Typically, Decembersees the highest demand (peak season occupancy), while March experiences the lowest (low season). Effective strategies, like adjusting minimum stays or offering promotions, can boost occupancy during slower periods. Here's how different property tiers perform in Saint-Herblain:
- Best-in-class properties (Top 10%) achieve 85%+ occupancy, indicating high desirability and potentially optimized availability.
- Strong performing properties (Top 25%) maintain 67% or higher occupancy, suggesting good market fit and guest satisfaction.
- Typical properties (Median) have an occupancy rate around 46%.
- Entry-level properties (Bottom 25%) average 24% occupancy, potentially facing higher vacancy.
Average Monthly Occupancy Rate Trend in Saint-Herblain
Average Daily Rate (ADR) Airbnb Trends in Saint-Herblain (2025)
Effective short term rental pricing strategy in Saint-Herblain involves understanding monthly ADR fluctuations. The Average Daily Rate (ADR) for Airbnb in Saint-Herblain typically peaks in November and dips lowest during April. Leveraging Airbnb dynamic pricing tools or strategies based on this seasonality can significantly boost revenue. Here's a look at the typical nightly rates achieved:
- Best-in-class properties (Top 10%) command rates of $152+ per night, often due to premium features or locations.
- Strong performing properties (Top 25%) achieve nightly rates of $96 or more.
- Typical properties (Median) charge around $61 per night.
- Entry-level properties (Bottom 25%) earn around $39 per night.
Average Daily Rate (ADR) Trend by Month in Saint-Herblain
Get Live Saint-Herblain Market Intelligence 👇

Explore Real-time Analytics
Airbnb Seasonality Analysis & Trends in Saint-Herblain (2025)
Peak Season (May, June, April)
- Revenue averages $1,529 per month
- Occupancy rates average 47.8%
- Daily rates average $77
Shoulder Season
- Revenue averages $1,167 per month
- Occupancy maintains around 47.7%
- Daily rates hold near $78
Low Season (February, March, November)
- Revenue drops to average $899 per month
- Occupancy decreases to average 43.4%
- Daily rates adjust to average $80
Seasonality Insights for Saint-Herblain
- The Airbnb seasonality in Saint-Herblain shows highly seasonal trends requiring careful strategy. While the sections above show seasonal averages, it's also insightful to look at the extremes:
- During the high season, the absolute peak month showcases Saint-Herblain's highest earning potential, with monthly revenues capable of climbing to $1,635, occupancy reaching a high of 52.3%, and ADRs peaking at $83.
- Conversely, the slowest single month of the year, typically falling within the low season, marks the market's lowest point. In this month, revenue might dip to $801, occupancy could drop to 37.9%, and ADRs may adjust down to $76.
- Understanding both the seasonal averages and these monthly peaks and troughs in revenue, occupancy, and ADR is crucial for maximizing your Airbnb profit potential in Saint-Herblain.
Seasonal Strategies for Maximizing Profit
- Peak Season: Maximize revenue through premium pricing and potentially longer minimum stays. Ensure high availability.
- Low Season: Offer competitive pricing, special promotions (e.g., extended stay discounts), and flexible cancellation policies. Target off-season travelers like remote workers or budget-conscious guests.
- Shoulder Seasons: Implement dynamic pricing that balances peak and low rates. Target weekend travelers or specific events. Offer slightly more flexible terms than peak season.
- Regularly analyze your own performance against these Saint-Herblain seasonality benchmarks and adjust your pricing and availability strategy accordingly.
Best Areas for Airbnb Investment in Saint-Herblain (2025)
Exploring the top neighborhoods for short-term rentals in Saint-Herblain? This section highlights key areas, outlining why they are attractive for hosts and guests, along with notable local attractions. Consider these locations based on your target guest profile and investment strategy.
| Neighborhood / Area | Why Host Here? (Target Guests & Appeal) | Key Attractions & Landmarks |
|---|---|---|
| Grand Parc | A family-friendly neighborhood known for its spacious parks and green spaces. Ideal for families and visitors who enjoy outdoor activities and tranquility while being close to the city center. | Parc de la Béré, Parc de la Morlière, Cité des Congrès, Château des ducs de Bretagne, Les Machines de l'île |
| Centre-ville | The vibrant city center with a mix of shops, restaurants, and cultural attractions. Perfect for tourists who want to experience the urban lifestyle and easy access to local attractions. | Place de l'Hôtel de Ville, Les Halles de Nantes, Île de Nantes, Musée d'arts de Nantes, Cathédrale Saint-Pierre et Saint-Paul |
| La Zola | A residential area that offers a local experience with easy access to public transport. Suitable for guests looking for more authentic interactions and a taste of local life. | Parc de la Chantrerie, Local markets, Nearby cafes, Walking trails |
| Atlantis | A modern neighborhood with numerous amenities and proximity to shopping centers. Ideal for visitors appreciating comfort and convenience during their stay. | Atlantis shopping mall, Cinemas, Restaurants, Cultural center |
| Pirmil | A peaceful suburban area with a laid-back atmosphere. Attracts guests looking for a quiet retreat while being a short distance from Nantes' attractions. | Lac de la Jonelière, Nature parks, Cycling paths |
| St. Herblain Centre | The central area of Saint-Herblain offering a mix of residential spaces, boutiques, and cultural spots. Great for guests wanting to be in the heart of the action. | Espace Culturel Léo Lagrange, Shopping centers, Public transport access |
| Les Hauts Pavés | A quaint neighborhood that showcases historic architecture and a charming ambiance. Attracts guests interested in history and architecture. | Historic buildings, Art galleries, Unique shops |
| Grands Champs | A developing area with good investment potential due to ongoing urban development. Suitable for guests seeking modern accommodations and amenities. | New shopping facilities, Developing parks, Transport links |
Understanding Airbnb License Requirements & STR Laws in Saint-Herblain (2025)
With 10% of listings showing registration in 2025, understanding potential Airbnb license requirements is crucial in Saint-Herblain. Always verify the latest short term rental regulations and Airbnb license requirements directly with local government authorities for Saint-Herblain to ensure full compliance before hosting.
(Source: AirROI data, 2025, based on 10% licensed listings)
Top Performing Airbnb Properties in Saint-Herblain (2025)
Benchmark your potential! Explore examples of top-performing Airbnb properties in Saint-Herblainbased on Trailing Twelve Month (TTM) revenue. Analyze their characteristics, revenue, occupancy rate, and ADR to understand what drives success in this market.
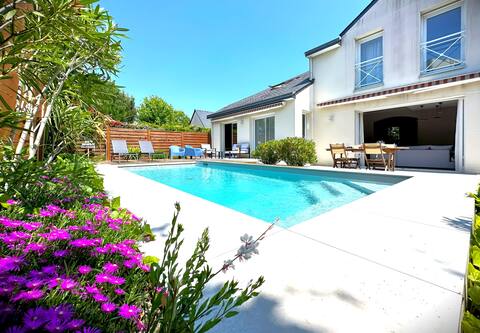
La Céleste-Villa standing with pool and garden
Entire Place • 4 bedrooms
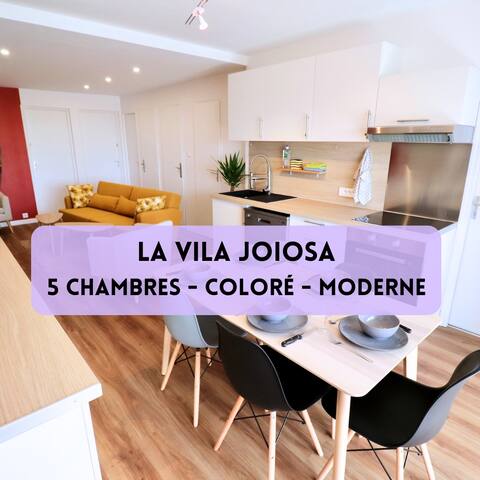
La Vila Joiosa
Entire Place • 5 bedrooms
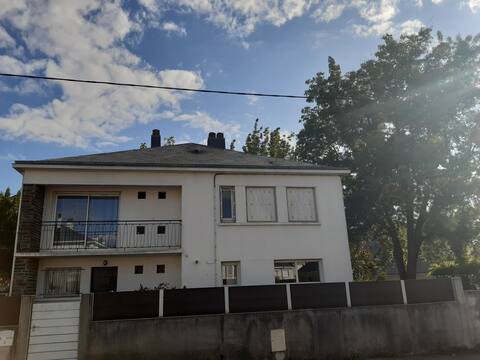
Pleasant house 12p prox. Nantes
Entire Place • 5 bedrooms
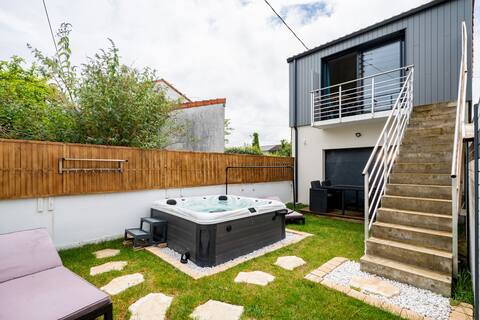
cozy house with garden and private jacuzzi
Entire Place • 1 bedroom

Spacious Apartment/All Comfort 6P
Entire Place • 3 bedrooms

Manoir de L'Aisnerie: Le Racine
Entire Place • 2 bedrooms
Note: Performance varies based on location, size, amenities, seasonality, and management quality. Data reflects the past 12 months.
Top Performing Airbnb Hosts in Saint-Herblain (2025)
Learn from the best! This table showcases top-performing Airbnb hosts in Saint-Herblain based on the number of properties managed and estimated total revenue over the past year. Analyze their scale and performance metrics.
| Host Name | Properties | Grossing Revenue | Stay Reviews | Avg Rating |
|---|---|---|---|---|
| Didier | 7 | $142,219 | 665 | 4.60/5.0 |
| CERISE Nantes Atlantis | 11 | $95,782 | 952 | 4.40/5.0 |
| Westone | 1 | $75,252 | 12 | 4.83/5.0 |
| Augustin | 7 | $73,715 | 178 | 4.43/5.0 |
| La Conciergerie Parfaite | 1 | $60,452 | 55 | 4.56/5.0 |
| Louis | 3 | $50,107 | 101 | 3.27/5.0 |
| Audrey | 1 | $35,386 | 49 | 4.98/5.0 |
| Philippe | 2 | $32,493 | 49 | 4.82/5.0 |
| Nadia | 3 | $31,517 | 458 | 4.78/5.0 |
| Khaled | 1 | $31,399 | 95 | 4.81/5.0 |
Analyzing the strategies of top hosts, such as their property selection, pricing, and guest communication, can offer valuable lessons for optimizing your own Airbnb operations in Saint-Herblain.
Dive Deeper: Advanced Saint-Herblain STR Market Data (2025)
Ready to unlock more insights? AirROI provides access to advanced metrics and comprehensive Airbnb data for Saint-Herblain. Explore detailed analytics beyond this report to refine your investment strategy, optimize pricing, and maximize your vacation rental profits.
Explore Advanced MetricsSaint-Herblain Short-Term Rental Market Composition (2025): Property & Room Types
Room Type Distribution
Property Type Distribution
Market Composition Insights for Saint-Herblain
- The Saint-Herblain Airbnb market composition is heavily skewed towards Entire Home/Apt listings, which make up 65.4% of the 156 active rentals. This indicates strong guest preference for privacy and space.
- However, a notable 34.6% share for Private Rooms suggests opportunities for budget-conscious travelers or hosts renting out spare rooms.
- Looking at the property type distribution in Saint-Herblain, Apartment/Condo properties are the most common (50.6%), reflecting the local real estate landscape.
- Houses represent a significant 40.4% portion, catering likely to families or larger groups.
- The presence of 7.1% Hotel/Boutique listings indicates integration with traditional hospitality.
- Smaller segments like others (combined 1.9%) offer potential for unique stay experiences.
Saint-Herblain Airbnb Room Capacity Analysis (2025): Bedroom Distribution
Distribution of Listings by Number of Bedrooms
Room Capacity Insights for Saint-Herblain
- The dominant room capacity in Saint-Herblain is 1 bedroom listings, making up 36.5% of the market. This suggests a strong demand for properties suitable for couples or solo travelers.
- Together, 1 bedroom and 2 bedrooms properties represent 50.6% of the active Airbnb listings in Saint-Herblain, indicating a high concentration in these sizes.
Saint-Herblain Vacation Rental Guest Capacity Trends (2025)
Distribution of Listings by Guest Capacity
Guest Capacity Insights for Saint-Herblain
- The most common guest capacity trend in Saint-Herblain vacation rentals is listings accommodating 2 guests (23.7%). This suggests the primary traveler segment is likely couples or solo travelers.
- Properties designed for 2 guests and 4 guests dominate the Saint-Herblain STR market, accounting for 39.1% of listings.
- 20.6% of properties accommodate 6+ guests, serving the market segment for larger families or group travel in Saint-Herblain.
- On average, properties in Saint-Herblain are equipped to host 2.9 guests.
Saint-Herblain Airbnb Booking Patterns (2025): Available vs. Booked Days
Available Days Distribution
Booked Days Distribution
Booking Pattern Insights for Saint-Herblain
- The most common availability pattern in Saint-Herblain falls within the 271-366 days range, representing 39.1% of listings. This suggests many properties have significant open periods on their calendars.
- Approximately 69.2% of listings show high availability (181+ days open annually), indicating potential for increased bookings or specific owner usage patterns.
- For booked days, the 91-180 days range is most frequent in Saint-Herblain (29.5%), reflecting common guest stay durations or potential owner blocking patterns.
- A notable 33.9% of properties secure long booking periods (181+ days booked per year), highlighting successful long-term rental strategies or significant owner usage.
Saint-Herblain Airbnb Minimum Stay Requirements Analysis
Distribution of Listings by Minimum Night Requirement
1 Night
63 listings
43.2% of total
2 Nights
46 listings
31.5% of total
3 Nights
12 listings
8.2% of total
4-6 Nights
15 listings
10.3% of total
7-29 Nights
2 listings
1.4% of total
30+ Nights
8 listings
5.5% of total
Key Insights
- The most prevalent minimum stay requirement in Saint-Herblain is 1 Night, adopted by 43.2% of listings. This highlights the market's preference for shorter, flexible bookings.
- A strong majority (74.7%) of the Saint-Herblain Airbnb data shows acceptance of very short stays (1-2 nights), indicating a dynamic, high-turnover market.
Recommendations
- Align with the market by considering a 1 Night minimum stay, as 43.2% of Saint-Herblain hosts use this setting.
- Explore offering discounts for stays of 30+ nights to attract the 5.5% of the market seeking extended stays.
- Adjust minimum nights based on seasonality – potentially shorter during low season and longer during peak demand periods in Saint-Herblain.
Saint-Herblain Airbnb Cancellation Policy Trends Analysis (2025)
Flexible
55 listings
40.7% of total
Moderate
41 listings
30.4% of total
Firm
17 listings
12.6% of total
Strict
22 listings
16.3% of total
Cancellation Policy Insights for Saint-Herblain
- The prevailing Airbnb cancellation policy trend in Saint-Herblain is Flexible, used by 40.7% of listings.
- The market strongly favors guest-friendly terms, with 71.1% of listings offering Flexible or Moderate policies. This suggests guests in Saint-Herblain may expect booking flexibility.
Recommendations for Hosts
- Consider adopting a Flexible policy to align with the 40.7% market standard in Saint-Herblain.
- Regularly review your cancellation policy against competitors and market demand shifts in Saint-Herblain.
Saint-Herblain STR Booking Lead Time Analysis (2025)
Average Booking Lead Time by Month
Booking Lead Time Insights for Saint-Herblain
- The overall average booking lead time for vacation rentals in Saint-Herblain is 46 days.
- Guests book furthest in advance for stays during June (average 75 days), likely coinciding with peak travel demand or local events.
- The shortest booking windows occur for stays in October (average 33 days), indicating more last-minute travel plans during this time.
- Seasonally, Summer (61 days avg.) sees the longest lead times, while Winter (38 days avg.) has the shortest, reflecting typical travel planning cycles.
Recommendations for Hosts
- Use the overall average lead time (46 days) as a baseline for your pricing and availability strategy in Saint-Herblain.
- For June stays, consider implementing length-of-stay discounts or slightly higher rates for bookings made less than 75 days out to capitalize on advance planning.
- Target marketing efforts for the Summer season well in advance (at least 61 days) to capture early planners.
- Monitor your own booking lead times against these Saint-Herblain averages to identify opportunities for dynamic pricing adjustments.
Popular & Essential Airbnb Amenities in Saint-Herblain (2025)
Amenity Prevalence
Amenity Insights for Saint-Herblain
- Popular amenities like Heating, Smoke alarm, Wifi are common but not universal. Offering these can provide a competitive edge.
- Warning: Wifi is not universally provided but is considered essential globally. Ensure reliable Wifi is offered.
Recommendations for Hosts
- Consider adding popular differentiators like Heating or Smoke alarm to increase appeal.
- Highlight unique or less common amenities you offer (e.g., hot tub, dedicated workspace, EV charger) in your listing description and photos.
- Regularly check competitor amenities in Saint-Herblain to stay competitive.
Saint-Herblain Airbnb Guest Demographics & Profile Analysis (2025)
Guest Profile Summary for Saint-Herblain
- The typical guest profile for Airbnb in Saint-Herblain consists of primarily domestic travelers (93%), often arriving from nearby Nantes, typically belonging to the Post-2000s (Gen Z/Alpha) group (50%), primarily speaking French or English.
- Domestic travelers account for 92.5% of guests.
- Key international markets include France (92.5%) and Spain (1%).
- Top languages spoken are French (50%) followed by English (29.5%).
- A significant demographic segment is the Post-2000s (Gen Z/Alpha) group, representing 50% of guests.
Recommendations for Hosts
- Target domestic marketing efforts towards travelers from Nantes and Paris.
- Tailor amenities and listing descriptions to appeal to the dominant Post-2000s (Gen Z/Alpha) demographic (e.g., highlight fast WiFi, smart home features, local guides).
- Highlight unique local experiences or amenities relevant to the primary guest profile.
- Consider seasonal promotions aligned with peak travel times for key origin markets.
Nearby Short-Term Rental Market Comparison
How does the Saint-Herblain Airbnb market stack up against its neighbors? Compare key performance metrics like average monthly revenue, ADR, and occupancy rates in surrounding areas to understand the broader regional STR landscape.
| Market | Active Properties | Monthly Revenue | Daily Rate | Avg. Occupancy |
|---|---|---|---|---|
| Moulins-le-Carbonnel | 11 | $3,213 | $320.85 | 35% |
| Vallon-sur-Gée | 11 | $2,913 | $379.01 | 30% |
| Bourneau | 11 | $2,747 | $442.07 | 35% |
| Nuaillé-d'Aunis | 10 | $2,741 | $373.83 | 37% |
| Le Bois-Plage-en-Ré | 303 | $2,528 | $284.63 | 45% |
| Chambellay | 11 | $2,525 | $255.24 | 34% |
| Sainte-Florence | 10 | $2,445 | $233.78 | 46% |
| La Flotte | 396 | $2,382 | $236.53 | 46% |
| Forges | 11 | $2,314 | $220.63 | 39% |
| Dœuil-sur-le-Mignon | 12 | $2,283 | $481.91 | 21% |