Saint-Georges-de-Pointindoux Airbnb Market Analysis 2025: Short Term Rental Data & Vacation Rental Statistics in Pays de la Loire, France
Is Airbnb profitable in Saint-Georges-de-Pointindoux in 2025? Explore comprehensive Airbnb analytics for Saint-Georges-de-Pointindoux, Pays de la Loire, France to uncover income potential. This 2025 STR market report for Saint-Georges-de-Pointindoux, based on AirROI data from April 2024 to March 2025, reveals key trends in the niche market of 17 active listings.
Whether you're considering an Airbnb investment in Saint-Georges-de-Pointindoux, optimizing your existing vacation rental, or exploring rental arbitrage opportunities, understanding the Saint-Georges-de-Pointindoux Airbnb data is crucial. Leveraging the low regulation environment is key to maximizing your short term rental income potential. Let's dive into the specifics.
Key Saint-Georges-de-Pointindoux Airbnb Performance Metrics Overview
Monthly Airbnb Revenue Variations & Income Potential in Saint-Georges-de-Pointindoux (2025)
Understanding the monthly revenue variations for Airbnb listings in Saint-Georges-de-Pointindoux is key to maximizing your short term rental income potential. Seasonality significantly impacts earnings. Our analysis, based on data from the past 12 months, shows that the peak revenue month for STRs in Saint-Georges-de-Pointindoux is typically August, while January often presents the lowest earnings, highlighting opportunities for strategic pricing adjustments during shoulder and low seasons. Explore the typical Airbnb income in Saint-Georges-de-Pointindoux across different performance tiers:
- Best-in-class properties (Top 10%) achieve $5,000+ monthly, often utilizing dynamic pricing and superior guest experiences.
- Strong performing properties (Top 25%) earn $2,425 or more, indicating effective management and desirable locations/amenities.
- Typical properties (Median) generate around $1,200 per month, representing the average market performance.
- Entry-level properties (Bottom 25%) see earnings around $660, often with potential for optimization.
Average Monthly Airbnb Earnings Trend in Saint-Georges-de-Pointindoux
Saint-Georges-de-Pointindoux Airbnb Occupancy Rate Trends (2025)
Maximize your bookings by understanding the Saint-Georges-de-Pointindoux STR occupancy trends. Seasonal demand shifts significantly influence how often properties are booked. Typically, Augustsees the highest demand (peak season occupancy), while March experiences the lowest (low season). Effective strategies, like adjusting minimum stays or offering promotions, can boost occupancy during slower periods. Here's how different property tiers perform in Saint-Georges-de-Pointindoux:
- Best-in-class properties (Top 10%) achieve 70%+ occupancy, indicating high desirability and potentially optimized availability.
- Strong performing properties (Top 25%) maintain 52% or higher occupancy, suggesting good market fit and guest satisfaction.
- Typical properties (Median) have an occupancy rate around 35%.
- Entry-level properties (Bottom 25%) average 18% occupancy, potentially facing higher vacancy.
Average Monthly Occupancy Rate Trend in Saint-Georges-de-Pointindoux
Average Daily Rate (ADR) Airbnb Trends in Saint-Georges-de-Pointindoux (2025)
Effective short term rental pricing strategy in Saint-Georges-de-Pointindoux involves understanding monthly ADR fluctuations. The Average Daily Rate (ADR) for Airbnb in Saint-Georges-de-Pointindoux typically peaks in November and dips lowest during April. Leveraging Airbnb dynamic pricing tools or strategies based on this seasonality can significantly boost revenue. Here's a look at the typical nightly rates achieved:
- Best-in-class properties (Top 10%) command rates of $329+ per night, often due to premium features or locations.
- Strong performing properties (Top 25%) achieve nightly rates of $195 or more.
- Typical properties (Median) charge around $96 per night.
- Entry-level properties (Bottom 25%) earn around $64 per night.
Average Daily Rate (ADR) Trend by Month in Saint-Georges-de-Pointindoux
Get Live Saint-Georges-de-Pointindoux Market Intelligence 👇

Explore Real-time Analytics
Airbnb Seasonality Analysis & Trends in Saint-Georges-de-Pointindoux (2025)
Peak Season (August, July, September)
- Revenue averages $2,877 per month
- Occupancy rates average 55.5%
- Daily rates average $138
Shoulder Season
- Revenue averages $1,866 per month
- Occupancy maintains around 36.7%
- Daily rates hold near $143
Low Season (January, February, March)
- Revenue drops to average $1,093 per month
- Occupancy decreases to average 22.2%
- Daily rates adjust to average $161
Seasonality Insights for Saint-Georges-de-Pointindoux
- The Airbnb seasonality in Saint-Georges-de-Pointindoux shows highly seasonal trends requiring careful strategy. While the sections above show seasonal averages, it's also insightful to look at the extremes:
- During the high season, the absolute peak month showcases Saint-Georges-de-Pointindoux's highest earning potential, with monthly revenues capable of climbing to $3,188, occupancy reaching a high of 61.8%, and ADRs peaking at $167.
- Conversely, the slowest single month of the year, typically falling within the low season, marks the market's lowest point. In this month, revenue might dip to $973, occupancy could drop to 20.2%, and ADRs may adjust down to $129.
- Understanding both the seasonal averages and these monthly peaks and troughs in revenue, occupancy, and ADR is crucial for maximizing your Airbnb profit potential in Saint-Georges-de-Pointindoux.
Seasonal Strategies for Maximizing Profit
- Peak Season: Maximize revenue through premium pricing and potentially longer minimum stays. Ensure high availability.
- Low Season: Offer competitive pricing, special promotions (e.g., extended stay discounts), and flexible cancellation policies. Target off-season travelers like remote workers or budget-conscious guests.
- Shoulder Seasons: Implement dynamic pricing that balances peak and low rates. Target weekend travelers or specific events. Offer slightly more flexible terms than peak season.
- Regularly analyze your own performance against these Saint-Georges-de-Pointindoux seasonality benchmarks and adjust your pricing and availability strategy accordingly.
Best Areas for Airbnb Investment in Saint-Georges-de-Pointindoux (2025)
Exploring the top neighborhoods for short-term rentals in Saint-Georges-de-Pointindoux? This section highlights key areas, outlining why they are attractive for hosts and guests, along with notable local attractions. Consider these locations based on your target guest profile and investment strategy.
| Neighborhood / Area | Why Host Here? (Target Guests & Appeal) | Key Attractions & Landmarks |
|---|---|---|
| La Tranche-sur-Mer | Popular beach town known for its beautiful sandy beaches and family-friendly atmosphere. Ideal for attracting summer vacationers looking for sun and sea. | Plage de la Tranche-sur-Mer, Parc des Floralies, Phare de la Tranche, Les Dunes, Domaine de la Barbinière |
| Les Sables-d'Olonne | Charming coastal town famous for its sailing and beach activities. A vibrant destination for tourists of all ages with a lovely promenade. | Plage des Sables-d'Olonne, Aquarium Le Septième Continent, Promenade de l'Océan, Les Jardins de la Liberté, Parc zoologique des Sables-d'Olonne |
| Challans | Known for its rich agricultural heritage and proximity to the Vendée coastline. Offers a quieter alternative for visitors wanting to explore the region. | Eglise Saint-Jacques, Le Grand Parc du Puy du Fou, Marché de Challans |
| Saint-Jean-de-Monts | Offers extensive sandy beaches and a relaxed atmosphere, perfect for family vacations and outdoor activities such as cycling and water sports. | Plage de Saint-Jean-de-Monts, Parc des Floralies, Dunes de Saint-Jean-de-Monts |
| Noirmoutier-en-l'Île | An island renowned for its natural beauty and beaches, attracting holidaymakers looking for a scenic getaway with a unique island charm. | Plage des Dames, Château de Noirmoutier, L'Herbaudière, Marais salants |
| Saint-Hilaire-de-Riez | Known for its long sandy beaches and wooded areas, making it a great location for nature lovers and beach enthusiasts. | Plage des Cinq Pineaux, Le Puy du Fou, Sentier des Douaniers |
| L'Île-d'Yeu | A peaceful island with stunning landscapes and a relaxed pace, it attracts visitors looking to escape the hustle and bustle of mainland France. | Plage de la Petite Guitière, Phare de la Croix, Sentier des Douaniers |
| Pornic | Picturesque coastal town with a charming harbor and historic attractions. Ideal for those looking to experience the coastal culture of France. | Château de Pornic, Plage de la Noëveillard, Port de Pornic, Sentier littoral |
Understanding Airbnb License Requirements & STR Laws in Saint-Georges-de-Pointindoux (2025)
While Saint-Georges-de-Pointindoux, Pays de la Loire, France currently shows low STR regulations, specific Airbnb license requirements might still exist or change. Always verify the latest short term rental regulations and Airbnb license requirements directly with local government authorities for Saint-Georges-de-Pointindoux to ensure full compliance before hosting.
(Source: AirROI data, 2025, finding no licensed listings among those analyzed)
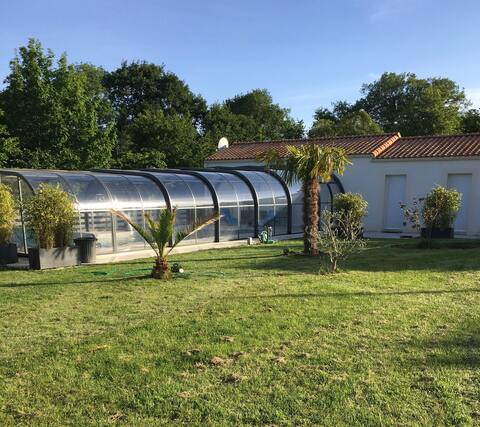
Top Performing Airbnb Properties in Saint-Georges-de-Pointindoux (2025)
Benchmark your potential! Explore examples of top-performing Airbnb properties in Saint-Georges-de-Pointindouxbased on Trailing Twelve Month (TTM) revenue. Analyze their characteristics, revenue, occupancy rate, and ADR to understand what drives success in this market.
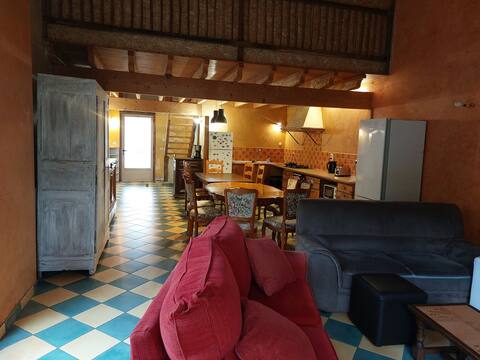
house with character
Entire Place • 10 bedrooms

Gîte pour 10,sauna et jacuzzi !
Entire Place • 4 bedrooms

Exceptional holiday home - heated pool
Entire Place • 3 bedrooms
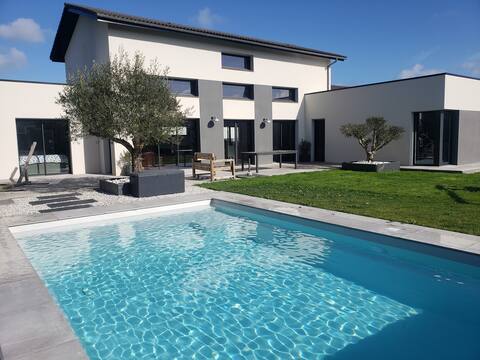
Beautiful villa with swimming pool
Entire Place • 5 bedrooms
relaxing house (6 people)
Entire Place • 2 bedrooms
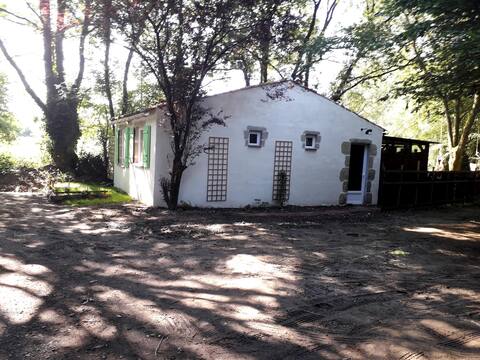
house under the trees with jacuzzi accepts dog
Entire Place • 2 bedrooms
Note: Performance varies based on location, size, amenities, seasonality, and management quality. Data reflects the past 12 months.
Top Performing Airbnb Hosts in Saint-Georges-de-Pointindoux (2025)
Learn from the best! This table showcases top-performing Airbnb hosts in Saint-Georges-de-Pointindoux based on the number of properties managed and estimated total revenue over the past year. Analyze their scale and performance metrics.
| Host Name | Properties | Grossing Revenue | Stay Reviews | Avg Rating |
|---|---|---|---|---|
| Christophe | 2 | $40,533 | 68 | 4.83/5.0 |
| Garnier | 1 | $37,584 | 3 | 4.33/5.0 |
| La GrOsse Conciergerie | 2 | $34,909 | 12 | 2.50/5.0 |
| Agnès | 1 | $28,580 | 6 | 5.00/5.0 |
| Lydie | 1 | $25,196 | 138 | 4.93/5.0 |
| Cathy | 1 | $25,043 | 168 | 4.88/5.0 |
| Wanda | 1 | $17,740 | 7 | 5.00/5.0 |
| Host #464590179 | 1 | $16,375 | 8 | 4.75/5.0 |
| Maxime | 1 | $9,184 | 63 | 4.84/5.0 |
| Céline | 1 | $7,615 | 167 | 4.64/5.0 |
Analyzing the strategies of top hosts, such as their property selection, pricing, and guest communication, can offer valuable lessons for optimizing your own Airbnb operations in Saint-Georges-de-Pointindoux.
Dive Deeper: Advanced Saint-Georges-de-Pointindoux STR Market Data (2025)
Ready to unlock more insights? AirROI provides access to advanced metrics and comprehensive Airbnb data for Saint-Georges-de-Pointindoux. Explore detailed analytics beyond this report to refine your investment strategy, optimize pricing, and maximize your vacation rental profits.
Explore Advanced MetricsSaint-Georges-de-Pointindoux Short-Term Rental Market Composition (2025): Property & Room Types
Room Type Distribution
Property Type Distribution
Market Composition Insights for Saint-Georges-de-Pointindoux
- The Saint-Georges-de-Pointindoux Airbnb market composition is heavily skewed towards Entire Home/Apt listings, which make up 100% of the 17 active rentals. This indicates strong guest preference for privacy and space.
- Looking at the property type distribution in Saint-Georges-de-Pointindoux, House properties are the most common (76.5%), reflecting the local real estate landscape.
- Houses represent a significant 76.5% portion, catering likely to families or larger groups.
- The presence of 11.8% Hotel/Boutique listings indicates integration with traditional hospitality.
Saint-Georges-de-Pointindoux Airbnb Room Capacity Analysis (2025): Bedroom Distribution
Distribution of Listings by Number of Bedrooms
Room Capacity Insights for Saint-Georges-de-Pointindoux
- The dominant room capacity in Saint-Georges-de-Pointindoux is 2 bedrooms listings, making up 41.2% of the market. This suggests a strong demand for properties suitable for couples or solo travelers.
- Together, 2 bedrooms and 3 bedrooms properties represent 64.7% of the active Airbnb listings in Saint-Georges-de-Pointindoux, indicating a high concentration in these sizes.
- A significant 47.1% of listings offer 3+ bedrooms, catering to larger groups and families seeking more space in Saint-Georges-de-Pointindoux.
Saint-Georges-de-Pointindoux Vacation Rental Guest Capacity Trends (2025)
Distribution of Listings by Guest Capacity
Guest Capacity Insights for Saint-Georges-de-Pointindoux
- The most common guest capacity trend in Saint-Georges-de-Pointindoux vacation rentals is listings accommodating 8+ guests (35.3%). This suggests the primary traveler segment is likely larger groups.
- Properties designed for 8+ guests and 4 guests dominate the Saint-Georges-de-Pointindoux STR market, accounting for 64.7% of listings.
- 47.1% of properties accommodate 6+ guests, serving the market segment for larger families or group travel in Saint-Georges-de-Pointindoux.
- On average, properties in Saint-Georges-de-Pointindoux are equipped to host 5.7 guests.
Saint-Georges-de-Pointindoux Airbnb Booking Patterns (2025): Available vs. Booked Days
Available Days Distribution
Booked Days Distribution
Booking Pattern Insights for Saint-Georges-de-Pointindoux
- The most common availability pattern in Saint-Georges-de-Pointindoux falls within the 271-366 days range, representing 47.1% of listings. This suggests many properties have significant open periods on their calendars.
- Approximately 88.3% of listings show high availability (181+ days open annually), indicating potential for increased bookings or specific owner usage patterns.
- For booked days, the 91-180 days range is most frequent in Saint-Georges-de-Pointindoux (41.2%), reflecting common guest stay durations or potential owner blocking patterns.
- A notable 11.8% of properties secure long booking periods (181+ days booked per year), highlighting successful long-term rental strategies or significant owner usage.
Saint-Georges-de-Pointindoux Airbnb Minimum Stay Requirements Analysis
Distribution of Listings by Minimum Night Requirement
1 Night
1 listings
5.9% of total
2 Nights
10 listings
58.8% of total
3 Nights
3 listings
17.6% of total
4-6 Nights
1 listings
5.9% of total
7-29 Nights
2 listings
11.8% of total
Key Insights
- The most prevalent minimum stay requirement in Saint-Georges-de-Pointindoux is 2 Nights, adopted by 58.8% of listings. This highlights the market's preference for shorter, flexible bookings.
- A strong majority (64.7%) of the Saint-Georges-de-Pointindoux Airbnb data shows acceptance of very short stays (1-2 nights), indicating a dynamic, high-turnover market.
Recommendations
- Align with the market by considering a 2 Nights minimum stay, as 58.8% of Saint-Georges-de-Pointindoux hosts use this setting.
- If feasible, allowing 1-night stays, especially midweek or during low season, could capture last-minute bookings, as only 5.9% currently do.
- A 2-night minimum appears standard (58.8%). Consider this for weekends or peak periods.
- Adjust minimum nights based on seasonality – potentially shorter during low season and longer during peak demand periods in Saint-Georges-de-Pointindoux.
Saint-Georges-de-Pointindoux Airbnb Cancellation Policy Trends Analysis (2025)
Flexible
4 listings
33.3% of total
Moderate
4 listings
33.3% of total
Firm
2 listings
16.7% of total
Strict
2 listings
16.7% of total
Cancellation Policy Insights for Saint-Georges-de-Pointindoux
- The prevailing Airbnb cancellation policy trend in Saint-Georges-de-Pointindoux is Flexible, used by 33.3% of listings.
- There's a relatively balanced mix between guest-friendly (66.6%) and stricter (33.4%) policies, offering choices for different guest needs.
Recommendations for Hosts
- Consider adopting a Flexible policy to align with the 33.3% market standard in Saint-Georges-de-Pointindoux.
- Regularly review your cancellation policy against competitors and market demand shifts in Saint-Georges-de-Pointindoux.
Saint-Georges-de-Pointindoux STR Booking Lead Time Analysis (2025)
Average Booking Lead Time by Month
Booking Lead Time Insights for Saint-Georges-de-Pointindoux
- The overall average booking lead time for vacation rentals in Saint-Georges-de-Pointindoux is 56 days.
- Guests book furthest in advance for stays during August (average 126 days), likely coinciding with peak travel demand or local events.
- The shortest booking windows occur for stays in February (average 13 days), indicating more last-minute travel plans during this time.
- Seasonally, Summer (92 days avg.) sees the longest lead times, while Winter (25 days avg.) has the shortest, reflecting typical travel planning cycles.
Recommendations for Hosts
- Use the overall average lead time (56 days) as a baseline for your pricing and availability strategy in Saint-Georges-de-Pointindoux.
- For August stays, consider implementing length-of-stay discounts or slightly higher rates for bookings made less than 126 days out to capitalize on advance planning.
- During February, focus on last-minute booking availability and promotions, as guests book with very short notice (13 days avg.).
- Target marketing efforts for the Summer season well in advance (at least 92 days) to capture early planners.
- Monitor your own booking lead times against these Saint-Georges-de-Pointindoux averages to identify opportunities for dynamic pricing adjustments.
Popular & Essential Airbnb Amenities in Saint-Georges-de-Pointindoux (2025)
Amenity Prevalence
Amenity Insights for Saint-Georges-de-Pointindoux
- Essential amenities in Saint-Georges-de-Pointindoux that guests expect include: Heating, Free parking on premises, TV, Outdoor furniture, Hot water, Kitchen, Dishes and silverware. Lacking these (any) could significantly impact bookings.
- Popular amenities like Coffee maker, Refrigerator, Microwave are common but not universal. Offering these can provide a competitive edge.
Recommendations for Hosts
- Ensure your listing includes all essential amenities for Saint-Georges-de-Pointindoux: Heating, Free parking on premises, TV, Outdoor furniture, Hot water, Kitchen, Dishes and silverware.
- Consider adding popular differentiators like Coffee maker or Refrigerator to increase appeal.
- Highlight unique or less common amenities you offer (e.g., hot tub, dedicated workspace, EV charger) in your listing description and photos.
- Regularly check competitor amenities in Saint-Georges-de-Pointindoux to stay competitive.
Saint-Georges-de-Pointindoux Airbnb Guest Demographics & Profile Analysis (2025)
Guest Profile Summary for Saint-Georges-de-Pointindoux
- The typical guest profile for Airbnb in Saint-Georges-de-Pointindoux consists of primarily domestic travelers (97%), often arriving from nearby Rennes, typically belonging to the Post-2000s (Gen Z/Alpha) group (50%), primarily speaking French or English.
- Domestic travelers account for 96.9% of guests.
- Key international markets include France (96.9%) and Netherlands (1.5%).
- Top languages spoken are French (46.9%) followed by English (30.6%).
- A significant demographic segment is the Post-2000s (Gen Z/Alpha) group, representing 50% of guests.
Recommendations for Hosts
- Target domestic marketing efforts towards travelers from Rennes and Lyon.
- Tailor amenities and listing descriptions to appeal to the dominant Post-2000s (Gen Z/Alpha) demographic (e.g., highlight fast WiFi, smart home features, local guides).
- Highlight unique local experiences or amenities relevant to the primary guest profile.
- Consider seasonal promotions aligned with peak travel times for key origin markets.
Nearby Short-Term Rental Market Comparison
How does the Saint-Georges-de-Pointindoux Airbnb market stack up against its neighbors? Compare key performance metrics like average monthly revenue, ADR, and occupancy rates in surrounding areas to understand the broader regional STR landscape.
| Market | Active Properties | Monthly Revenue | Daily Rate | Avg. Occupancy |
|---|---|---|---|---|
| Vallon-sur-Gée | 11 | $2,913 | $379.01 | 30% |
| Bourneau | 11 | $2,747 | $442.07 | 35% |
| Nuaillé-d'Aunis | 10 | $2,741 | $373.83 | 37% |
| Le Bois-Plage-en-Ré | 303 | $2,528 | $284.63 | 45% |
| Chambellay | 11 | $2,525 | $255.24 | 34% |
| Sainte-Florence | 10 | $2,445 | $233.78 | 46% |
| Saint-Hippolyte | 10 | $2,443 | $204.98 | 44% |
| Abzac | 12 | $2,415 | $349.03 | 36% |
| La Flotte | 396 | $2,382 | $236.53 | 46% |
| Saint-Georges-des-Coteaux | 12 | $2,335 | $187.61 | 43% |