Saint-Christophe-du-Bois Airbnb Market Analysis 2025: Short Term Rental Data & Vacation Rental Statistics in Pays de la Loire, France
Is Airbnb profitable in Saint-Christophe-du-Bois in 2025? Explore comprehensive Airbnb analytics for Saint-Christophe-du-Bois, Pays de la Loire, France to uncover income potential. This 2025 STR market report for Saint-Christophe-du-Bois, based on AirROI data from April 2024 to March 2025, reveals key trends in the niche market of 22 active listings.
Whether you're considering an Airbnb investment in Saint-Christophe-du-Bois, optimizing your existing vacation rental, or exploring rental arbitrage opportunities, understanding the Saint-Christophe-du-Bois Airbnb data is crucial. Leveraging the low regulation environment is key to maximizing your short term rental income potential. Let's dive into the specifics.
Key Saint-Christophe-du-Bois Airbnb Performance Metrics Overview
Monthly Airbnb Revenue Variations & Income Potential in Saint-Christophe-du-Bois (2025)
Understanding the monthly revenue variations for Airbnb listings in Saint-Christophe-du-Bois is key to maximizing your short term rental income potential. Seasonality significantly impacts earnings. Our analysis, based on data from the past 12 months, shows that the peak revenue month for STRs in Saint-Christophe-du-Bois is typically August, while February often presents the lowest earnings, highlighting opportunities for strategic pricing adjustments during shoulder and low seasons. Explore the typical Airbnb income in Saint-Christophe-du-Bois across different performance tiers:
- Best-in-class properties (Top 10%) achieve $3,397+ monthly, often utilizing dynamic pricing and superior guest experiences.
- Strong performing properties (Top 25%) earn $1,986 or more, indicating effective management and desirable locations/amenities.
- Typical properties (Median) generate around $976 per month, representing the average market performance.
- Entry-level properties (Bottom 25%) see earnings around $570, often with potential for optimization.
Average Monthly Airbnb Earnings Trend in Saint-Christophe-du-Bois
Saint-Christophe-du-Bois Airbnb Occupancy Rate Trends (2025)
Maximize your bookings by understanding the Saint-Christophe-du-Bois STR occupancy trends. Seasonal demand shifts significantly influence how often properties are booked. Typically, Augustsees the highest demand (peak season occupancy), while February experiences the lowest (low season). Effective strategies, like adjusting minimum stays or offering promotions, can boost occupancy during slower periods. Here's how different property tiers perform in Saint-Christophe-du-Bois:
- Best-in-class properties (Top 10%) achieve 72%+ occupancy, indicating high desirability and potentially optimized availability.
- Strong performing properties (Top 25%) maintain 53% or higher occupancy, suggesting good market fit and guest satisfaction.
- Typical properties (Median) have an occupancy rate around 34%.
- Entry-level properties (Bottom 25%) average 18% occupancy, potentially facing higher vacancy.
Average Monthly Occupancy Rate Trend in Saint-Christophe-du-Bois
Average Daily Rate (ADR) Airbnb Trends in Saint-Christophe-du-Bois (2025)
Effective short term rental pricing strategy in Saint-Christophe-du-Bois involves understanding monthly ADR fluctuations. The Average Daily Rate (ADR) for Airbnb in Saint-Christophe-du-Bois typically peaks in July and dips lowest during March. Leveraging Airbnb dynamic pricing tools or strategies based on this seasonality can significantly boost revenue. Here's a look at the typical nightly rates achieved:
- Best-in-class properties (Top 10%) command rates of $293+ per night, often due to premium features or locations.
- Strong performing properties (Top 25%) achieve nightly rates of $169 or more.
- Typical properties (Median) charge around $78 per night.
- Entry-level properties (Bottom 25%) earn around $65 per night.
Average Daily Rate (ADR) Trend by Month in Saint-Christophe-du-Bois
Get Live Saint-Christophe-du-Bois Market Intelligence 👇

Explore Real-time Analytics
Airbnb Seasonality Analysis & Trends in Saint-Christophe-du-Bois (2025)
Peak Season (August, April, December)
- Revenue averages $2,157 per month
- Occupancy rates average 47.0%
- Daily rates average $145
Shoulder Season
- Revenue averages $1,600 per month
- Occupancy maintains around 43.4%
- Daily rates hold near $149
Low Season (January, February, March)
- Revenue drops to average $830 per month
- Occupancy decreases to average 20.5%
- Daily rates adjust to average $135
Seasonality Insights for Saint-Christophe-du-Bois
- The Airbnb seasonality in Saint-Christophe-du-Bois shows highly seasonal trends requiring careful strategy. While the sections above show seasonal averages, it's also insightful to look at the extremes:
- During the high season, the absolute peak month showcases Saint-Christophe-du-Bois's highest earning potential, with monthly revenues capable of climbing to $2,388, occupancy reaching a high of 65.8%, and ADRs peaking at $153.
- Conversely, the slowest single month of the year, typically falling within the low season, marks the market's lowest point. In this month, revenue might dip to $654, occupancy could drop to 12.7%, and ADRs may adjust down to $134.
- Understanding both the seasonal averages and these monthly peaks and troughs in revenue, occupancy, and ADR is crucial for maximizing your Airbnb profit potential in Saint-Christophe-du-Bois.
Seasonal Strategies for Maximizing Profit
- Peak Season: Maximize revenue through premium pricing and potentially longer minimum stays. Ensure high availability.
- Low Season: Offer competitive pricing, special promotions (e.g., extended stay discounts), and flexible cancellation policies. Target off-season travelers like remote workers or budget-conscious guests.
- Shoulder Seasons: Implement dynamic pricing that balances peak and low rates. Target weekend travelers or specific events. Offer slightly more flexible terms than peak season.
- Regularly analyze your own performance against these Saint-Christophe-du-Bois seasonality benchmarks and adjust your pricing and availability strategy accordingly.
Best Areas for Airbnb Investment in Saint-Christophe-du-Bois (2025)
Exploring the top neighborhoods for short-term rentals in Saint-Christophe-du-Bois? This section highlights key areas, outlining why they are attractive for hosts and guests, along with notable local attractions. Consider these locations based on your target guest profile and investment strategy.
| Neighborhood / Area | Why Host Here? (Target Guests & Appeal) | Key Attractions & Landmarks |
|---|---|---|
| Le Puy du Fou | Famous historical theme park attracting visitors from all over the world. Ideal for tourists looking for immersive experiences and history enthusiasts. | Le Puy du Fou theme park, Cinéscénie, Le Bal des Oiseaux Fantômes, Les Orgues de Feu, La Renaissance du Château |
| Angers | Nearby vibrant city known for its rich history and vibrant culture. Great for visitors exploring medieval architecture and local cuisine. | Château d'Angers, Terra Botanica, Angers Cathedral, Cloister of Saint-Nicolas, Bains-de-la-Roche |
| Saumur | Charming town known for its beautiful chateau and vineyards. Attractive for wine lovers and those seeking picturesque landscapes. | Château de Saumur, Caves de Saumur, Saumur wine cellars, La Loire à Vélo, Military Museum |
| Cholet | A bustling town that serves as a gateway to the historic and cultural sites of the region. Popular for its events and fairs. | Parc de Moine, Cholet Textile Museum, Statue of the Duke of D'Auvilliers, La Petite Couère, Puy du Fou nearby |
| Les Sables-d'Olonne | Coastal town known for its beautiful beaches and vibrant seaside atmosphere, ideal for summer holidays and water sports. | Les Sables d'Olonne Beach, Aquarium, La Chaume, Les Jardins de la Parée, Port Olona |
| Nantes | Lively city with a rich maritime history. A cultural hub that attracts many tourists and business events throughout the year. | Château des Ducs de Bretagne, Les Machines de l'île, Jardin des plantes, Le Lieu Unique, Nantes Cathedral |
| La Roche-sur-Yon | Historic town offering a blend of modern amenities and traditional charm. Attractive for visitors interested in local history. | La Roche-sur-Yon train station, Place Napoléon, Vélorail de la Vallée de l'Yon, Museum of the Vendée, Stade Pierre-Mauroy |
| Noirmoutier-en-l'Île | Picturesque island known for its beaches and natural beauty, perfect for tourists seeking relaxation and nature. | Plage des Sableaux, Noirmoutier Castle, Église de Noirmoutier, Salt Marshes, Cycle paths around the island |
Understanding Airbnb License Requirements & STR Laws in Saint-Christophe-du-Bois (2025)
While Saint-Christophe-du-Bois, Pays de la Loire, France currently shows low STR regulations, specific Airbnb license requirements might still exist or change. Always verify the latest short term rental regulations and Airbnb license requirements directly with local government authorities for Saint-Christophe-du-Bois to ensure full compliance before hosting.
(Source: AirROI data, 2025, based on 5% licensed listings)
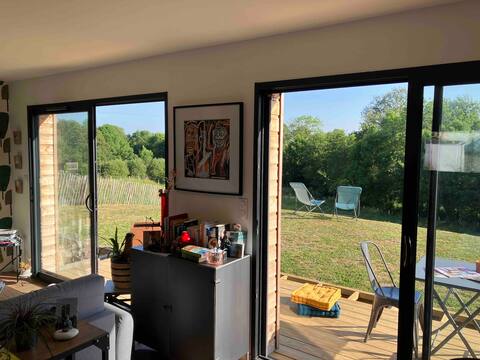
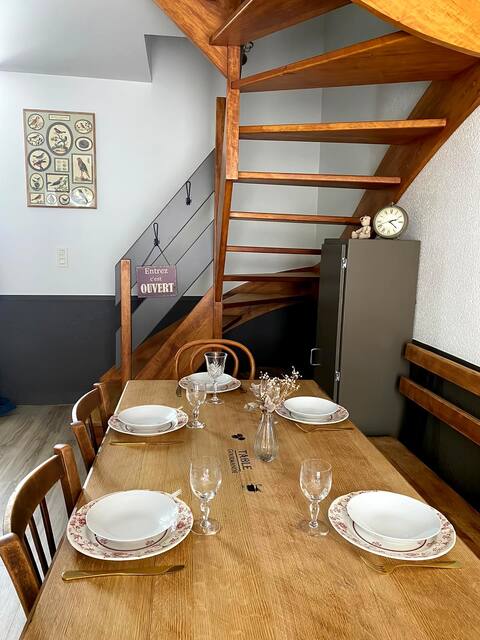
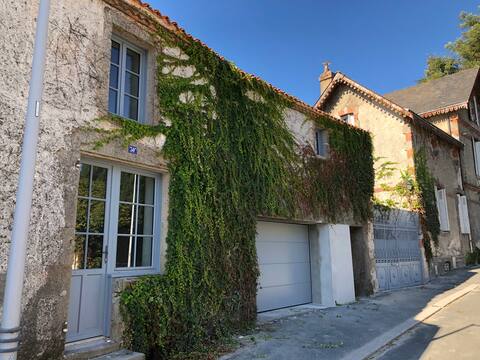
Top Performing Airbnb Properties in Saint-Christophe-du-Bois (2025)
Benchmark your potential! Explore examples of top-performing Airbnb properties in Saint-Christophe-du-Boisbased on Trailing Twelve Month (TTM) revenue. Analyze their characteristics, revenue, occupancy rate, and ADR to understand what drives success in this market.

shooting star lodge 20km Puy du Fou
Entire Place • 6 bedrooms

Le Relais du Roy / Maison - 20 min from Puy du Fou
Entire Place • 4 bedrooms
Maison St Christophe du Bois
Entire Place • 1 bedroom
House near Cholet, 20 mins from Puy du Fou!
Entire Place • 2 bedrooms
Cozy family cottage near Puy du Fou, 3*
Entire Place • 2 bedrooms

Studio near Puy du Fou
Entire Place • N/A
Note: Performance varies based on location, size, amenities, seasonality, and management quality. Data reflects the past 12 months.
Top Performing Airbnb Hosts in Saint-Christophe-du-Bois (2025)
Learn from the best! This table showcases top-performing Airbnb hosts in Saint-Christophe-du-Bois based on the number of properties managed and estimated total revenue over the past year. Analyze their scale and performance metrics.
| Host Name | Properties | Grossing Revenue | Stay Reviews | Avg Rating |
|---|---|---|---|---|
| Florence | 1 | $50,750 | 3 | 5.00/5.0 |
| Baptiste | 1 | $45,128 | 57 | 5.00/5.0 |
| Elisabeth | 1 | $27,388 | 18 | 4.94/5.0 |
| Pierre | 2 | $25,617 | 250 | 4.93/5.0 |
| Katel | 1 | $17,325 | 41 | 4.95/5.0 |
| Marie Reine | 2 | $14,237 | 204 | 4.89/5.0 |
| Stéphane | 1 | $14,195 | 296 | 4.94/5.0 |
| Alain | 1 | $13,877 | 23 | 4.96/5.0 |
| Myriam | 2 | $11,807 | 66 | 4.97/5.0 |
| Isabelle | 1 | $10,706 | 19 | 4.89/5.0 |
Analyzing the strategies of top hosts, such as their property selection, pricing, and guest communication, can offer valuable lessons for optimizing your own Airbnb operations in Saint-Christophe-du-Bois.
Dive Deeper: Advanced Saint-Christophe-du-Bois STR Market Data (2025)
Ready to unlock more insights? AirROI provides access to advanced metrics and comprehensive Airbnb data for Saint-Christophe-du-Bois. Explore detailed analytics beyond this report to refine your investment strategy, optimize pricing, and maximize your vacation rental profits.
Explore Advanced MetricsSaint-Christophe-du-Bois Short-Term Rental Market Composition (2025): Property & Room Types
Room Type Distribution
Property Type Distribution
Market Composition Insights for Saint-Christophe-du-Bois
- The Saint-Christophe-du-Bois Airbnb market composition is heavily skewed towards Entire Home/Apt listings, which make up 77.3% of the 22 active rentals. This indicates strong guest preference for privacy and space.
- Looking at the property type distribution in Saint-Christophe-du-Bois, House properties are the most common (77.3%), reflecting the local real estate landscape.
- Houses represent a significant 77.3% portion, catering likely to families or larger groups.
- Smaller segments like others (combined 4.5%) offer potential for unique stay experiences.
Saint-Christophe-du-Bois Airbnb Room Capacity Analysis (2025): Bedroom Distribution
Distribution of Listings by Number of Bedrooms
Room Capacity Insights for Saint-Christophe-du-Bois
- The dominant room capacity in Saint-Christophe-du-Bois is 1 bedroom listings, making up 45.5% of the market. This suggests a strong demand for properties suitable for couples or solo travelers.
- Together, 1 bedroom and 2 bedrooms properties represent 59.1% of the active Airbnb listings in Saint-Christophe-du-Bois, indicating a high concentration in these sizes.
Saint-Christophe-du-Bois Vacation Rental Guest Capacity Trends (2025)
Distribution of Listings by Guest Capacity
Guest Capacity Insights for Saint-Christophe-du-Bois
- The most common guest capacity trend in Saint-Christophe-du-Bois vacation rentals is listings accommodating 4 guests (27.3%). This suggests the primary traveler segment is likely small families or groups.
- Properties designed for 4 guests and 2 guests dominate the Saint-Christophe-du-Bois STR market, accounting for 50.0% of listings.
- 22.7% of properties accommodate 6+ guests, serving the market segment for larger families or group travel in Saint-Christophe-du-Bois.
- On average, properties in Saint-Christophe-du-Bois are equipped to host 3.4 guests.
Saint-Christophe-du-Bois Airbnb Booking Patterns (2025): Available vs. Booked Days
Available Days Distribution
Booked Days Distribution
Booking Pattern Insights for Saint-Christophe-du-Bois
- The most common availability pattern in Saint-Christophe-du-Bois falls within the 181-270 days range, representing 40.9% of listings. This suggests many properties have significant open periods on their calendars.
- Approximately 81.8% of listings show high availability (181+ days open annually), indicating potential for increased bookings or specific owner usage patterns.
- For booked days, the 91-180 days range is most frequent in Saint-Christophe-du-Bois (40.9%), reflecting common guest stay durations or potential owner blocking patterns.
- A notable 18.2% of properties secure long booking periods (181+ days booked per year), highlighting successful long-term rental strategies or significant owner usage.
Saint-Christophe-du-Bois Airbnb Minimum Stay Requirements Analysis
Distribution of Listings by Minimum Night Requirement
1 Night
8 listings
36.4% of total
2 Nights
10 listings
45.5% of total
3 Nights
1 listings
4.5% of total
30+ Nights
3 listings
13.6% of total
Key Insights
- The most prevalent minimum stay requirement in Saint-Christophe-du-Bois is 2 Nights, adopted by 45.5% of listings. This highlights the market's preference for shorter, flexible bookings.
- A strong majority (81.9%) of the Saint-Christophe-du-Bois Airbnb data shows acceptance of very short stays (1-2 nights), indicating a dynamic, high-turnover market.
- A significant segment (13.6%) caters to monthly stays (30+ nights) in Saint-Christophe-du-Bois, pointing to opportunities in the extended-stay market.
Recommendations
- Align with the market by considering a 2 Nights minimum stay, as 45.5% of Saint-Christophe-du-Bois hosts use this setting.
- Explore offering discounts for stays of 30+ nights to attract the 13.6% of the market seeking extended stays.
- Adjust minimum nights based on seasonality – potentially shorter during low season and longer during peak demand periods in Saint-Christophe-du-Bois.
Saint-Christophe-du-Bois Airbnb Cancellation Policy Trends Analysis (2025)
Flexible
5 listings
22.7% of total
Moderate
12 listings
54.5% of total
Firm
2 listings
9.1% of total
Strict
3 listings
13.6% of total
Cancellation Policy Insights for Saint-Christophe-du-Bois
- The prevailing Airbnb cancellation policy trend in Saint-Christophe-du-Bois is Moderate, used by 54.5% of listings.
- The market strongly favors guest-friendly terms, with 77.2% of listings offering Flexible or Moderate policies. This suggests guests in Saint-Christophe-du-Bois may expect booking flexibility.
Recommendations for Hosts
- Consider adopting a Moderate policy to align with the 54.5% market standard in Saint-Christophe-du-Bois.
- Using a Strict policy might deter some guests, as only 13.6% of listings use it. Evaluate if potential revenue protection outweighs possible lower booking rates.
- Regularly review your cancellation policy against competitors and market demand shifts in Saint-Christophe-du-Bois.
Saint-Christophe-du-Bois STR Booking Lead Time Analysis (2025)
Average Booking Lead Time by Month
Booking Lead Time Insights for Saint-Christophe-du-Bois
- The overall average booking lead time for vacation rentals in Saint-Christophe-du-Bois is 48 days.
- Guests book furthest in advance for stays during December (average 99 days), likely coinciding with peak travel demand or local events.
- The shortest booking windows occur for stays in January (average 27 days), indicating more last-minute travel plans during this time.
- Seasonally, Winter (67 days avg.) sees the longest lead times, while Fall (56 days avg.) has the shortest, reflecting typical travel planning cycles.
Recommendations for Hosts
- Use the overall average lead time (48 days) as a baseline for your pricing and availability strategy in Saint-Christophe-du-Bois.
- For December stays, consider implementing length-of-stay discounts or slightly higher rates for bookings made less than 99 days out to capitalize on advance planning.
- Target marketing efforts for the Winter season well in advance (at least 67 days) to capture early planners.
- Monitor your own booking lead times against these Saint-Christophe-du-Bois averages to identify opportunities for dynamic pricing adjustments.
Popular & Essential Airbnb Amenities in Saint-Christophe-du-Bois (2025)
Amenity Prevalence
Amenity Insights for Saint-Christophe-du-Bois
- Essential amenities in Saint-Christophe-du-Bois that guests expect include: Heating, Bed linens, Wifi, Hangers, Hot water. Lacking these (any) could significantly impact bookings.
- Popular amenities like Kitchen, Hair dryer, Smoke alarm are common but not universal. Offering these can provide a competitive edge.
Recommendations for Hosts
- Ensure your listing includes all essential amenities for Saint-Christophe-du-Bois: Heating, Bed linens, Wifi, Hangers, Hot water.
- Prioritize adding missing essentials: Wifi, Hangers, Hot water.
- Consider adding popular differentiators like Kitchen or Hair dryer to increase appeal.
- Highlight unique or less common amenities you offer (e.g., hot tub, dedicated workspace, EV charger) in your listing description and photos.
- Regularly check competitor amenities in Saint-Christophe-du-Bois to stay competitive.
Saint-Christophe-du-Bois Airbnb Guest Demographics & Profile Analysis (2025)
Guest Profile Summary for Saint-Christophe-du-Bois
- The typical guest profile for Airbnb in Saint-Christophe-du-Bois consists of primarily domestic travelers (95%), often arriving from nearby Bordeaux, typically belonging to the Post-2000s (Gen Z/Alpha) group (50%), primarily speaking French or English.
- Domestic travelers account for 95.1% of guests.
- Key international markets include France (95.1%) and Belgium (1.5%).
- Top languages spoken are French (61.3%) followed by English (29.2%).
- A significant demographic segment is the Post-2000s (Gen Z/Alpha) group, representing 50% of guests.
Recommendations for Hosts
- Target domestic marketing efforts towards travelers from Bordeaux and Paris.
- Tailor amenities and listing descriptions to appeal to the dominant Post-2000s (Gen Z/Alpha) demographic (e.g., highlight fast WiFi, smart home features, local guides).
- Highlight unique local experiences or amenities relevant to the primary guest profile.
- Consider seasonal promotions aligned with peak travel times for key origin markets.
Nearby Short-Term Rental Market Comparison
How does the Saint-Christophe-du-Bois Airbnb market stack up against its neighbors? Compare key performance metrics like average monthly revenue, ADR, and occupancy rates in surrounding areas to understand the broader regional STR landscape.
| Market | Active Properties | Monthly Revenue | Daily Rate | Avg. Occupancy |
|---|---|---|---|---|
| Coteaux-sur-Loire | 19 | $3,328 | $270.00 | 41% |
| Moulins-le-Carbonnel | 11 | $3,213 | $320.85 | 35% |
| Villiers-sur-Loir | 10 | $2,967 | $216.51 | 41% |
| Artannes-sur-Indre | 21 | $2,949 | $275.91 | 41% |
| Vallon-sur-Gée | 11 | $2,913 | $379.01 | 30% |
| La Ferté-en-Ouche | 19 | $2,854 | $258.24 | 39% |
| Tourouvre au Perche | 31 | $2,842 | $237.49 | 43% |
| Bourneau | 11 | $2,747 | $442.07 | 35% |
| Nuaillé-d'Aunis | 10 | $2,741 | $373.83 | 37% |
| Ambillou | 18 | $2,701 | $370.97 | 28% |