Saint-André-des-Eaux Airbnb Market Analysis 2025: Short Term Rental Data & Vacation Rental Statistics in Pays de la Loire, France
Is Airbnb profitable in Saint-André-des-Eaux in 2025? Explore comprehensive Airbnb analytics for Saint-André-des-Eaux, Pays de la Loire, France to uncover income potential. This 2025 STR market report for Saint-André-des-Eaux, based on AirROI data from April 2024 to March 2025, reveals key trends in the niche market of 53 active listings.
Whether you're considering an Airbnb investment in Saint-André-des-Eaux, optimizing your existing vacation rental, or exploring rental arbitrage opportunities, understanding the Saint-André-des-Eaux Airbnb data is crucial. Leveraging the low regulation environment is key to maximizing your short term rental income potential. Let's dive into the specifics.
Key Saint-André-des-Eaux Airbnb Performance Metrics Overview
Monthly Airbnb Revenue Variations & Income Potential in Saint-André-des-Eaux (2025)
Understanding the monthly revenue variations for Airbnb listings in Saint-André-des-Eaux is key to maximizing your short term rental income potential. Seasonality significantly impacts earnings. Our analysis, based on data from the past 12 months, shows that the peak revenue month for STRs in Saint-André-des-Eaux is typically August, while March often presents the lowest earnings, highlighting opportunities for strategic pricing adjustments during shoulder and low seasons. Explore the typical Airbnb income in Saint-André-des-Eaux across different performance tiers:
- Best-in-class properties (Top 10%) achieve $3,533+ monthly, often utilizing dynamic pricing and superior guest experiences.
- Strong performing properties (Top 25%) earn $2,002 or more, indicating effective management and desirable locations/amenities.
- Typical properties (Median) generate around $1,088 per month, representing the average market performance.
- Entry-level properties (Bottom 25%) see earnings around $559, often with potential for optimization.
Average Monthly Airbnb Earnings Trend in Saint-André-des-Eaux
Saint-André-des-Eaux Airbnb Occupancy Rate Trends (2025)
Maximize your bookings by understanding the Saint-André-des-Eaux STR occupancy trends. Seasonal demand shifts significantly influence how often properties are booked. Typically, Augustsees the highest demand (peak season occupancy), while June experiences the lowest (low season). Effective strategies, like adjusting minimum stays or offering promotions, can boost occupancy during slower periods. Here's how different property tiers perform in Saint-André-des-Eaux:
- Best-in-class properties (Top 10%) achieve 70%+ occupancy, indicating high desirability and potentially optimized availability.
- Strong performing properties (Top 25%) maintain 51% or higher occupancy, suggesting good market fit and guest satisfaction.
- Typical properties (Median) have an occupancy rate around 30%.
- Entry-level properties (Bottom 25%) average 18% occupancy, potentially facing higher vacancy.
Average Monthly Occupancy Rate Trend in Saint-André-des-Eaux
Average Daily Rate (ADR) Airbnb Trends in Saint-André-des-Eaux (2025)
Effective short term rental pricing strategy in Saint-André-des-Eaux involves understanding monthly ADR fluctuations. The Average Daily Rate (ADR) for Airbnb in Saint-André-des-Eaux typically peaks in November and dips lowest during October. Leveraging Airbnb dynamic pricing tools or strategies based on this seasonality can significantly boost revenue. Here's a look at the typical nightly rates achieved:
- Best-in-class properties (Top 10%) command rates of $294+ per night, often due to premium features or locations.
- Strong performing properties (Top 25%) achieve nightly rates of $184 or more.
- Typical properties (Median) charge around $105 per night.
- Entry-level properties (Bottom 25%) earn around $78 per night.
Average Daily Rate (ADR) Trend by Month in Saint-André-des-Eaux
Get Live Saint-André-des-Eaux Market Intelligence 👇
Explore Real-time Analytics
Airbnb Seasonality Analysis & Trends in Saint-André-des-Eaux (2025)
Peak Season (August, July, May)
- Revenue averages $2,941 per month
- Occupancy rates average 49.7%
- Daily rates average $151
Shoulder Season
- Revenue averages $1,399 per month
- Occupancy maintains around 30.4%
- Daily rates hold near $151
Low Season (January, March, November)
- Revenue drops to average $907 per month
- Occupancy decreases to average 30.2%
- Daily rates adjust to average $158
Seasonality Insights for Saint-André-des-Eaux
- The Airbnb seasonality in Saint-André-des-Eaux shows highly seasonal trends requiring careful strategy. While the sections above show seasonal averages, it's also insightful to look at the extremes:
- During the high season, the absolute peak month showcases Saint-André-des-Eaux's highest earning potential, with monthly revenues capable of climbing to $3,843, occupancy reaching a high of 71.2%, and ADRs peaking at $160.
- Conversely, the slowest single month of the year, typically falling within the low season, marks the market's lowest point. In this month, revenue might dip to $858, occupancy could drop to 18.7%, and ADRs may adjust down to $146.
- Understanding both the seasonal averages and these monthly peaks and troughs in revenue, occupancy, and ADR is crucial for maximizing your Airbnb profit potential in Saint-André-des-Eaux.
Seasonal Strategies for Maximizing Profit
- Peak Season: Maximize revenue through premium pricing and potentially longer minimum stays. Ensure high availability.
- Low Season: Offer competitive pricing, special promotions (e.g., extended stay discounts), and flexible cancellation policies. Target off-season travelers like remote workers or budget-conscious guests.
- Shoulder Seasons: Implement dynamic pricing that balances peak and low rates. Target weekend travelers or specific events. Offer slightly more flexible terms than peak season.
- Regularly analyze your own performance against these Saint-André-des-Eaux seasonality benchmarks and adjust your pricing and availability strategy accordingly.
Best Areas for Airbnb Investment in Saint-André-des-Eaux (2025)
Exploring the top neighborhoods for short-term rentals in Saint-André-des-Eaux? This section highlights key areas, outlining why they are attractive for hosts and guests, along with notable local attractions. Consider these locations based on your target guest profile and investment strategy.
| Neighborhood / Area | Why Host Here? (Target Guests & Appeal) | Key Attractions & Landmarks |
|---|---|---|
| Saint-André-des-Eaux Center | Charming town center with local shops, cafés, and restaurants. Great for visitors looking to experience the local culture and enjoy the amenities nearby. | Local markets, Café culture, Nearby parks, Historic sites |
| La Brière | Beautiful natural park known for its marshlands and diverse wildlife. Ideal for nature lovers and tourists looking for outdoor activities such as hiking and bird watching. | La Brière Regional Natural Park, Boat tours, Hiking trails, Flora and fauna |
| Salt Marshes | Unique coastal environment offering a variety of landscapes and activities like bird watching and nature walks. Popular among eco-tourists and those seeking tranquility. | Salt marshes tours, Wildlife observation, Photography spots, Secluded beaches |
| Nearby Beaches | Access to beautiful sandy beaches just a short drive away. Perfect for families and tourists looking for a seaside holiday experience. | Beach activities, Coastal restaurants, Water sports, Promenades |
| Golf Courses | Several golf courses nearby attracting golf enthusiasts and visitors looking for leisure activities. Great option for guests seeking sports and relaxation. | Golf club facilities, Scenic views, Dining options at clubs, Golf tournaments |
| Puy du Fou | Famous historical theme park located within driving distance. A must-visit for families and those interested in immersive historical experiences. | Historical shows, Themed attractions, Cultural exhibitions, Family-friendly activities |
| Nantes | Nearby city offering a wide range of attractions, dining, and entertainment options. Ideal for urban explorers and those seeking nightlife. | Castle of the Dukes of Brittany, Les Machines de l'île, Nantes' nightlife, Shopping districts |
| Cultural Events | Local festivals and events take place throughout the year, drawing visitors interested in French culture and local traditions. | Annual festivals, Concerts, Art exhibitions, Local cuisine tastings |
Understanding Airbnb License Requirements & STR Laws in Saint-André-des-Eaux (2025)
While Saint-André-des-Eaux, Pays de la Loire, France currently shows low STR regulations, specific Airbnb license requirements might still exist or change. Always verify the latest short term rental regulations and Airbnb license requirements directly with local government authorities for Saint-André-des-Eaux to ensure full compliance before hosting.
(Source: AirROI data, 2025, based on 6% licensed listings)
Top Performing Airbnb Properties in Saint-André-des-Eaux (2025)
Benchmark your potential! Explore examples of top-performing Airbnb properties in Saint-André-des-Eauxbased on Trailing Twelve Month (TTM) revenue. Analyze their characteristics, revenue, occupancy rate, and ADR to understand what drives success in this market.
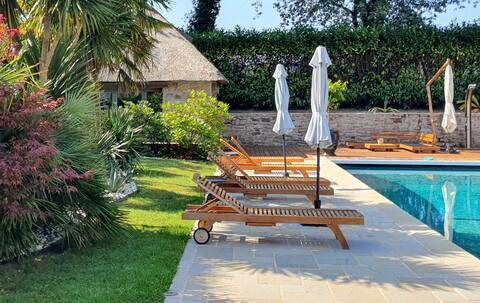
Villa de Kerquessaud : Luxury and Authenticity
Entire Place • 8 bedrooms
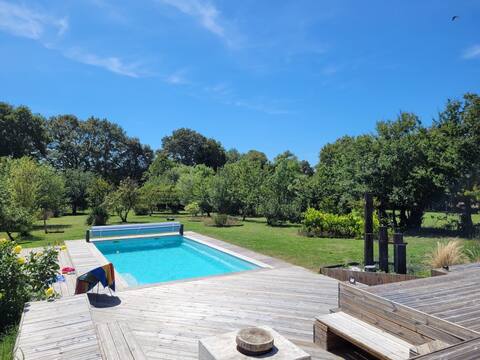
Beautiful cottage offering calm and conviviality.
Entire Place • 4 bedrooms
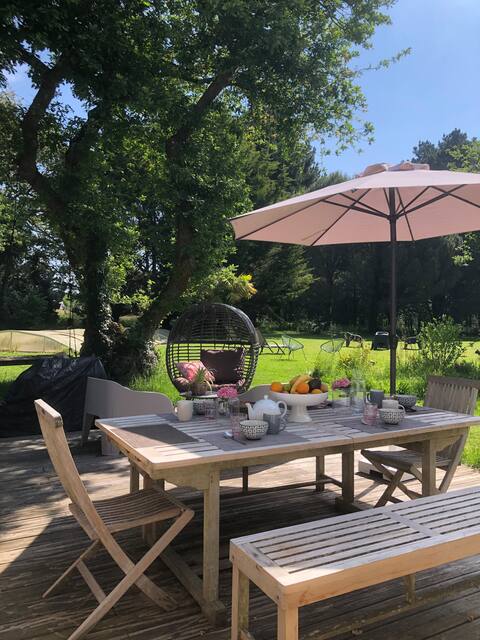
Golf La Baule, family home 5 km from the beach
Entire Place • 5 bedrooms
golf home with a pool
Entire Place • 5 bedrooms
Escape to the heart of the Baule golf course
Entire Place • 1 bedroom
Single-storey pool house between Sea and Brière
Entire Place • 4 bedrooms
Note: Performance varies based on location, size, amenities, seasonality, and management quality. Data reflects the past 12 months.
Top Performing Airbnb Hosts in Saint-André-des-Eaux (2025)
Learn from the best! This table showcases top-performing Airbnb hosts in Saint-André-des-Eaux based on the number of properties managed and estimated total revenue over the past year. Analyze their scale and performance metrics.
| Host Name | Properties | Grossing Revenue | Stay Reviews | Avg Rating |
|---|---|---|---|---|
| Laurent | 1 | $78,255 | 69 | 4.87/5.0 |
| Fanny Et Amandine | 1 | $69,028 | 4 | 5.00/5.0 |
| Vaité | 1 | $34,353 | 8 | 5.00/5.0 |
| Franck | 1 | $31,502 | 6 | 5.00/5.0 |
| Charlène | 1 | $23,254 | 20 | 4.85/5.0 |
| Aurelie | 1 | $22,192 | 13 | 4.77/5.0 |
| Alexane & Guillaume | 1 | $18,557 | 15 | 4.47/5.0 |
| Catherine Et Alain | 1 | $18,168 | 106 | 4.96/5.0 |
| Aurelie Alan | 1 | $18,115 | 11 | 4.82/5.0 |
| Sylvie | 1 | $17,153 | 25 | 5.00/5.0 |
Analyzing the strategies of top hosts, such as their property selection, pricing, and guest communication, can offer valuable lessons for optimizing your own Airbnb operations in Saint-André-des-Eaux.
Dive Deeper: Advanced Saint-André-des-Eaux STR Market Data (2025)
Ready to unlock more insights? AirROI provides access to advanced metrics and comprehensive Airbnb data for Saint-André-des-Eaux. Explore detailed analytics beyond this report to refine your investment strategy, optimize pricing, and maximize your vacation rental profits.
Explore Advanced MetricsSaint-André-des-Eaux Short-Term Rental Market Composition (2025): Property & Room Types
Room Type Distribution
Property Type Distribution
Market Composition Insights for Saint-André-des-Eaux
- The Saint-André-des-Eaux Airbnb market composition is heavily skewed towards Entire Home/Apt listings, which make up 90.6% of the 53 active rentals. This indicates strong guest preference for privacy and space.
- Looking at the property type distribution in Saint-André-des-Eaux, House properties are the most common (60.4%), reflecting the local real estate landscape.
- Houses represent a significant 60.4% portion, catering likely to families or larger groups.
- The presence of 7.5% Hotel/Boutique listings indicates integration with traditional hospitality.
- Smaller segments like outdoor/unique, others (combined 3.8%) offer potential for unique stay experiences.
Saint-André-des-Eaux Airbnb Room Capacity Analysis (2025): Bedroom Distribution
Distribution of Listings by Number of Bedrooms
Room Capacity Insights for Saint-André-des-Eaux
- The dominant room capacity in Saint-André-des-Eaux is 1 bedroom listings, making up 37.7% of the market. This suggests a strong demand for properties suitable for couples or solo travelers.
- Together, 1 bedroom and 2 bedrooms properties represent 58.5% of the active Airbnb listings in Saint-André-des-Eaux, indicating a high concentration in these sizes.
- A significant 33.9% of listings offer 3+ bedrooms, catering to larger groups and families seeking more space in Saint-André-des-Eaux.
Saint-André-des-Eaux Vacation Rental Guest Capacity Trends (2025)
Distribution of Listings by Guest Capacity
Guest Capacity Insights for Saint-André-des-Eaux
- The most common guest capacity trend in Saint-André-des-Eaux vacation rentals is listings accommodating 4 guests (34%). This suggests the primary traveler segment is likely small families or groups.
- Properties designed for 4 guests and 2 guests dominate the Saint-André-des-Eaux STR market, accounting for 52.9% of listings.
- 35.9% of properties accommodate 6+ guests, serving the market segment for larger families or group travel in Saint-André-des-Eaux.
- On average, properties in Saint-André-des-Eaux are equipped to host 4.5 guests.
Saint-André-des-Eaux Airbnb Booking Patterns (2025): Available vs. Booked Days
Available Days Distribution
Booked Days Distribution
Booking Pattern Insights for Saint-André-des-Eaux
- The most common availability pattern in Saint-André-des-Eaux falls within the 271-366 days range, representing 77.4% of listings. This suggests many properties have significant open periods on their calendars.
- Approximately 90.6% of listings show high availability (181+ days open annually), indicating potential for increased bookings or specific owner usage patterns.
- For booked days, the 31-90 days range is most frequent in Saint-André-des-Eaux (52.8%), reflecting common guest stay durations or potential owner blocking patterns.
- A notable 9.4% of properties secure long booking periods (181+ days booked per year), highlighting successful long-term rental strategies or significant owner usage.
Saint-André-des-Eaux Airbnb Minimum Stay Requirements Analysis
Distribution of Listings by Minimum Night Requirement
1 Night
4 listings
8% of total
2 Nights
14 listings
28% of total
3 Nights
9 listings
18% of total
4-6 Nights
14 listings
28% of total
7-29 Nights
6 listings
12% of total
30+ Nights
3 listings
6% of total
Key Insights
- The most prevalent minimum stay requirement in Saint-André-des-Eaux is 2 Nights, adopted by 28% of listings. This highlights the market's preference for shorter, flexible bookings.
Recommendations
- Align with the market by considering a 2 Nights minimum stay, as 28% of Saint-André-des-Eaux hosts use this setting.
- If feasible, allowing 1-night stays, especially midweek or during low season, could capture last-minute bookings, as only 8% currently do.
- Explore offering discounts for stays of 30+ nights to attract the 6% of the market seeking extended stays.
- Adjust minimum nights based on seasonality – potentially shorter during low season and longer during peak demand periods in Saint-André-des-Eaux.
Saint-André-des-Eaux Airbnb Cancellation Policy Trends Analysis (2025)
Flexible
9 listings
20% of total
Moderate
16 listings
35.6% of total
Firm
6 listings
13.3% of total
Strict
14 listings
31.1% of total
Cancellation Policy Insights for Saint-André-des-Eaux
- The prevailing Airbnb cancellation policy trend in Saint-André-des-Eaux is Moderate, used by 35.6% of listings.
- There's a relatively balanced mix between guest-friendly (55.6%) and stricter (44.4%) policies, offering choices for different guest needs.
Recommendations for Hosts
- Consider adopting a Moderate policy to align with the 35.6% market standard in Saint-André-des-Eaux.
- With 31.1% using Strict terms, this is a viable option in Saint-André-des-Eaux, particularly for high-value properties or during peak demand periods.
- Regularly review your cancellation policy against competitors and market demand shifts in Saint-André-des-Eaux.
Saint-André-des-Eaux STR Booking Lead Time Analysis (2025)
Average Booking Lead Time by Month
Booking Lead Time Insights for Saint-André-des-Eaux
- The overall average booking lead time for vacation rentals in Saint-André-des-Eaux is 57 days.
- Guests book furthest in advance for stays during September (average 89 days), likely coinciding with peak travel demand or local events.
- The shortest booking windows occur for stays in December (average 18 days), indicating more last-minute travel plans during this time.
- Seasonally, Summer (68 days avg.) sees the longest lead times, while Winter (33 days avg.) has the shortest, reflecting typical travel planning cycles.
Recommendations for Hosts
- Use the overall average lead time (57 days) as a baseline for your pricing and availability strategy in Saint-André-des-Eaux.
- For September stays, consider implementing length-of-stay discounts or slightly higher rates for bookings made less than 89 days out to capitalize on advance planning.
- Target marketing efforts for the Summer season well in advance (at least 68 days) to capture early planners.
- Monitor your own booking lead times against these Saint-André-des-Eaux averages to identify opportunities for dynamic pricing adjustments.
Popular & Essential Airbnb Amenities in Saint-André-des-Eaux (2025)
Amenity Prevalence
Amenity Insights for Saint-André-des-Eaux
- Essential amenities in Saint-André-des-Eaux that guests expect include: Free parking on premises, Kitchen. Lacking these (any) could significantly impact bookings.
- Popular amenities like Heating, Hot water, Smoke alarm are common but not universal. Offering these can provide a competitive edge.
Recommendations for Hosts
- Ensure your listing includes all essential amenities for Saint-André-des-Eaux: Free parking on premises, Kitchen.
- Prioritize adding missing essentials: Kitchen.
- Consider adding popular differentiators like Heating or Hot water to increase appeal.
- Highlight unique or less common amenities you offer (e.g., hot tub, dedicated workspace, EV charger) in your listing description and photos.
- Regularly check competitor amenities in Saint-André-des-Eaux to stay competitive.
Saint-André-des-Eaux Airbnb Guest Demographics & Profile Analysis (2025)
Guest Profile Summary for Saint-André-des-Eaux
- The typical guest profile for Airbnb in Saint-André-des-Eaux consists of primarily domestic travelers (91%), often arriving from nearby Nantes, typically belonging to the Post-2000s (Gen Z/Alpha) group (50%), primarily speaking French or English.
- Domestic travelers account for 90.5% of guests.
- Key international markets include France (90.5%) and United Kingdom (3.8%).
- Top languages spoken are French (51.8%) followed by English (29.2%).
- A significant demographic segment is the Post-2000s (Gen Z/Alpha) group, representing 50% of guests.
Recommendations for Hosts
- Target domestic marketing efforts towards travelers from Nantes and Paris.
- Tailor amenities and listing descriptions to appeal to the dominant Post-2000s (Gen Z/Alpha) demographic (e.g., highlight fast WiFi, smart home features, local guides).
- Highlight unique local experiences or amenities relevant to the primary guest profile.
- Consider seasonal promotions aligned with peak travel times for key origin markets.
Nearby Short-Term Rental Market Comparison
How does the Saint-André-des-Eaux Airbnb market stack up against its neighbors? Compare key performance metrics like average monthly revenue, ADR, and occupancy rates in surrounding areas to understand the broader regional STR landscape.
| Market | Active Properties | Monthly Revenue | Daily Rate | Avg. Occupancy |
|---|---|---|---|---|
| Le Bois-Plage-en-Ré | 303 | $2,528 | $284.63 | 45% |
| Sainte-Florence | 10 | $2,445 | $233.78 | 46% |
| La Flotte | 396 | $2,382 | $236.53 | 46% |
| Île-de-Bréhat | 46 | $2,254 | $221.52 | 45% |
| La Couarde-sur-Mer | 218 | $2,188 | $259.23 | 41% |
| Le Parc | 13 | $2,138 | $173.31 | 43% |
| Ombrée d'Anjou | 21 | $2,063 | $213.63 | 35% |
| Lanmodez | 19 | $2,050 | $219.93 | 42% |
| Île-aux-Moines | 98 | $2,048 | $236.18 | 42% |
| Laillé | 12 | $2,046 | $116.65 | 37% |