Rives-du-Fougerais Airbnb Market Analysis 2025: Short Term Rental Data & Vacation Rental Statistics in Pays de la Loire, France
Is Airbnb profitable in Rives-du-Fougerais in 2025? Explore comprehensive Airbnb analytics for Rives-du-Fougerais, Pays de la Loire, France to uncover income potential. This 2025 STR market report for Rives-du-Fougerais, based on AirROI data from April 2024 to March 2025, reveals key trends in the niche market of 19 active listings.
Whether you're considering an Airbnb investment in Rives-du-Fougerais, optimizing your existing vacation rental, or exploring rental arbitrage opportunities, understanding the Rives-du-Fougerais Airbnb data is crucial. Understanding the local regulations is key to maximizing your short term rental income potential. Let's dive into the specifics.
Key Rives-du-Fougerais Airbnb Performance Metrics Overview
Monthly Airbnb Revenue Variations & Income Potential in Rives-du-Fougerais (2025)
Understanding the monthly revenue variations for Airbnb listings in Rives-du-Fougerais is key to maximizing your short term rental income potential. Seasonality significantly impacts earnings. Our analysis, based on data from the past 12 months, shows that the peak revenue month for STRs in Rives-du-Fougerais is typically July, while November often presents the lowest earnings, highlighting opportunities for strategic pricing adjustments during shoulder and low seasons. Explore the typical Airbnb income in Rives-du-Fougerais across different performance tiers:
- Best-in-class properties (Top 10%) achieve $3,477+ monthly, often utilizing dynamic pricing and superior guest experiences.
- Strong performing properties (Top 25%) earn $1,719 or more, indicating effective management and desirable locations/amenities.
- Typical properties (Median) generate around $946 per month, representing the average market performance.
- Entry-level properties (Bottom 25%) see earnings around $508, often with potential for optimization.
Average Monthly Airbnb Earnings Trend in Rives-du-Fougerais
Rives-du-Fougerais Airbnb Occupancy Rate Trends (2025)
Maximize your bookings by understanding the Rives-du-Fougerais STR occupancy trends. Seasonal demand shifts significantly influence how often properties are booked. Typically, Julysees the highest demand (peak season occupancy), while November experiences the lowest (low season). Effective strategies, like adjusting minimum stays or offering promotions, can boost occupancy during slower periods. Here's how different property tiers perform in Rives-du-Fougerais:
- Best-in-class properties (Top 10%) achieve 53%+ occupancy, indicating high desirability and potentially optimized availability.
- Strong performing properties (Top 25%) maintain 43% or higher occupancy, suggesting good market fit and guest satisfaction.
- Typical properties (Median) have an occupancy rate around 31%.
- Entry-level properties (Bottom 25%) average 18% occupancy, potentially facing higher vacancy.
Average Monthly Occupancy Rate Trend in Rives-du-Fougerais
Average Daily Rate (ADR) Airbnb Trends in Rives-du-Fougerais (2025)
Effective short term rental pricing strategy in Rives-du-Fougerais involves understanding monthly ADR fluctuations. The Average Daily Rate (ADR) for Airbnb in Rives-du-Fougerais typically peaks in July and dips lowest during February. Leveraging Airbnb dynamic pricing tools or strategies based on this seasonality can significantly boost revenue. Here's a look at the typical nightly rates achieved:
- Best-in-class properties (Top 10%) command rates of $243+ per night, often due to premium features or locations.
- Strong performing properties (Top 25%) achieve nightly rates of $146 or more.
- Typical properties (Median) charge around $100 per night.
- Entry-level properties (Bottom 25%) earn around $65 per night.
Average Daily Rate (ADR) Trend by Month in Rives-du-Fougerais
Get Live Rives-du-Fougerais Market Intelligence 👇

Explore Real-time Analytics
Airbnb Seasonality Analysis & Trends in Rives-du-Fougerais (2025)
Peak Season (July, August, April)
- Revenue averages $3,007 per month
- Occupancy rates average 53.2%
- Daily rates average $140
Shoulder Season
- Revenue averages $1,412 per month
- Occupancy maintains around 28.6%
- Daily rates hold near $132
Low Season (February, March, November)
- Revenue drops to average $598 per month
- Occupancy decreases to average 20.2%
- Daily rates adjust to average $126
Seasonality Insights for Rives-du-Fougerais
- The Airbnb seasonality in Rives-du-Fougerais shows highly seasonal trends requiring careful strategy. While the sections above show seasonal averages, it's also insightful to look at the extremes:
- During the high season, the absolute peak month showcases Rives-du-Fougerais's highest earning potential, with monthly revenues capable of climbing to $3,472, occupancy reaching a high of 67.0%, and ADRs peaking at $148.
- Conversely, the slowest single month of the year, typically falling within the low season, marks the market's lowest point. In this month, revenue might dip to $529, occupancy could drop to 14.0%, and ADRs may adjust down to $124.
- Understanding both the seasonal averages and these monthly peaks and troughs in revenue, occupancy, and ADR is crucial for maximizing your Airbnb profit potential in Rives-du-Fougerais.
Seasonal Strategies for Maximizing Profit
- Peak Season: Maximize revenue through premium pricing and potentially longer minimum stays. Ensure high availability.
- Low Season: Offer competitive pricing, special promotions (e.g., extended stay discounts), and flexible cancellation policies. Target off-season travelers like remote workers or budget-conscious guests.
- Shoulder Seasons: Implement dynamic pricing that balances peak and low rates. Target weekend travelers or specific events. Offer slightly more flexible terms than peak season.
- Regularly analyze your own performance against these Rives-du-Fougerais seasonality benchmarks and adjust your pricing and availability strategy accordingly.
Best Areas for Airbnb Investment in Rives-du-Fougerais (2025)
Exploring the top neighborhoods for short-term rentals in Rives-du-Fougerais? This section highlights key areas, outlining why they are attractive for hosts and guests, along with notable local attractions. Consider these locations based on your target guest profile and investment strategy.
| Neighborhood / Area | Why Host Here? (Target Guests & Appeal) | Key Attractions & Landmarks |
|---|---|---|
| Le Coteau | A picturesque village known for its charming landscape and proximity to nature. It offers a tranquil setting for guests seeking relaxation and rural experiences. | Château de Fougeray, Parc des Coteaux, Local vineyards, Scenic hiking trails, Historical landmarks |
| Fougeres | A historic town famous for its medieval architecture, particularly the impressive Château de Fougères. An ideal spot for culture enthusiasts and history buffs. | Château de Fougères, Eglise Saint-Sulpice, Les jardins de la Ville close, Fougères Medieval Festival, The old town |
| Vitré | Known for its well-preserved medieval town center and historic buildings. Attracts tourists interested in history and architecture. | Château de Vitré, Place Charles de Gaulle, The Maison des Cultures du Monde, Historic old town, Church of Saint-Pierre |
| Château-Gontier | A charming town on the banks of the Mayenne River, ideal for outdoor enthusiasts and those seeking local French culture. | La Médiathèque, Saint-Florent Church, Les jardins du château, Cycling routes along the river, Local markets |
| Ernée | A small town providing a quaint atmosphere, offering a local experience with access to scenic landscapes and outdoor activities. | Church of Saint-Laurent, Local artisan shops, Nearby walking trails, Traditional French restaurants, Art exhibitions |
| Laval | A bustling town with a vibrant community, known for its cultural events and festivals, appealing to a diverse range of guests. | Laval Cathedral, Château de Laval, Museum of Art, Botanical Garden, Theatre of Laval |
| Saint-Aignan-sur-Roë | A peaceful village that offers a rural retreat with traditional French culture and picturesque views, suitable for guests seeking serenity away from urban settings. | Local farms, Rural cycling paths, Scenic viewpoints, Village festivals, Traditional local cuisine |
| Mayenne | Capital of the Mayenne department, this town combines history with modernity, providing a variety of entertainment options and cultural activities. | Château de Mayenne, Local shops and restaurants, Museum of Mayenne, Historic walking tours, The Mayenne River |
Understanding Airbnb License Requirements & STR Laws in Rives-du-Fougerais (2025)
With 21% of listings showing registration in 2025, understanding potential Airbnb license requirements is crucial in Rives-du-Fougerais. Always verify the latest short term rental regulations and Airbnb license requirements directly with local government authorities for Rives-du-Fougerais to ensure full compliance before hosting.
(Source: AirROI data, 2025, based on 21% licensed listings)
Top Performing Airbnb Properties in Rives-du-Fougerais (2025)
Benchmark your potential! Explore examples of top-performing Airbnb properties in Rives-du-Fougeraisbased on Trailing Twelve Month (TTM) revenue. Analyze their characteristics, revenue, occupancy rate, and ADR to understand what drives success in this market.
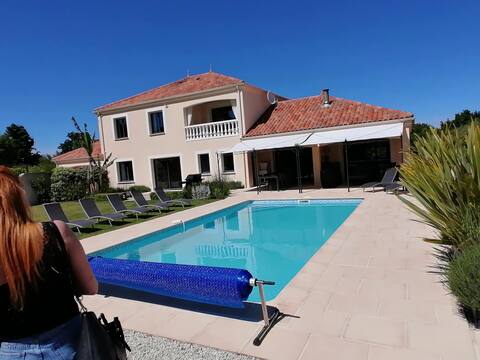
Very nice house, 14 beds.
Entire Place • 6 bedrooms
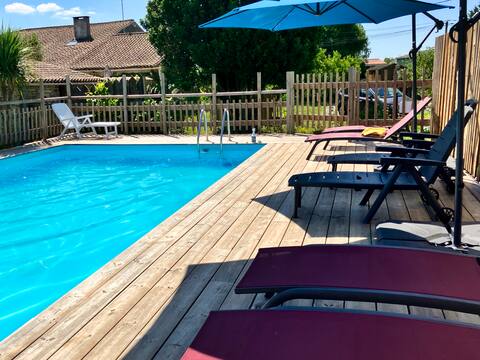
Gîte, piscine 6ch/13p - Puy du fou/Marais Poitevin
Entire Place • 6 bedrooms
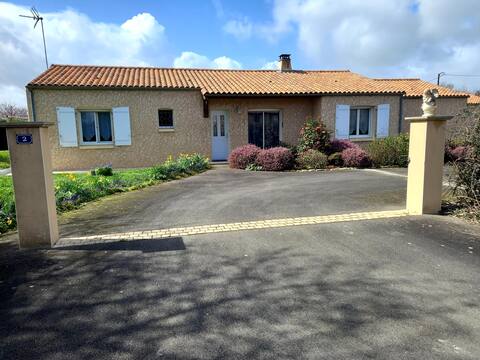
6 guests, 3 chbres, terrace
Entire Place • 3 bedrooms
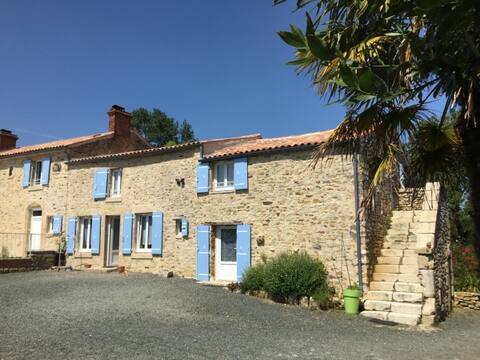
Éole, Puy du Fou, Marais Poitevin, South Vendee
Entire Place • 3 bedrooms
Gaia, Puy du Fou, Marais Poitevin, South Vendee
Entire Place • 2 bedrooms

One Night in a Medieval Castle
Private Room • N/A
Note: Performance varies based on location, size, amenities, seasonality, and management quality. Data reflects the past 12 months.
Top Performing Airbnb Hosts in Rives-du-Fougerais (2025)
Learn from the best! This table showcases top-performing Airbnb hosts in Rives-du-Fougerais based on the number of properties managed and estimated total revenue over the past year. Analyze their scale and performance metrics.
| Host Name | Properties | Grossing Revenue | Stay Reviews | Avg Rating |
|---|---|---|---|---|
| Emmanuel | 1 | $86,485 | 9 | 4.89/5.0 |
| Françoise & Hervé | 3 | $60,857 | 67 | 4.72/5.0 |
| Eric | 4 | $52,925 | 24 | 4.64/5.0 |
| Valerie | 1 | $27,140 | 30 | 4.93/5.0 |
| Laurent | 1 | $14,190 | 62 | 4.87/5.0 |
| Olivier | 1 | $9,916 | 137 | 4.72/5.0 |
| Claire | 1 | $9,629 | 12 | 4.75/5.0 |
| Inès | 1 | $8,118 | 18 | 4.83/5.0 |
| Véronique | 2 | $6,432 | 6 | 2.38/5.0 |
| Host #161100433 | 1 | $4,818 | 1 | 0.00/5.0 |
Analyzing the strategies of top hosts, such as their property selection, pricing, and guest communication, can offer valuable lessons for optimizing your own Airbnb operations in Rives-du-Fougerais.
Dive Deeper: Advanced Rives-du-Fougerais STR Market Data (2025)
Ready to unlock more insights? AirROI provides access to advanced metrics and comprehensive Airbnb data for Rives-du-Fougerais. Explore detailed analytics beyond this report to refine your investment strategy, optimize pricing, and maximize your vacation rental profits.
Explore Advanced MetricsRives-du-Fougerais Short-Term Rental Market Composition (2025): Property & Room Types
Room Type Distribution
Property Type Distribution
Market Composition Insights for Rives-du-Fougerais
- The Rives-du-Fougerais Airbnb market composition is heavily skewed towards Entire Home/Apt listings, which make up 63.2% of the 19 active rentals. This indicates strong guest preference for privacy and space.
- However, a notable 36.8% share for Private Rooms suggests opportunities for budget-conscious travelers or hosts renting out spare rooms.
- Looking at the property type distribution in Rives-du-Fougerais, House properties are the most common (73.7%), reflecting the local real estate landscape.
- Houses represent a significant 73.7% portion, catering likely to families or larger groups.
- The presence of 15.8% Hotel/Boutique listings indicates integration with traditional hospitality.
Rives-du-Fougerais Airbnb Room Capacity Analysis (2025): Bedroom Distribution
Distribution of Listings by Number of Bedrooms
Room Capacity Insights for Rives-du-Fougerais
- The dominant room capacity in Rives-du-Fougerais is 3 bedrooms listings, making up 26.3% of the market. This suggests a strong demand for properties suitable for families or small groups.
- Together, 3 bedrooms and 1 bedroom properties represent 47.4% of the active Airbnb listings in Rives-du-Fougerais, indicating a high concentration in these sizes.
- A significant 36.8% of listings offer 3+ bedrooms, catering to larger groups and families seeking more space in Rives-du-Fougerais.
Rives-du-Fougerais Vacation Rental Guest Capacity Trends (2025)
Distribution of Listings by Guest Capacity
Guest Capacity Insights for Rives-du-Fougerais
- The most common guest capacity trend in Rives-du-Fougerais vacation rentals is listings accommodating 6 guests (26.3%). This suggests the primary traveler segment is likely larger groups.
- Properties designed for 6 guests and 8+ guests dominate the Rives-du-Fougerais STR market, accounting for 42.1% of listings.
- 47.4% of properties accommodate 6+ guests, serving the market segment for larger families or group travel in Rives-du-Fougerais.
- On average, properties in Rives-du-Fougerais are equipped to host 4.3 guests.
Rives-du-Fougerais Airbnb Booking Patterns (2025): Available vs. Booked Days
Available Days Distribution
Booked Days Distribution
Booking Pattern Insights for Rives-du-Fougerais
- The most common availability pattern in Rives-du-Fougerais falls within the 271-366 days range, representing 52.6% of listings. This suggests many properties have significant open periods on their calendars.
- Approximately 94.7% of listings show high availability (181+ days open annually), indicating potential for increased bookings or specific owner usage patterns.
- For booked days, the 91-180 days range is most frequent in Rives-du-Fougerais (47.4%), reflecting common guest stay durations or potential owner blocking patterns.
- A notable 5.3% of properties secure long booking periods (181+ days booked per year), highlighting successful long-term rental strategies or significant owner usage.
Rives-du-Fougerais Airbnb Minimum Stay Requirements Analysis
Distribution of Listings by Minimum Night Requirement
1 Night
7 listings
36.8% of total
2 Nights
9 listings
47.4% of total
3 Nights
2 listings
10.5% of total
30+ Nights
1 listings
5.3% of total
Key Insights
- The most prevalent minimum stay requirement in Rives-du-Fougerais is 2 Nights, adopted by 47.4% of listings. This highlights the market's preference for shorter, flexible bookings.
- A strong majority (84.2%) of the Rives-du-Fougerais Airbnb data shows acceptance of very short stays (1-2 nights), indicating a dynamic, high-turnover market.
Recommendations
- Align with the market by considering a 2 Nights minimum stay, as 47.4% of Rives-du-Fougerais hosts use this setting.
- Explore offering discounts for stays of 30+ nights to attract the 5.3% of the market seeking extended stays.
- Adjust minimum nights based on seasonality – potentially shorter during low season and longer during peak demand periods in Rives-du-Fougerais.
Rives-du-Fougerais Airbnb Cancellation Policy Trends Analysis (2025)
Flexible
5 listings
29.4% of total
Moderate
3 listings
17.6% of total
Firm
9 listings
52.9% of total
Cancellation Policy Insights for Rives-du-Fougerais
- The prevailing Airbnb cancellation policy trend in Rives-du-Fougerais is Firm, used by 52.9% of listings.
- A majority (52.9%) of hosts in Rives-du-Fougerais utilize Firm or Strict policies, indicating a market where hosts prioritize booking security.
Recommendations for Hosts
- Consider adopting a Firm policy to align with the 52.9% market standard in Rives-du-Fougerais.
- Regularly review your cancellation policy against competitors and market demand shifts in Rives-du-Fougerais.
Rives-du-Fougerais STR Booking Lead Time Analysis (2025)
Average Booking Lead Time by Month
Booking Lead Time Insights for Rives-du-Fougerais
- The overall average booking lead time for vacation rentals in Rives-du-Fougerais is 70 days.
- Guests book furthest in advance for stays during June (average 138 days), likely coinciding with peak travel demand or local events.
- The shortest booking windows occur for stays in March (average 19 days), indicating more last-minute travel plans during this time.
- Seasonally, Summer (118 days avg.) sees the longest lead times, while Winter (36 days avg.) has the shortest, reflecting typical travel planning cycles.
Recommendations for Hosts
- Use the overall average lead time (70 days) as a baseline for your pricing and availability strategy in Rives-du-Fougerais.
- For June stays, consider implementing length-of-stay discounts or slightly higher rates for bookings made less than 138 days out to capitalize on advance planning.
- Target marketing efforts for the Summer season well in advance (at least 118 days) to capture early planners.
- Monitor your own booking lead times against these Rives-du-Fougerais averages to identify opportunities for dynamic pricing adjustments.
Popular & Essential Airbnb Amenities in Rives-du-Fougerais (2025)
Amenity Prevalence
Amenity Insights for Rives-du-Fougerais
- Popular amenities like Smoke alarm, Free parking on premises, BBQ grill are common but not universal. Offering these can provide a competitive edge.
- Warning: Wifi is not universally provided but is considered essential globally. Ensure reliable Wifi is offered.
Recommendations for Hosts
- Consider adding popular differentiators like Smoke alarm or Free parking on premises to increase appeal.
- Highlight unique or less common amenities you offer (e.g., hot tub, dedicated workspace, EV charger) in your listing description and photos.
- Regularly check competitor amenities in Rives-du-Fougerais to stay competitive.
Rives-du-Fougerais Airbnb Guest Demographics & Profile Analysis (2025)
Guest Profile Summary for Rives-du-Fougerais
- The typical guest profile for Airbnb in Rives-du-Fougerais consists of primarily domestic travelers (83%), often arriving from nearby Rennes, typically belonging to the Post-2000s (Gen Z/Alpha) group (50%), primarily speaking French or English.
- Domestic travelers account for 83.3% of guests.
- Key international markets include France (83.3%) and United Kingdom (5.6%).
- Top languages spoken are French (45.5%) followed by English (29.1%).
- A significant demographic segment is the Post-2000s (Gen Z/Alpha) group, representing 50% of guests.
Recommendations for Hosts
- Target domestic marketing efforts towards travelers from Rennes and Bordeaux.
- Tailor amenities and listing descriptions to appeal to the dominant Post-2000s (Gen Z/Alpha) demographic (e.g., highlight fast WiFi, smart home features, local guides).
- Highlight unique local experiences or amenities relevant to the primary guest profile.
- Consider seasonal promotions aligned with peak travel times for key origin markets.
Nearby Short-Term Rental Market Comparison
How does the Rives-du-Fougerais Airbnb market stack up against its neighbors? Compare key performance metrics like average monthly revenue, ADR, and occupancy rates in surrounding areas to understand the broader regional STR landscape.
| Market | Active Properties | Monthly Revenue | Daily Rate | Avg. Occupancy |
|---|---|---|---|---|
| Coteaux-sur-Loire | 19 | $3,328 | $270.00 | 41% |
| Villiers-sur-Loir | 10 | $2,967 | $216.51 | 41% |
| Artannes-sur-Indre | 21 | $2,949 | $275.91 | 41% |
| Vallon-sur-Gée | 11 | $2,913 | $379.01 | 30% |
| Bourneau | 11 | $2,747 | $442.07 | 35% |
| Nuaillé-d'Aunis | 10 | $2,741 | $373.83 | 37% |
| Ambillou | 18 | $2,701 | $370.97 | 28% |
| Le Bois-Plage-en-Ré | 303 | $2,528 | $284.63 | 45% |
| Chambellay | 11 | $2,525 | $255.24 | 34% |
| Le Grand-Pressigny | 11 | $2,511 | $266.72 | 31% |