Plessé Airbnb Market Analysis 2025: Short Term Rental Data & Vacation Rental Statistics in Pays de la Loire, France
Is Airbnb profitable in Plessé in 2025? Explore comprehensive Airbnb analytics for Plessé, Pays de la Loire, France to uncover income potential. This 2025 STR market report for Plessé, based on AirROI data from April 2024 to March 2025, reveals key trends in the niche market of 23 active listings.
Whether you're considering an Airbnb investment in Plessé, optimizing your existing vacation rental, or exploring rental arbitrage opportunities, understanding the Plessé Airbnb data is crucial. Leveraging the low regulation environment is key to maximizing your short term rental income potential. Let's dive into the specifics.
Key Plessé Airbnb Performance Metrics Overview
Monthly Airbnb Revenue Variations & Income Potential in Plessé (2025)
Understanding the monthly revenue variations for Airbnb listings in Plessé is key to maximizing your short term rental income potential. Seasonality significantly impacts earnings. Our analysis, based on data from the past 12 months, shows that the peak revenue month for STRs in Plessé is typically August, while November often presents the lowest earnings, highlighting opportunities for strategic pricing adjustments during shoulder and low seasons. Explore the typical Airbnb income in Plessé across different performance tiers:
- Best-in-class properties (Top 10%) achieve $2,298+ monthly, often utilizing dynamic pricing and superior guest experiences.
- Strong performing properties (Top 25%) earn $1,392 or more, indicating effective management and desirable locations/amenities.
- Typical properties (Median) generate around $656 per month, representing the average market performance.
- Entry-level properties (Bottom 25%) see earnings around $343, often with potential for optimization.
Average Monthly Airbnb Earnings Trend in Plessé
Plessé Airbnb Occupancy Rate Trends (2025)
Maximize your bookings by understanding the Plessé STR occupancy trends. Seasonal demand shifts significantly influence how often properties are booked. Typically, Augustsees the highest demand (peak season occupancy), while November experiences the lowest (low season). Effective strategies, like adjusting minimum stays or offering promotions, can boost occupancy during slower periods. Here's how different property tiers perform in Plessé:
- Best-in-class properties (Top 10%) achieve 63%+ occupancy, indicating high desirability and potentially optimized availability.
- Strong performing properties (Top 25%) maintain 46% or higher occupancy, suggesting good market fit and guest satisfaction.
- Typical properties (Median) have an occupancy rate around 28%.
- Entry-level properties (Bottom 25%) average 13% occupancy, potentially facing higher vacancy.
Average Monthly Occupancy Rate Trend in Plessé
Average Daily Rate (ADR) Airbnb Trends in Plessé (2025)
Effective short term rental pricing strategy in Plessé involves understanding monthly ADR fluctuations. The Average Daily Rate (ADR) for Airbnb in Plessé typically peaks in November and dips lowest during March. Leveraging Airbnb dynamic pricing tools or strategies based on this seasonality can significantly boost revenue. Here's a look at the typical nightly rates achieved:
- Best-in-class properties (Top 10%) command rates of $127+ per night, often due to premium features or locations.
- Strong performing properties (Top 25%) achieve nightly rates of $96 or more.
- Typical properties (Median) charge around $71 per night.
- Entry-level properties (Bottom 25%) earn around $59 per night.
Average Daily Rate (ADR) Trend by Month in Plessé
Get Live Plessé Market Intelligence 👇

Explore Real-time Analytics
Airbnb Seasonality Analysis & Trends in Plessé (2025)
Peak Season (August, July, June)
- Revenue averages $1,361 per month
- Occupancy rates average 46.0%
- Daily rates average $85
Shoulder Season
- Revenue averages $1,011 per month
- Occupancy maintains around 29.6%
- Daily rates hold near $85
Low Season (February, March, November)
- Revenue drops to average $617 per month
- Occupancy decreases to average 27.2%
- Daily rates adjust to average $84
Seasonality Insights for Plessé
- The Airbnb seasonality in Plessé shows highly seasonal trends requiring careful strategy. While the sections above show seasonal averages, it's also insightful to look at the extremes:
- During the high season, the absolute peak month showcases Plessé's highest earning potential, with monthly revenues capable of climbing to $1,375, occupancy reaching a high of 52.8%, and ADRs peaking at $88.
- Conversely, the slowest single month of the year, typically falling within the low season, marks the market's lowest point. In this month, revenue might dip to $520, occupancy could drop to 22.1%, and ADRs may adjust down to $83.
- Understanding both the seasonal averages and these monthly peaks and troughs in revenue, occupancy, and ADR is crucial for maximizing your Airbnb profit potential in Plessé.
Seasonal Strategies for Maximizing Profit
- Peak Season: Maximize revenue through premium pricing and potentially longer minimum stays. Ensure high availability.
- Low Season: Offer competitive pricing, special promotions (e.g., extended stay discounts), and flexible cancellation policies. Target off-season travelers like remote workers or budget-conscious guests.
- Shoulder Seasons: Implement dynamic pricing that balances peak and low rates. Target weekend travelers or specific events. Offer slightly more flexible terms than peak season.
- Regularly analyze your own performance against these Plessé seasonality benchmarks and adjust your pricing and availability strategy accordingly.
Best Areas for Airbnb Investment in Plessé (2025)
Exploring the top neighborhoods for short-term rentals in Plessé? This section highlights key areas, outlining why they are attractive for hosts and guests, along with notable local attractions. Consider these locations based on your target guest profile and investment strategy.
| Neighborhood / Area | Why Host Here? (Target Guests & Appeal) | Key Attractions & Landmarks |
|---|---|---|
| Plessé Centre | The heart of Plessé, providing local amenities such as shops and restaurants, making it a convenient spot for visitors. | Local markets, Church of St. Joseph, Nearby cycling paths, Café de la Gare |
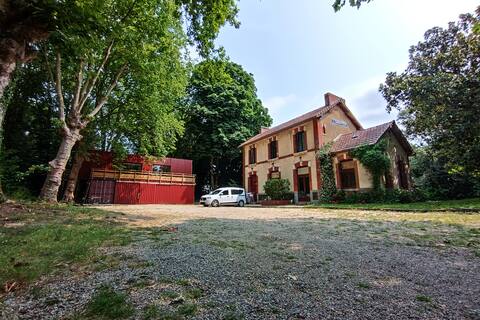
| Chateau de Plessé | A historic site with beautiful grounds, attracting history buffs and nature lovers who wish to explore the area and enjoy outdoor activities. | Chateau grounds, Cultural tours, Walking trails, Picnic areas |
| Guémené-Penfao | Adjacent to Plessé, this area offers fresh air and countryside charm, popular with those seeking a rural retreat. | Scenic countryside, Local wildlife, Rural cycling routes |
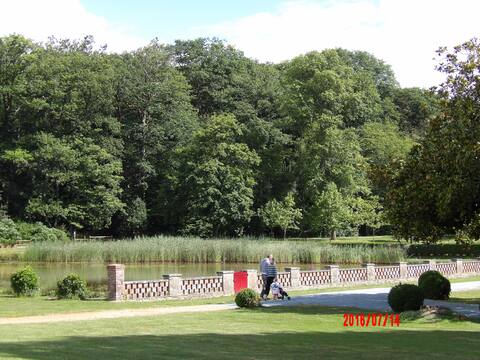
| Les étangs de Plessé | Known for its peaceful lakes, it’s perfect for those looking for relaxation and nature experiences, ideal for fishing and boating enthusiasts. | Fishing spots, Boating activities, Picnic areas, Nature trails |
| Nantes Day Trips | Nearby Nantes is a vibrant city with rich cultural offerings, making it easy for guests to explore while enjoying the tranquility of Plessé. | Castle of the Dukes of Brittany, Les Machines de l'île, Nantes Cathedral, Local markets |
| Cesson | Just a short drive from Plessé, Cesson has a growing community with shops and access to the Loire, catering to visitors wanting a blend of city and nature. | Local parks, Riverside walks, Café culture |
| Lake Vioreau | An ideal getaway spot with recreational water activities, attracting families and outdoor enthusiasts looking for adventure. | Swimming, Sailing, Picnic areas, Hiking trails |
| Historical Sites of the Loire | This area offers easy access to various historical and cultural sites along the Loire, ideal for cultural tourism. | Château de Rieux, Local vineyards, Ancient churches, Cultural festivals |
Understanding Airbnb License Requirements & STR Laws in Plessé (2025)
While Plessé, Pays de la Loire, France currently shows low STR regulations, specific Airbnb license requirements might still exist or change. Always verify the latest short term rental regulations and Airbnb license requirements directly with local government authorities for Plessé to ensure full compliance before hosting.
(Source: AirROI data, 2025, based on 4% licensed listings)
Top Performing Airbnb Properties in Plessé (2025)
Benchmark your potential! Explore examples of top-performing Airbnb properties in Plessébased on Trailing Twelve Month (TTM) revenue. Analyze their characteristics, revenue, occupancy rate, and ADR to understand what drives success in this market.
Gîtes de la Gare: Studio & Containers
Entire Place • 3 bedrooms
Home near Canal
Entire Place • 3 bedrooms
Country house in private forest estate
Entire Place • 3 bedrooms
Maison de campagne
Entire Place • 3 bedrooms

Gites de la Gare: Les containers
Entire Place • 2 bedrooms
Bed and breakfast on Mona Farm
Private Room • N/A
Note: Performance varies based on location, size, amenities, seasonality, and management quality. Data reflects the past 12 months.
Top Performing Airbnb Hosts in Plessé (2025)
Learn from the best! This table showcases top-performing Airbnb hosts in Plessé based on the number of properties managed and estimated total revenue over the past year. Analyze their scale and performance metrics.
| Host Name | Properties | Grossing Revenue | Stay Reviews | Avg Rating |
|---|---|---|---|---|
| Tristan | 3 | $58,180 | 142 | 4.93/5.0 |
| Anne | 1 | $22,552 | 8 | 5.00/5.0 |
| Marie | 2 | $21,550 | 47 | 4.94/5.0 |
| Yvane | 1 | $16,194 | 49 | 4.86/5.0 |
| Host #448454738 | 1 | $14,967 | 6 | 4.83/5.0 |
| Danielle | 1 | $11,619 | 213 | 4.85/5.0 |
| Hervé | 1 | $9,449 | 44 | 4.80/5.0 |
| Julie | 3 | $7,843 | 23 | 4.96/5.0 |
| Julien | 1 | $6,871 | 17 | 4.94/5.0 |
| Sophie | 1 | $6,646 | 47 | 4.91/5.0 |
Analyzing the strategies of top hosts, such as their property selection, pricing, and guest communication, can offer valuable lessons for optimizing your own Airbnb operations in Plessé.
Dive Deeper: Advanced Plessé STR Market Data (2025)
Ready to unlock more insights? AirROI provides access to advanced metrics and comprehensive Airbnb data for Plessé. Explore detailed analytics beyond this report to refine your investment strategy, optimize pricing, and maximize your vacation rental profits.
Explore Advanced MetricsPlessé Short-Term Rental Market Composition (2025): Property & Room Types
Room Type Distribution
Property Type Distribution
Market Composition Insights for Plessé
- The Plessé Airbnb market composition is heavily skewed towards Entire Home/Apt listings, which make up 78.3% of the 23 active rentals. This indicates strong guest preference for privacy and space.
- Looking at the property type distribution in Plessé, House properties are the most common (47.8%), reflecting the local real estate landscape.
- Houses represent a significant 47.8% portion, catering likely to families or larger groups.
- The presence of 21.7% Hotel/Boutique listings indicates integration with traditional hospitality.
- Smaller segments like outdoor/unique, apartment/condo (combined 8.6%) offer potential for unique stay experiences.
Plessé Airbnb Room Capacity Analysis (2025): Bedroom Distribution
Distribution of Listings by Number of Bedrooms
Room Capacity Insights for Plessé
- The dominant room capacity in Plessé is 2 bedrooms listings, making up 26.1% of the market. This suggests a strong demand for properties suitable for couples or solo travelers.
- Together, 2 bedrooms and 1 bedroom properties represent 52.2% of the active Airbnb listings in Plessé, indicating a high concentration in these sizes.
- A significant 30.4% of listings offer 3+ bedrooms, catering to larger groups and families seeking more space in Plessé.
Plessé Vacation Rental Guest Capacity Trends (2025)
Distribution of Listings by Guest Capacity
Guest Capacity Insights for Plessé
- The most common guest capacity trend in Plessé vacation rentals is listings accommodating 2 guests (26.1%). This suggests the primary traveler segment is likely couples or solo travelers.
- Properties designed for 2 guests and 6 guests dominate the Plessé STR market, accounting for 47.8% of listings.
- 34.7% of properties accommodate 6+ guests, serving the market segment for larger families or group travel in Plessé.
- On average, properties in Plessé are equipped to host 4.0 guests.
Plessé Airbnb Booking Patterns (2025): Available vs. Booked Days
Available Days Distribution
Booked Days Distribution
Booking Pattern Insights for Plessé
- The most common availability pattern in Plessé falls within the 181-270 days range, representing 47.8% of listings. This suggests many properties have significant open periods on their calendars.
- Approximately 91.3% of listings show high availability (181+ days open annually), indicating potential for increased bookings or specific owner usage patterns.
- For booked days, the 91-180 days range is most frequent in Plessé (47.8%), reflecting common guest stay durations or potential owner blocking patterns.
- A notable 8.7% of properties secure long booking periods (181+ days booked per year), highlighting successful long-term rental strategies or significant owner usage.
Plessé Airbnb Minimum Stay Requirements Analysis
Distribution of Listings by Minimum Night Requirement
1 Night
7 listings
33.3% of total
2 Nights
6 listings
28.6% of total
3 Nights
2 listings
9.5% of total
4-6 Nights
1 listings
4.8% of total
30+ Nights
5 listings
23.8% of total
Key Insights
- The most prevalent minimum stay requirement in Plessé is 1 Night, adopted by 33.3% of listings. This highlights the market's preference for shorter, flexible bookings.
- A strong majority (61.9%) of the Plessé Airbnb data shows acceptance of very short stays (1-2 nights), indicating a dynamic, high-turnover market.
- A significant segment (23.8%) caters to monthly stays (30+ nights) in Plessé, pointing to opportunities in the extended-stay market.
Recommendations
- Align with the market by considering a 1 Night minimum stay, as 33.3% of Plessé hosts use this setting.
- Explore offering discounts for stays of 30+ nights to attract the 23.8% of the market seeking extended stays.
- Adjust minimum nights based on seasonality – potentially shorter during low season and longer during peak demand periods in Plessé.
Plessé Airbnb Cancellation Policy Trends Analysis (2025)
Flexible
7 listings
35% of total
Moderate
5 listings
25% of total
Firm
6 listings
30% of total
Strict
2 listings
10% of total
Cancellation Policy Insights for Plessé
- The prevailing Airbnb cancellation policy trend in Plessé is Flexible, used by 35% of listings.
- There's a relatively balanced mix between guest-friendly (60.0%) and stricter (40.0%) policies, offering choices for different guest needs.
Recommendations for Hosts
- Consider adopting a Flexible policy to align with the 35% market standard in Plessé.
- Using a Strict policy might deter some guests, as only 10% of listings use it. Evaluate if potential revenue protection outweighs possible lower booking rates.
- Regularly review your cancellation policy against competitors and market demand shifts in Plessé.
Plessé STR Booking Lead Time Analysis (2025)
Average Booking Lead Time by Month
Booking Lead Time Insights for Plessé
- The overall average booking lead time for vacation rentals in Plessé is 32 days.
- Guests book furthest in advance for stays during August (average 76 days), likely coinciding with peak travel demand or local events.
- The shortest booking windows occur for stays in November (average 20 days), indicating more last-minute travel plans during this time.
- Seasonally, Summer (67 days avg.) sees the longest lead times, while Winter (23 days avg.) has the shortest, reflecting typical travel planning cycles.
Recommendations for Hosts
- Use the overall average lead time (32 days) as a baseline for your pricing and availability strategy in Plessé.
- For August stays, consider implementing length-of-stay discounts or slightly higher rates for bookings made less than 76 days out to capitalize on advance planning.
- Target marketing efforts for the Summer season well in advance (at least 67 days) to capture early planners.
- Monitor your own booking lead times against these Plessé averages to identify opportunities for dynamic pricing adjustments.
Popular & Essential Airbnb Amenities in Plessé (2025)
Amenity Prevalence
Amenity Insights for Plessé
- Essential amenities in Plessé that guests expect include: Free parking on premises, Smoke alarm, Hot water, Kitchen. Lacking these (any) could significantly impact bookings.
- Popular amenities like Refrigerator, Dishes and silverware, Heating are common but not universal. Offering these can provide a competitive edge.
Recommendations for Hosts
- Ensure your listing includes all essential amenities for Plessé: Free parking on premises, Smoke alarm, Hot water, Kitchen.
- Prioritize adding missing essentials: Smoke alarm, Hot water, Kitchen.
- Consider adding popular differentiators like Refrigerator or Dishes and silverware to increase appeal.
- Highlight unique or less common amenities you offer (e.g., hot tub, dedicated workspace, EV charger) in your listing description and photos.
- Regularly check competitor amenities in Plessé to stay competitive.
Plessé Airbnb Guest Demographics & Profile Analysis (2025)
Guest Profile Summary for Plessé
- The typical guest profile for Airbnb in Plessé consists of primarily domestic travelers (86%), often arriving from nearby Nantes, typically belonging to the Post-2000s (Gen Z/Alpha) group (50%), primarily speaking French or English.
- Domestic travelers account for 85.7% of guests.
- Key international markets include France (85.7%) and United Kingdom (3.9%).
- Top languages spoken are French (46%) followed by English (32.1%).
- A significant demographic segment is the Post-2000s (Gen Z/Alpha) group, representing 50% of guests.
Recommendations for Hosts
- Target domestic marketing efforts towards travelers from Nantes and Le Havre.
- Tailor amenities and listing descriptions to appeal to the dominant Post-2000s (Gen Z/Alpha) demographic (e.g., highlight fast WiFi, smart home features, local guides).
- Highlight unique local experiences or amenities relevant to the primary guest profile.
- Consider seasonal promotions aligned with peak travel times for key origin markets.
Nearby Short-Term Rental Market Comparison
How does the Plessé Airbnb market stack up against its neighbors? Compare key performance metrics like average monthly revenue, ADR, and occupancy rates in surrounding areas to understand the broader regional STR landscape.
| Market | Active Properties | Monthly Revenue | Daily Rate | Avg. Occupancy |
|---|---|---|---|---|
| Moulins-le-Carbonnel | 11 | $3,213 | $320.85 | 35% |
| Vallon-sur-Gée | 11 | $2,913 | $379.01 | 30% |
| Bourneau | 11 | $2,747 | $442.07 | 35% |
| Nuaillé-d'Aunis | 10 | $2,741 | $373.83 | 37% |
| Le Bois-Plage-en-Ré | 303 | $2,528 | $284.63 | 45% |
| Chambellay | 11 | $2,525 | $255.24 | 34% |
| Sainte-Florence | 10 | $2,445 | $233.78 | 46% |
| La Flotte | 396 | $2,382 | $236.53 | 46% |
| Forges | 11 | $2,314 | $220.63 | 39% |
| Dœuil-sur-le-Mignon | 12 | $2,283 | $481.91 | 21% |