Le Poiré-sur-Vie Airbnb Market Analysis 2025: Short Term Rental Data & Vacation Rental Statistics in Pays de la Loire, France
Is Airbnb profitable in Le Poiré-sur-Vie in 2025? Explore comprehensive Airbnb analytics for Le Poiré-sur-Vie, Pays de la Loire, France to uncover income potential. This 2025 STR market report for Le Poiré-sur-Vie, based on AirROI data from April 2024 to March 2025, reveals key trends in the niche market of 35 active listings.
Whether you're considering an Airbnb investment in Le Poiré-sur-Vie, optimizing your existing vacation rental, or exploring rental arbitrage opportunities, understanding the Le Poiré-sur-Vie Airbnb data is crucial. Leveraging the low regulation environment is key to maximizing your short term rental income potential. Let's dive into the specifics.
Key Le Poiré-sur-Vie Airbnb Performance Metrics Overview
Monthly Airbnb Revenue Variations & Income Potential in Le Poiré-sur-Vie (2025)
Understanding the monthly revenue variations for Airbnb listings in Le Poiré-sur-Vie is key to maximizing your short term rental income potential. Seasonality significantly impacts earnings. Our analysis, based on data from the past 12 months, shows that the peak revenue month for STRs in Le Poiré-sur-Vie is typically August, while February often presents the lowest earnings, highlighting opportunities for strategic pricing adjustments during shoulder and low seasons. Explore the typical Airbnb income in Le Poiré-sur-Vie across different performance tiers:
- Best-in-class properties (Top 10%) achieve $4,176+ monthly, often utilizing dynamic pricing and superior guest experiences.
- Strong performing properties (Top 25%) earn $2,159 or more, indicating effective management and desirable locations/amenities.
- Typical properties (Median) generate around $994 per month, representing the average market performance.
- Entry-level properties (Bottom 25%) see earnings around $547, often with potential for optimization.
Average Monthly Airbnb Earnings Trend in Le Poiré-sur-Vie
Le Poiré-sur-Vie Airbnb Occupancy Rate Trends (2025)
Maximize your bookings by understanding the Le Poiré-sur-Vie STR occupancy trends. Seasonal demand shifts significantly influence how often properties are booked. Typically, Augustsees the highest demand (peak season occupancy), while March experiences the lowest (low season). Effective strategies, like adjusting minimum stays or offering promotions, can boost occupancy during slower periods. Here's how different property tiers perform in Le Poiré-sur-Vie:
- Best-in-class properties (Top 10%) achieve 69%+ occupancy, indicating high desirability and potentially optimized availability.
- Strong performing properties (Top 25%) maintain 52% or higher occupancy, suggesting good market fit and guest satisfaction.
- Typical properties (Median) have an occupancy rate around 32%.
- Entry-level properties (Bottom 25%) average 17% occupancy, potentially facing higher vacancy.
Average Monthly Occupancy Rate Trend in Le Poiré-sur-Vie
Average Daily Rate (ADR) Airbnb Trends in Le Poiré-sur-Vie (2025)
Effective short term rental pricing strategy in Le Poiré-sur-Vie involves understanding monthly ADR fluctuations. The Average Daily Rate (ADR) for Airbnb in Le Poiré-sur-Vie typically peaks in August and dips lowest during March. Leveraging Airbnb dynamic pricing tools or strategies based on this seasonality can significantly boost revenue. Here's a look at the typical nightly rates achieved:
- Best-in-class properties (Top 10%) command rates of $275+ per night, often due to premium features or locations.
- Strong performing properties (Top 25%) achieve nightly rates of $140 or more.
- Typical properties (Median) charge around $95 per night.
- Entry-level properties (Bottom 25%) earn around $57 per night.
Average Daily Rate (ADR) Trend by Month in Le Poiré-sur-Vie
Get Live Le Poiré-sur-Vie Market Intelligence 👇

Explore Real-time Analytics
Airbnb Seasonality Analysis & Trends in Le Poiré-sur-Vie (2025)
Peak Season (August, July, June)
- Revenue averages $2,826 per month
- Occupancy rates average 45.3%
- Daily rates average $157
Shoulder Season
- Revenue averages $1,752 per month
- Occupancy maintains around 34.9%
- Daily rates hold near $144
Low Season (January, February, March)
- Revenue drops to average $1,056 per month
- Occupancy decreases to average 27.1%
- Daily rates adjust to average $127
Seasonality Insights for Le Poiré-sur-Vie
- The Airbnb seasonality in Le Poiré-sur-Vie shows highly seasonal trends requiring careful strategy. While the sections above show seasonal averages, it's also insightful to look at the extremes:
- During the high season, the absolute peak month showcases Le Poiré-sur-Vie's highest earning potential, with monthly revenues capable of climbing to $3,493, occupancy reaching a high of 57.7%, and ADRs peaking at $164.
- Conversely, the slowest single month of the year, typically falling within the low season, marks the market's lowest point. In this month, revenue might dip to $869, occupancy could drop to 25.8%, and ADRs may adjust down to $126.
- Understanding both the seasonal averages and these monthly peaks and troughs in revenue, occupancy, and ADR is crucial for maximizing your Airbnb profit potential in Le Poiré-sur-Vie.
Seasonal Strategies for Maximizing Profit
- Peak Season: Maximize revenue through premium pricing and potentially longer minimum stays. Ensure high availability.
- Low Season: Offer competitive pricing, special promotions (e.g., extended stay discounts), and flexible cancellation policies. Target off-season travelers like remote workers or budget-conscious guests.
- Shoulder Seasons: Implement dynamic pricing that balances peak and low rates. Target weekend travelers or specific events. Offer slightly more flexible terms than peak season.
- Regularly analyze your own performance against these Le Poiré-sur-Vie seasonality benchmarks and adjust your pricing and availability strategy accordingly.
Best Areas for Airbnb Investment in Le Poiré-sur-Vie (2025)
Exploring the top neighborhoods for short-term rentals in Le Poiré-sur-Vie? This section highlights key areas, outlining why they are attractive for hosts and guests, along with notable local attractions. Consider these locations based on your target guest profile and investment strategy.
| Neighborhood / Area | Why Host Here? (Target Guests & Appeal) | Key Attractions & Landmarks |
|---|---|---|
| Le Poiré-sur-Vie Center | The central area of Le Poiré-sur-Vie is convenient for guests accessing local shops, restaurants, and services. It's a vibrant spot that makes it easy for visitors to explore the town. | Church of Saint-Pierre, Parc de la Basse Vie, Local markets |
| Nearby Coastline | Just a short drive from the coast, this area provides access to beautiful beaches like Les Sables-d'Olonne, attracting guests looking for beach vacations and coastal activities. | Les Sables-d'Olonne Beach, Aquarium, Marinas, Coastal cycling paths |
| Vendee History | Vendee is rich in history, and this area provides a chance for guests to explore historical sites and learn about the region's heritage, appealing to history enthusiasts. | Historic towns of Vendée, Castle of Talmont, Museums |
| Nature Retreats | Surrounded by nature, this area offers tranquility and is perfect for guests looking for a peaceful retreat with opportunities for hiking and exploring the outdoors. | Vendee nature parks, Biodiversity trails, Lakes and rivers |
| Family-Friendly | This area offers family-friendly accommodations and activities, perfect for travelers with children looking for a comfortable and enjoyable stay. | Local amusement parks, Zoos, Family-friendly restaurants |
| Wine and Dine | The region is known for its wine and culinary experiences, attracting foodies and wine lovers looking to savor local flavors and visit vineyards. | Local vineyards, Wine tasting tours, Gourmet restaurants |
| Cycling Routes | The area has numerous cycling routes that attract cycling enthusiasts, providing access to scenic rides and organized cycling events. | Vendee cycling routes, Bike rental places, Cycling events |
| Cultural Events | Le Poiré-sur-Vie hosts various cultural events throughout the year, making it a lively destination for visitors interested in local traditions and festivities. | Local festivals, Art exhibitions, Music concerts |
Understanding Airbnb License Requirements & STR Laws in Le Poiré-sur-Vie (2025)
While Le Poiré-sur-Vie, Pays de la Loire, France currently shows low STR regulations, specific Airbnb license requirements might still exist or change. Always verify the latest short term rental regulations and Airbnb license requirements directly with local government authorities for Le Poiré-sur-Vie to ensure full compliance before hosting.
(Source: AirROI data, 2025, finding no licensed listings among those analyzed)
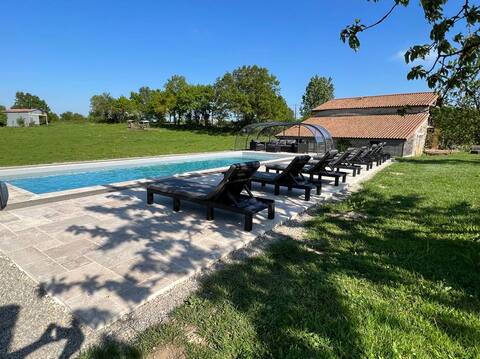
Top Performing Airbnb Properties in Le Poiré-sur-Vie (2025)
Benchmark your potential! Explore examples of top-performing Airbnb properties in Le Poiré-sur-Viebased on Trailing Twelve Month (TTM) revenue. Analyze their characteristics, revenue, occupancy rate, and ADR to understand what drives success in this market.

Beautiful country cottage with heated pool 28°
Entire Place • 6 bedrooms
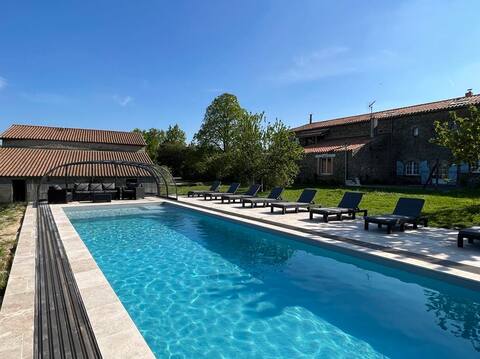
"Grange & Logis" - Pool & spa - @la_milliere
Entire Place • 9 bedrooms

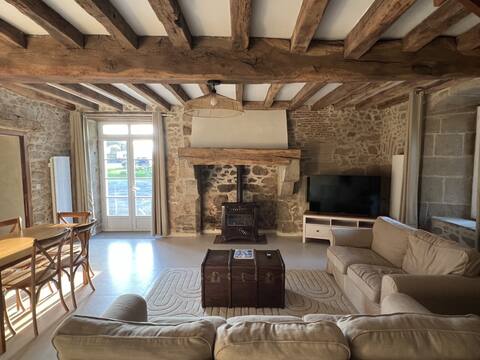
12/14 person cottage with Spa and Sauna in Vendee
Entire Place • 5 bedrooms

"Céleste" - Pool, spa & countryside - @la_milliere
Entire Place • 1 bedroom
"La Grange"- Pool, hot tub, countryside - @la_milliere
Entire Place • 4 bedrooms
"Bonchamps" - Pool & Countryside - @la_milliere
Entire Place • 3 bedrooms
Note: Performance varies based on location, size, amenities, seasonality, and management quality. Data reflects the past 12 months.
Top Performing Airbnb Hosts in Le Poiré-sur-Vie (2025)
Learn from the best! This table showcases top-performing Airbnb hosts in Le Poiré-sur-Vie based on the number of properties managed and estimated total revenue over the past year. Analyze their scale and performance metrics.
| Host Name | Properties | Grossing Revenue | Stay Reviews | Avg Rating |
|---|---|---|---|---|
| Mélaine | 9 | $256,667 | 180 | 4.83/5.0 |
| Landry | 1 | $83,318 | 51 | 4.94/5.0 |
| Mehdi | 1 | $62,530 | 83 | 4.98/5.0 |
| Pimaje | 3 | $36,469 | 18 | 4.86/5.0 |
| Marie-Michelle & Philippe | 1 | $25,990 | 100 | 4.94/5.0 |
| Laurence | 3 | $22,928 | 64 | 3.19/5.0 |
| Lionel | 2 | $19,923 | 326 | 4.80/5.0 |
| Marie | 1 | $19,786 | 28 | 4.86/5.0 |
| Angelique | 3 | $18,393 | 3 | 1.67/5.0 |
| Loren | 1 | $15,683 | 80 | 4.99/5.0 |
Analyzing the strategies of top hosts, such as their property selection, pricing, and guest communication, can offer valuable lessons for optimizing your own Airbnb operations in Le Poiré-sur-Vie.
Dive Deeper: Advanced Le Poiré-sur-Vie STR Market Data (2025)
Ready to unlock more insights? AirROI provides access to advanced metrics and comprehensive Airbnb data for Le Poiré-sur-Vie. Explore detailed analytics beyond this report to refine your investment strategy, optimize pricing, and maximize your vacation rental profits.
Explore Advanced MetricsLe Poiré-sur-Vie Short-Term Rental Market Composition (2025): Property & Room Types
Room Type Distribution
Property Type Distribution
Market Composition Insights for Le Poiré-sur-Vie
- The Le Poiré-sur-Vie Airbnb market composition is heavily skewed towards Entire Home/Apt listings, which make up 71.4% of the 35 active rentals. This indicates strong guest preference for privacy and space.
- Looking at the property type distribution in Le Poiré-sur-Vie, House properties are the most common (62.9%), reflecting the local real estate landscape.
- Houses represent a significant 62.9% portion, catering likely to families or larger groups.
- The presence of 20% Hotel/Boutique listings indicates integration with traditional hospitality.
- Smaller segments like others (combined 2.9%) offer potential for unique stay experiences.
Le Poiré-sur-Vie Airbnb Room Capacity Analysis (2025): Bedroom Distribution
Distribution of Listings by Number of Bedrooms
Room Capacity Insights for Le Poiré-sur-Vie
- The dominant room capacity in Le Poiré-sur-Vie is 2 bedrooms listings, making up 25.7% of the market. This suggests a strong demand for properties suitable for couples or solo travelers.
- Together, 2 bedrooms and 1 bedroom properties represent 45.7% of the active Airbnb listings in Le Poiré-sur-Vie, indicating a high concentration in these sizes.
- A significant 22.9% of listings offer 3+ bedrooms, catering to larger groups and families seeking more space in Le Poiré-sur-Vie.
Le Poiré-sur-Vie Vacation Rental Guest Capacity Trends (2025)
Distribution of Listings by Guest Capacity
Guest Capacity Insights for Le Poiré-sur-Vie
- The most common guest capacity trend in Le Poiré-sur-Vie vacation rentals is listings accommodating 2 guests (25.7%). This suggests the primary traveler segment is likely couples or solo travelers.
- Properties designed for 2 guests and 4 guests dominate the Le Poiré-sur-Vie STR market, accounting for 45.7% of listings.
- 25.7% of properties accommodate 6+ guests, serving the market segment for larger families or group travel in Le Poiré-sur-Vie.
- On average, properties in Le Poiré-sur-Vie are equipped to host 3.7 guests.
Le Poiré-sur-Vie Airbnb Booking Patterns (2025): Available vs. Booked Days
Available Days Distribution
Booked Days Distribution
Booking Pattern Insights for Le Poiré-sur-Vie
- The most common availability pattern in Le Poiré-sur-Vie falls within the 271-366 days range, representing 42.9% of listings. This suggests many properties have significant open periods on their calendars.
- Approximately 85.8% of listings show high availability (181+ days open annually), indicating potential for increased bookings or specific owner usage patterns.
- For booked days, the 91-180 days range is most frequent in Le Poiré-sur-Vie (40%), reflecting common guest stay durations or potential owner blocking patterns.
- A notable 17.2% of properties secure long booking periods (181+ days booked per year), highlighting successful long-term rental strategies or significant owner usage.
Le Poiré-sur-Vie Airbnb Minimum Stay Requirements Analysis
Distribution of Listings by Minimum Night Requirement
1 Night
17 listings
50% of total
2 Nights
11 listings
32.4% of total
3 Nights
2 listings
5.9% of total
4-6 Nights
1 listings
2.9% of total
7-29 Nights
2 listings
5.9% of total
30+ Nights
1 listings
2.9% of total
Key Insights
- The most prevalent minimum stay requirement in Le Poiré-sur-Vie is 1 Night, adopted by 50% of listings. This highlights the market's preference for shorter, flexible bookings.
- A strong majority (82.4%) of the Le Poiré-sur-Vie Airbnb data shows acceptance of very short stays (1-2 nights), indicating a dynamic, high-turnover market.
- Dedicated monthly rentals (30+ nights) represent a small niche (2.9%), possibly an untapped area for hosts.
Recommendations
- Align with the market by considering a 1 Night minimum stay, as 50% of Le Poiré-sur-Vie hosts use this setting.
- Adjust minimum nights based on seasonality – potentially shorter during low season and longer during peak demand periods in Le Poiré-sur-Vie.
Le Poiré-sur-Vie Airbnb Cancellation Policy Trends Analysis (2025)
Flexible
5 listings
17.2% of total
Moderate
19 listings
65.5% of total
Firm
4 listings
13.8% of total
Strict
1 listings
3.4% of total
Cancellation Policy Insights for Le Poiré-sur-Vie
- The prevailing Airbnb cancellation policy trend in Le Poiré-sur-Vie is Moderate, used by 65.5% of listings.
- The market strongly favors guest-friendly terms, with 82.7% of listings offering Flexible or Moderate policies. This suggests guests in Le Poiré-sur-Vie may expect booking flexibility.
- Strict cancellation policies are quite rare (3.4%), potentially making listings with this policy less competitive unless justified by high demand or property type.
Recommendations for Hosts
- Consider adopting a Moderate policy to align with the 65.5% market standard in Le Poiré-sur-Vie.
- Using a Strict policy might deter some guests, as only 3.4% of listings use it. Evaluate if potential revenue protection outweighs possible lower booking rates.
- Regularly review your cancellation policy against competitors and market demand shifts in Le Poiré-sur-Vie.
Le Poiré-sur-Vie STR Booking Lead Time Analysis (2025)
Average Booking Lead Time by Month
Booking Lead Time Insights for Le Poiré-sur-Vie
- The overall average booking lead time for vacation rentals in Le Poiré-sur-Vie is 49 days.
- Guests book furthest in advance for stays during May (average 123 days), likely coinciding with peak travel demand or local events.
- The shortest booking windows occur for stays in February (average 36 days), indicating more last-minute travel plans during this time.
- Seasonally, Spring (80 days avg.) sees the longest lead times, while Winter (43 days avg.) has the shortest, reflecting typical travel planning cycles.
Recommendations for Hosts
- Use the overall average lead time (49 days) as a baseline for your pricing and availability strategy in Le Poiré-sur-Vie.
- For May stays, consider implementing length-of-stay discounts or slightly higher rates for bookings made less than 123 days out to capitalize on advance planning.
- Target marketing efforts for the Spring season well in advance (at least 80 days) to capture early planners.
- Monitor your own booking lead times against these Le Poiré-sur-Vie averages to identify opportunities for dynamic pricing adjustments.
Popular & Essential Airbnb Amenities in Le Poiré-sur-Vie (2025)
Amenity Prevalence
Amenity Insights for Le Poiré-sur-Vie
- Essential amenities in Le Poiré-sur-Vie that guests expect include: Wifi, TV, Heating, Free parking on premises. Lacking these (any) could significantly impact bookings.
- Popular amenities like Hangers, Hot water, Kitchen are common but not universal. Offering these can provide a competitive edge.
Recommendations for Hosts
- Ensure your listing includes all essential amenities for Le Poiré-sur-Vie: Wifi, TV, Heating, Free parking on premises.
- Consider adding popular differentiators like Hangers or Hot water to increase appeal.
- Highlight unique or less common amenities you offer (e.g., hot tub, dedicated workspace, EV charger) in your listing description and photos.
- Regularly check competitor amenities in Le Poiré-sur-Vie to stay competitive.
Le Poiré-sur-Vie Airbnb Guest Demographics & Profile Analysis (2025)
Guest Profile Summary for Le Poiré-sur-Vie
- The typical guest profile for Airbnb in Le Poiré-sur-Vie consists of primarily domestic travelers (93%), often arriving from nearby Paris, typically belonging to the Post-2000s (Gen Z/Alpha) group (50%), primarily speaking French or English.
- Domestic travelers account for 93.4% of guests.
- Key international markets include France (93.4%) and United Kingdom (2.6%).
- Top languages spoken are French (50.3%) followed by English (27.9%).
- A significant demographic segment is the Post-2000s (Gen Z/Alpha) group, representing 50% of guests.
Recommendations for Hosts
- Target domestic marketing efforts towards travelers from Paris and Nantes.
- Tailor amenities and listing descriptions to appeal to the dominant Post-2000s (Gen Z/Alpha) demographic (e.g., highlight fast WiFi, smart home features, local guides).
- Highlight unique local experiences or amenities relevant to the primary guest profile.
- Consider seasonal promotions aligned with peak travel times for key origin markets.
Nearby Short-Term Rental Market Comparison
How does the Le Poiré-sur-Vie Airbnb market stack up against its neighbors? Compare key performance metrics like average monthly revenue, ADR, and occupancy rates in surrounding areas to understand the broader regional STR landscape.
| Market | Active Properties | Monthly Revenue | Daily Rate | Avg. Occupancy |
|---|---|---|---|---|
| Vallon-sur-Gée | 11 | $2,913 | $379.01 | 30% |
| Bourneau | 11 | $2,747 | $442.07 | 35% |
| Nuaillé-d'Aunis | 10 | $2,741 | $373.83 | 37% |
| Le Bois-Plage-en-Ré | 303 | $2,528 | $284.63 | 45% |
| Chambellay | 11 | $2,525 | $255.24 | 34% |
| Sainte-Florence | 10 | $2,445 | $233.78 | 46% |
| Saint-Hippolyte | 10 | $2,443 | $204.98 | 44% |
| Abzac | 12 | $2,415 | $349.03 | 36% |
| La Flotte | 396 | $2,382 | $236.53 | 46% |
| Saint-Georges-des-Coteaux | 12 | $2,335 | $187.61 | 43% |