Le Bernard Airbnb Market Analysis 2025: Short Term Rental Data & Vacation Rental Statistics in Pays de la Loire, France
Is Airbnb profitable in Le Bernard in 2025? Explore comprehensive Airbnb analytics for Le Bernard, Pays de la Loire, France to uncover income potential. This 2025 STR market report for Le Bernard, based on AirROI data from April 2024 to March 2025, reveals key trends in the niche market of 42 active listings.
Whether you're considering an Airbnb investment in Le Bernard, optimizing your existing vacation rental, or exploring rental arbitrage opportunities, understanding the Le Bernard Airbnb data is crucial. Leveraging the low regulation environment is key to maximizing your short term rental income potential. Let's dive into the specifics.
Key Le Bernard Airbnb Performance Metrics Overview
Monthly Airbnb Revenue Variations & Income Potential in Le Bernard (2025)
Understanding the monthly revenue variations for Airbnb listings in Le Bernard is key to maximizing your short term rental income potential. Seasonality significantly impacts earnings. Our analysis, based on data from the past 12 months, shows that the peak revenue month for STRs in Le Bernard is typically August, while March often presents the lowest earnings, highlighting opportunities for strategic pricing adjustments during shoulder and low seasons. Explore the typical Airbnb income in Le Bernard across different performance tiers:
- Best-in-class properties (Top 10%) achieve $3,312+ monthly, often utilizing dynamic pricing and superior guest experiences.
- Strong performing properties (Top 25%) earn $1,863 or more, indicating effective management and desirable locations/amenities.
- Typical properties (Median) generate around $1,093 per month, representing the average market performance.
- Entry-level properties (Bottom 25%) see earnings around $541, often with potential for optimization.
Average Monthly Airbnb Earnings Trend in Le Bernard
Le Bernard Airbnb Occupancy Rate Trends (2025)
Maximize your bookings by understanding the Le Bernard STR occupancy trends. Seasonal demand shifts significantly influence how often properties are booked. Typically, Augustsees the highest demand (peak season occupancy), while March experiences the lowest (low season). Effective strategies, like adjusting minimum stays or offering promotions, can boost occupancy during slower periods. Here's how different property tiers perform in Le Bernard:
- Best-in-class properties (Top 10%) achieve 70%+ occupancy, indicating high desirability and potentially optimized availability.
- Strong performing properties (Top 25%) maintain 56% or higher occupancy, suggesting good market fit and guest satisfaction.
- Typical properties (Median) have an occupancy rate around 34%.
- Entry-level properties (Bottom 25%) average 18% occupancy, potentially facing higher vacancy.
Average Monthly Occupancy Rate Trend in Le Bernard
Average Daily Rate (ADR) Airbnb Trends in Le Bernard (2025)
Effective short term rental pricing strategy in Le Bernard involves understanding monthly ADR fluctuations. The Average Daily Rate (ADR) for Airbnb in Le Bernard typically peaks in July and dips lowest during March. Leveraging Airbnb dynamic pricing tools or strategies based on this seasonality can significantly boost revenue. Here's a look at the typical nightly rates achieved:
- Best-in-class properties (Top 10%) command rates of $209+ per night, often due to premium features or locations.
- Strong performing properties (Top 25%) achieve nightly rates of $140 or more.
- Typical properties (Median) charge around $98 per night.
- Entry-level properties (Bottom 25%) earn around $74 per night.
Average Daily Rate (ADR) Trend by Month in Le Bernard
Get Live Le Bernard Market Intelligence 👇

Explore Real-time Analytics
Airbnb Seasonality Analysis & Trends in Le Bernard (2025)
Peak Season (August, July, April)
- Revenue averages $2,324 per month
- Occupancy rates average 56.3%
- Daily rates average $129
Shoulder Season
- Revenue averages $1,371 per month
- Occupancy maintains around 33.4%
- Daily rates hold near $124
Low Season (January, February, March)
- Revenue drops to average $815 per month
- Occupancy decreases to average 24.8%
- Daily rates adjust to average $109
Seasonality Insights for Le Bernard
- The Airbnb seasonality in Le Bernard shows highly seasonal trends requiring careful strategy. While the sections above show seasonal averages, it's also insightful to look at the extremes:
- During the high season, the absolute peak month showcases Le Bernard's highest earning potential, with monthly revenues capable of climbing to $2,915, occupancy reaching a high of 72.8%, and ADRs peaking at $133.
- Conversely, the slowest single month of the year, typically falling within the low season, marks the market's lowest point. In this month, revenue might dip to $621, occupancy could drop to 19.8%, and ADRs may adjust down to $108.
- Understanding both the seasonal averages and these monthly peaks and troughs in revenue, occupancy, and ADR is crucial for maximizing your Airbnb profit potential in Le Bernard.
Seasonal Strategies for Maximizing Profit
- Peak Season: Maximize revenue through premium pricing and potentially longer minimum stays. Ensure high availability.
- Low Season: Offer competitive pricing, special promotions (e.g., extended stay discounts), and flexible cancellation policies. Target off-season travelers like remote workers or budget-conscious guests.
- Shoulder Seasons: Implement dynamic pricing that balances peak and low rates. Target weekend travelers or specific events. Offer slightly more flexible terms than peak season.
- Regularly analyze your own performance against these Le Bernard seasonality benchmarks and adjust your pricing and availability strategy accordingly.
Best Areas for Airbnb Investment in Le Bernard (2025)
Exploring the top neighborhoods for short-term rentals in Le Bernard? This section highlights key areas, outlining why they are attractive for hosts and guests, along with notable local attractions. Consider these locations based on your target guest profile and investment strategy.
| Neighborhood / Area | Why Host Here? (Target Guests & Appeal) | Key Attractions & Landmarks |
|---|---|---|
| La Roche-sur-Yon | The largest city in Vendée, offering a vibrant atmosphere with historical sites and modern amenities. Great for exploring local culture and history. | Place Napoléon, Les Halles, Puy du Fou, Vélodrome de la Roche sur Yon, Museum of Vendée |
| Saint-Jean-de-Monts | A popular seaside resort with beautiful beaches and family-friendly activities. Ideal for tourists looking to relax and enjoy coastal fun. | Plage de Saint-Jean-de-Monts, Parc des Biches, Parc Aquatique O'Gliss, Cyclist paths, Eglise Saint-Jean-Baptiste |
| Noirmoutier-en-l'Île | An enchanting island known for its stunning landscapes, salt marshes, and charming villages. Perfect for those seeking a peaceful retreat. | Castle of Noirmoutier, L'Herbaudière port, Plage des Sables d'Olonne, Georges Coudray Botanical Garden, Noirmoutier's Aquatic Park |
| Les Sables-d'Olonne | Known for its long sandy beaches and vibrant town, this location is favored by beachgoers and sailors alike, making it a prime destination. | Les Sables d'Olonne beach, Zoo des Sables d'Olonne, Port Olona, Museum of the Sea, Abbaye Sainte-Croix |
| Challans | A charming town located near the coast known for its market and local products, ideal for those who appreciate rural tourism. | Challans Market, Eglise Saint-Jean-Baptiste, Chateau de Saint-Jean-de-Beugné, Cloître de Challans, Musee de l'Automobile |
| Saint-Gilles-Croix-de-Vie | A lively fishing port with great beaches and a bustling atmosphere, perfect for enjoying local seafood and summer activities. | Les Sables d'Olonne, Plage des Becs, Port de Saint-Gilles, La Corniche, Centre de Thalassothérapie |
| Saint-Hilaire-de-Riez | A coastal town with splendid beaches, offering a mix of relaxation and adventure with water sports and hiking trails. | Plage des Demoiselles, Les Marais Salants, Sentier de la Pointe du Payré, Parc des Vieux Chênes, Cycling paths |
| Beauvoir-sur-Mer | Known for its proximity to the historic Île de Noirmoutier and stunning natural landscapes, offering a tranquil setting for visitors. | Barrage de Beauvoir, Nature Reserve of the Baie de Bourgneuf, Eglise Saint-Philbert, Marais de Goulaine, Hiking trails through marshes |
Understanding Airbnb License Requirements & STR Laws in Le Bernard (2025)
While Le Bernard, Pays de la Loire, France currently shows low STR regulations, specific Airbnb license requirements might still exist or change. Always verify the latest short term rental regulations and Airbnb license requirements directly with local government authorities for Le Bernard to ensure full compliance before hosting.
(Source: AirROI data, 2025, finding no licensed listings among those analyzed)
Top Performing Airbnb Properties in Le Bernard (2025)
Benchmark your potential! Explore examples of top-performing Airbnb properties in Le Bernardbased on Trailing Twelve Month (TTM) revenue. Analyze their characteristics, revenue, occupancy rate, and ADR to understand what drives success in this market.

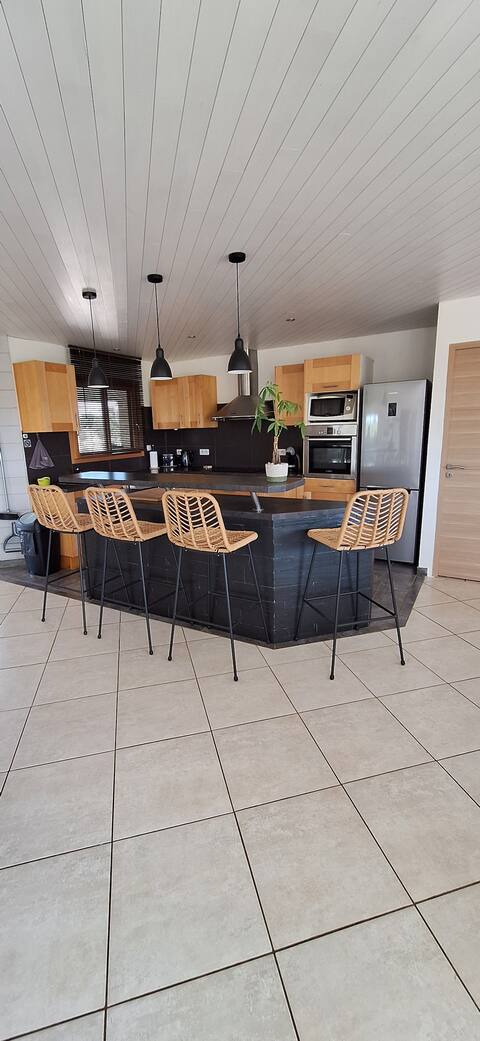
Demeure du Pont Rolland heated inside pool sauna
Entire Place • 4 bedrooms
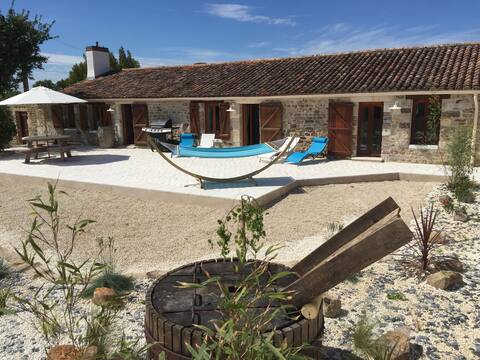
Spacious family villa in quiet Vendee beach
Entire Place • 5 bedrooms

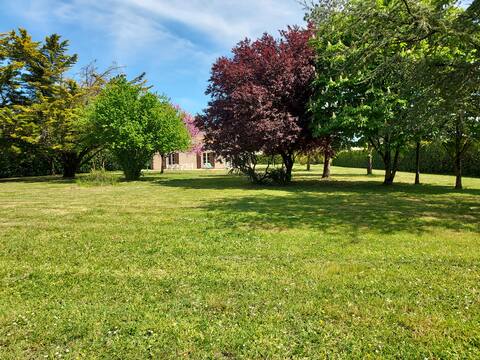
Recent house with swimming pool
Entire Place • 3 bedrooms
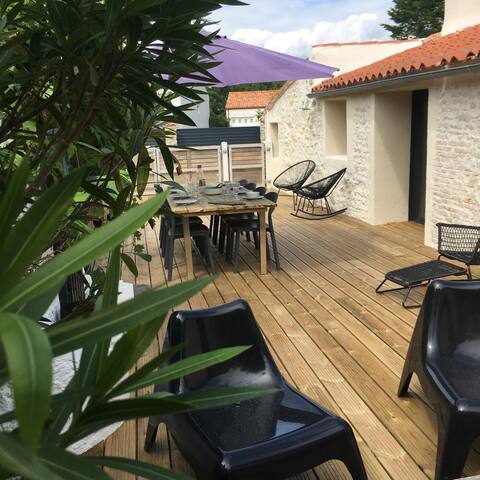
Historic 4 Bedroom Farmhouse in Vendee.
Entire Place • 4 bedrooms
Family home 7 km from the beaches
Entire Place • 6 bedrooms
Petite longère proche mer "chez Marthe"
Entire Place • 2 bedrooms
Note: Performance varies based on location, size, amenities, seasonality, and management quality. Data reflects the past 12 months.
Top Performing Airbnb Hosts in Le Bernard (2025)
Learn from the best! This table showcases top-performing Airbnb hosts in Le Bernard based on the number of properties managed and estimated total revenue over the past year. Analyze their scale and performance metrics.
| Host Name | Properties | Grossing Revenue | Stay Reviews | Avg Rating |
|---|---|---|---|---|
| Vincent | 1 | $56,596 | 30 | 4.80/5.0 |
| Alexandra & Damien | 5 | $38,135 | 3 | 1.00/5.0 |
| Sylvie | 1 | $37,608 | 5 | 5.00/5.0 |
| Karine | 1 | $30,618 | 9 | 5.00/5.0 |
| Vanessa | 7 | $29,398 | 87 | 4.74/5.0 |
| Claude | 3 | $28,847 | 30 | 4.89/5.0 |
| Kim | 1 | $28,139 | 14 | 4.64/5.0 |
| Hortense | 1 | $22,553 | 26 | 4.92/5.0 |
| Catherine | 2 | $22,183 | 16 | 4.42/5.0 |
| Host #28035837 | 1 | $19,666 | 100 | 4.94/5.0 |
Analyzing the strategies of top hosts, such as their property selection, pricing, and guest communication, can offer valuable lessons for optimizing your own Airbnb operations in Le Bernard.
Dive Deeper: Advanced Le Bernard STR Market Data (2025)
Ready to unlock more insights? AirROI provides access to advanced metrics and comprehensive Airbnb data for Le Bernard. Explore detailed analytics beyond this report to refine your investment strategy, optimize pricing, and maximize your vacation rental profits.
Explore Advanced MetricsLe Bernard Short-Term Rental Market Composition (2025): Property & Room Types
Room Type Distribution
Property Type Distribution
Market Composition Insights for Le Bernard
- The Le Bernard Airbnb market composition is heavily skewed towards Entire Home/Apt listings, which make up 57.1% of the 42 active rentals. This indicates strong guest preference for privacy and space.
- However, a notable 42.9% share for Private Rooms suggests opportunities for budget-conscious travelers or hosts renting out spare rooms.
- Looking at the property type distribution in Le Bernard, House properties are the most common (71.4%), reflecting the local real estate landscape.
- Houses represent a significant 71.4% portion, catering likely to families or larger groups.
- The presence of 16.7% Hotel/Boutique listings indicates integration with traditional hospitality.
- Smaller segments like others (combined 2.4%) offer potential for unique stay experiences.
Le Bernard Airbnb Room Capacity Analysis (2025): Bedroom Distribution
Distribution of Listings by Number of Bedrooms
Room Capacity Insights for Le Bernard
- The dominant room capacity in Le Bernard is 1 bedroom listings, making up 28.6% of the market. This suggests a strong demand for properties suitable for couples or solo travelers.
- Together, 1 bedroom and 2 bedrooms properties represent 45.3% of the active Airbnb listings in Le Bernard, indicating a high concentration in these sizes.
- A significant 23.9% of listings offer 3+ bedrooms, catering to larger groups and families seeking more space in Le Bernard.
Le Bernard Vacation Rental Guest Capacity Trends (2025)
Distribution of Listings by Guest Capacity
Guest Capacity Insights for Le Bernard
- The most common guest capacity trend in Le Bernard vacation rentals is listings accommodating 2 guests (19%). This suggests the primary traveler segment is likely couples or solo travelers.
- Properties designed for 2 guests and 8+ guests dominate the Le Bernard STR market, accounting for 30.9% of listings.
- 28.5% of properties accommodate 6+ guests, serving the market segment for larger families or group travel in Le Bernard.
- On average, properties in Le Bernard are equipped to host 3.1 guests.
Le Bernard Airbnb Booking Patterns (2025): Available vs. Booked Days
Available Days Distribution
Booked Days Distribution
Booking Pattern Insights for Le Bernard
- The most common availability pattern in Le Bernard falls within the 271-366 days range, representing 52.4% of listings. This suggests many properties have significant open periods on their calendars.
- Approximately 97.6% of listings show high availability (181+ days open annually), indicating potential for increased bookings or specific owner usage patterns.
- For booked days, the 91-180 days range is most frequent in Le Bernard (45.2%), reflecting common guest stay durations or potential owner blocking patterns.
- A notable 4.8% of properties secure long booking periods (181+ days booked per year), highlighting successful long-term rental strategies or significant owner usage.
Le Bernard Airbnb Minimum Stay Requirements Analysis
Distribution of Listings by Minimum Night Requirement
1 Night
13 listings
33.3% of total
2 Nights
15 listings
38.5% of total
3 Nights
5 listings
12.8% of total
4-6 Nights
3 listings
7.7% of total
7-29 Nights
1 listings
2.6% of total
30+ Nights
2 listings
5.1% of total
Key Insights
- The most prevalent minimum stay requirement in Le Bernard is 2 Nights, adopted by 38.5% of listings. This highlights the market's preference for shorter, flexible bookings.
- A strong majority (71.8%) of the Le Bernard Airbnb data shows acceptance of very short stays (1-2 nights), indicating a dynamic, high-turnover market.
Recommendations
- Align with the market by considering a 2 Nights minimum stay, as 38.5% of Le Bernard hosts use this setting.
- Explore offering discounts for stays of 30+ nights to attract the 5.1% of the market seeking extended stays.
- Adjust minimum nights based on seasonality – potentially shorter during low season and longer during peak demand periods in Le Bernard.
Le Bernard Airbnb Cancellation Policy Trends Analysis (2025)
Flexible
13 listings
35.1% of total
Moderate
9 listings
24.3% of total
Firm
3 listings
8.1% of total
Strict
12 listings
32.4% of total
Cancellation Policy Insights for Le Bernard
- The prevailing Airbnb cancellation policy trend in Le Bernard is Flexible, used by 35.1% of listings.
- There's a relatively balanced mix between guest-friendly (59.4%) and stricter (40.5%) policies, offering choices for different guest needs.
Recommendations for Hosts
- Consider adopting a Flexible policy to align with the 35.1% market standard in Le Bernard.
- With 32.4% using Strict terms, this is a viable option in Le Bernard, particularly for high-value properties or during peak demand periods.
- Regularly review your cancellation policy against competitors and market demand shifts in Le Bernard.
Le Bernard STR Booking Lead Time Analysis (2025)
Average Booking Lead Time by Month
Booking Lead Time Insights for Le Bernard
- The overall average booking lead time for vacation rentals in Le Bernard is 71 days.
- Guests book furthest in advance for stays during October (average 123 days), likely coinciding with peak travel demand or local events.
- The shortest booking windows occur for stays in February (average 19 days), indicating more last-minute travel plans during this time.
- Seasonally, Spring (91 days avg.) sees the longest lead times, while Winter (38 days avg.) has the shortest, reflecting typical travel planning cycles.
Recommendations for Hosts
- Use the overall average lead time (71 days) as a baseline for your pricing and availability strategy in Le Bernard.
- For October stays, consider implementing length-of-stay discounts or slightly higher rates for bookings made less than 123 days out to capitalize on advance planning.
- Target marketing efforts for the Spring season well in advance (at least 91 days) to capture early planners.
- Monitor your own booking lead times against these Le Bernard averages to identify opportunities for dynamic pricing adjustments.
Popular & Essential Airbnb Amenities in Le Bernard (2025)
Amenity Prevalence
Amenity Insights for Le Bernard
- Popular amenities like Heating, Free parking on premises, Kitchen are common but not universal. Offering these can provide a competitive edge.
Recommendations for Hosts
- Consider adding popular differentiators like Heating or Free parking on premises to increase appeal.
- Highlight unique or less common amenities you offer (e.g., hot tub, dedicated workspace, EV charger) in your listing description and photos.
- Regularly check competitor amenities in Le Bernard to stay competitive.
Le Bernard Airbnb Guest Demographics & Profile Analysis (2025)
Guest Profile Summary for Le Bernard
- The typical guest profile for Airbnb in Le Bernard consists of primarily domestic travelers (94%), often arriving from nearby Paris, typically belonging to the Post-2000s (Gen Z/Alpha) group (50%), primarily speaking French or English.
- Domestic travelers account for 94.0% of guests.
- Key international markets include France (94%) and Germany (3%).
- Top languages spoken are French (54.1%) followed by English (31.2%).
- A significant demographic segment is the Post-2000s (Gen Z/Alpha) group, representing 50% of guests.
Recommendations for Hosts
- Target domestic marketing efforts towards travelers from Paris and Nantes.
- Tailor amenities and listing descriptions to appeal to the dominant Post-2000s (Gen Z/Alpha) demographic (e.g., highlight fast WiFi, smart home features, local guides).
- Highlight unique local experiences or amenities relevant to the primary guest profile.
- Consider seasonal promotions aligned with peak travel times for key origin markets.
Nearby Short-Term Rental Market Comparison
How does the Le Bernard Airbnb market stack up against its neighbors? Compare key performance metrics like average monthly revenue, ADR, and occupancy rates in surrounding areas to understand the broader regional STR landscape.
| Market | Active Properties | Monthly Revenue | Daily Rate | Avg. Occupancy |
|---|---|---|---|---|
| Vallon-sur-Gée | 11 | $2,913 | $379.01 | 30% |
| Bourneau | 11 | $2,747 | $442.07 | 35% |
| Nuaillé-d'Aunis | 10 | $2,741 | $373.83 | 37% |
| Le Bois-Plage-en-Ré | 303 | $2,528 | $284.63 | 45% |
| Chambellay | 11 | $2,525 | $255.24 | 34% |
| Sainte-Florence | 10 | $2,445 | $233.78 | 46% |
| Saint-Hippolyte | 10 | $2,443 | $204.98 | 44% |
| Abzac | 12 | $2,415 | $349.03 | 36% |
| La Flotte | 396 | $2,382 | $236.53 | 46% |
| Saint-Georges-des-Coteaux | 12 | $2,335 | $187.61 | 43% |