La Chapelle-sur-Erdre Airbnb Market Analysis 2025: Short Term Rental Data & Vacation Rental Statistics in Pays de la Loire, France
Is Airbnb profitable in La Chapelle-sur-Erdre in 2025? Explore comprehensive Airbnb analytics for La Chapelle-sur-Erdre, Pays de la Loire, France to uncover income potential. This 2025 STR market report for La Chapelle-sur-Erdre, based on AirROI data from April 2024 to March 2025, reveals key trends in the niche market of 62 active listings.
Whether you're considering an Airbnb investment in La Chapelle-sur-Erdre, optimizing your existing vacation rental, or exploring rental arbitrage opportunities, understanding the La Chapelle-sur-Erdre Airbnb data is crucial. Leveraging the low regulation environment is key to maximizing your short term rental income potential. Let's dive into the specifics.
Key La Chapelle-sur-Erdre Airbnb Performance Metrics Overview
Monthly Airbnb Revenue Variations & Income Potential in La Chapelle-sur-Erdre (2025)
Understanding the monthly revenue variations for Airbnb listings in La Chapelle-sur-Erdre is key to maximizing your short term rental income potential. Seasonality significantly impacts earnings. Our analysis, based on data from the past 12 months, shows that the peak revenue month for STRs in La Chapelle-sur-Erdre is typically August, while October often presents the lowest earnings, highlighting opportunities for strategic pricing adjustments during shoulder and low seasons. Explore the typical Airbnb income in La Chapelle-sur-Erdre across different performance tiers:
- Best-in-class properties (Top 10%) achieve $2,507+ monthly, often utilizing dynamic pricing and superior guest experiences.
- Strong performing properties (Top 25%) earn $1,474 or more, indicating effective management and desirable locations/amenities.
- Typical properties (Median) generate around $888 per month, representing the average market performance.
- Entry-level properties (Bottom 25%) see earnings around $477, often with potential for optimization.
Average Monthly Airbnb Earnings Trend in La Chapelle-sur-Erdre
La Chapelle-sur-Erdre Airbnb Occupancy Rate Trends (2025)
Maximize your bookings by understanding the La Chapelle-sur-Erdre STR occupancy trends. Seasonal demand shifts significantly influence how often properties are booked. Typically, Augustsees the highest demand (peak season occupancy), while June experiences the lowest (low season). Effective strategies, like adjusting minimum stays or offering promotions, can boost occupancy during slower periods. Here's how different property tiers perform in La Chapelle-sur-Erdre:
- Best-in-class properties (Top 10%) achieve 82%+ occupancy, indicating high desirability and potentially optimized availability.
- Strong performing properties (Top 25%) maintain 70% or higher occupancy, suggesting good market fit and guest satisfaction.
- Typical properties (Median) have an occupancy rate around 43%.
- Entry-level properties (Bottom 25%) average 22% occupancy, potentially facing higher vacancy.
Average Monthly Occupancy Rate Trend in La Chapelle-sur-Erdre
Average Daily Rate (ADR) Airbnb Trends in La Chapelle-sur-Erdre (2025)
Effective short term rental pricing strategy in La Chapelle-sur-Erdre involves understanding monthly ADR fluctuations. The Average Daily Rate (ADR) for Airbnb in La Chapelle-sur-Erdre typically peaks in November and dips lowest during April. Leveraging Airbnb dynamic pricing tools or strategies based on this seasonality can significantly boost revenue. Here's a look at the typical nightly rates achieved:
- Best-in-class properties (Top 10%) command rates of $216+ per night, often due to premium features or locations.
- Strong performing properties (Top 25%) achieve nightly rates of $123 or more.
- Typical properties (Median) charge around $70 per night.
- Entry-level properties (Bottom 25%) earn around $41 per night.
Average Daily Rate (ADR) Trend by Month in La Chapelle-sur-Erdre
Get Live La Chapelle-sur-Erdre Market Intelligence 👇

Explore Real-time Analytics
Airbnb Seasonality Analysis & Trends in La Chapelle-sur-Erdre (2025)
Peak Season (August, July, June)
- Revenue averages $1,713 per month
- Occupancy rates average 49.5%
- Daily rates average $98
Shoulder Season
- Revenue averages $1,209 per month
- Occupancy maintains around 45.7%
- Daily rates hold near $101
Low Season (January, March, October)
- Revenue drops to average $859 per month
- Occupancy decreases to average 41.2%
- Daily rates adjust to average $101
Seasonality Insights for La Chapelle-sur-Erdre
- The Airbnb seasonality in La Chapelle-sur-Erdre shows highly seasonal trends requiring careful strategy. While the sections above show seasonal averages, it's also insightful to look at the extremes:
- During the high season, the absolute peak month showcases La Chapelle-sur-Erdre's highest earning potential, with monthly revenues capable of climbing to $1,877, occupancy reaching a high of 59.6%, and ADRs peaking at $109.
- Conversely, the slowest single month of the year, typically falling within the low season, marks the market's lowest point. In this month, revenue might dip to $846, occupancy could drop to 38.1%, and ADRs may adjust down to $96.
- Understanding both the seasonal averages and these monthly peaks and troughs in revenue, occupancy, and ADR is crucial for maximizing your Airbnb profit potential in La Chapelle-sur-Erdre.
Seasonal Strategies for Maximizing Profit
- Peak Season: Maximize revenue through premium pricing and potentially longer minimum stays. Ensure high availability.
- Low Season: Offer competitive pricing, special promotions (e.g., extended stay discounts), and flexible cancellation policies. Target off-season travelers like remote workers or budget-conscious guests.
- Shoulder Seasons: Implement dynamic pricing that balances peak and low rates. Target weekend travelers or specific events. Offer slightly more flexible terms than peak season.
- Regularly analyze your own performance against these La Chapelle-sur-Erdre seasonality benchmarks and adjust your pricing and availability strategy accordingly.
Best Areas for Airbnb Investment in La Chapelle-sur-Erdre (2025)
Exploring the top neighborhoods for short-term rentals in La Chapelle-sur-Erdre? This section highlights key areas, outlining why they are attractive for hosts and guests, along with notable local attractions. Consider these locations based on your target guest profile and investment strategy.
| Neighborhood / Area | Why Host Here? (Target Guests & Appeal) | Key Attractions & Landmarks |
|---|---|---|
| Centre-ville de La Chapelle-sur-Erdre | The downtown area offers easy access to local shops, restaurants, and cultural attractions. It's ideal for tourists looking to explore the city environment and nearby parks. | Parc de la Roche de Nantes, Erdre River, local markets, cafe terraces, historical sites |
| Les Belles Forges | A residential area that is quiet yet close enough to amenities and natural beauty, it appeals to families and those looking for a serene getaway. | Belles Forges Park, La Chapelle sur Erdre golf course, hiking trails, local festivals |
| Erdre et Gesvres | This area is known for its picturesque landscape along the Erdre River, making it perfect for visitors who enjoy outdoor activities and nature. | Erdre River activities, bicycle paths, scenic viewpoints |
| La Cantine | A vibrant area close to educational institutions attracting students and young professionals, great for budget-friendly accommodations. | Cafes, co-working spaces, local events and exhibitions |
| Champs Blancs | A residential neighborhood with essential services and a family-friendly vibe, popular with longer-term stays. | local parks, family-friendly restaurants, playgrounds |
| Petit Port | Situated near the waterways, this area is perfect for those seeking a peaceful retreat with access to water activities. | boating, fishing areas, scenic walks |
| Sainte Luce sur Loire | A bit outside La Chapelle but offers beautiful landscapes and attractions that draw couples and families looking for relaxation. | Sainte Luce Park, nature reserves, local vineyards |
| Zone d'Activités du Sillon | An area with plentiful business activities and amenities, attracting business travelers and those attending conferences. | business parks, conference venues, commercial centers |
Understanding Airbnb License Requirements & STR Laws in La Chapelle-sur-Erdre (2025)
While La Chapelle-sur-Erdre, Pays de la Loire, France currently shows low STR regulations, specific Airbnb license requirements might still exist or change. Always verify the latest short term rental regulations and Airbnb license requirements directly with local government authorities for La Chapelle-sur-Erdre to ensure full compliance before hosting.
(Source: AirROI data, 2025, based on 10% licensed listings)
Top Performing Airbnb Properties in La Chapelle-sur-Erdre (2025)
Benchmark your potential! Explore examples of top-performing Airbnb properties in La Chapelle-sur-Erdrebased on Trailing Twelve Month (TTM) revenue. Analyze their characteristics, revenue, occupancy rate, and ADR to understand what drives success in this market.
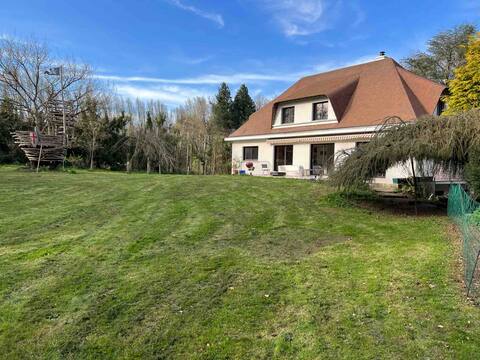
Spacious family home on the outskirts of Nantes
Entire Place • 5 bedrooms

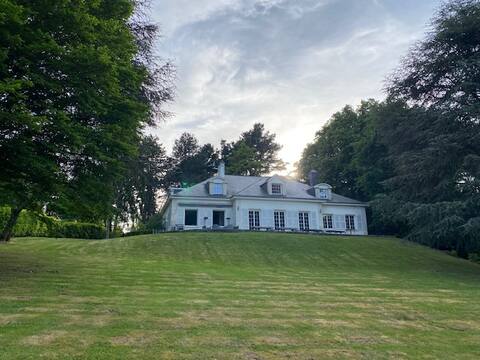
Heated pool, view of Erdre, walks, Nantes
Entire Place • 8 bedrooms
Maison les pieds dans l'eau à 15 min de Nantes
Entire Place • 6 bedrooms
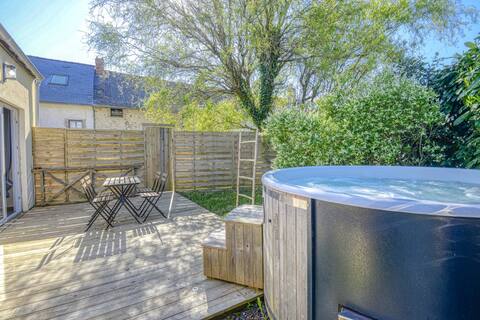
Cocoon house and Nordic bath
Entire Place • 1 bedroom
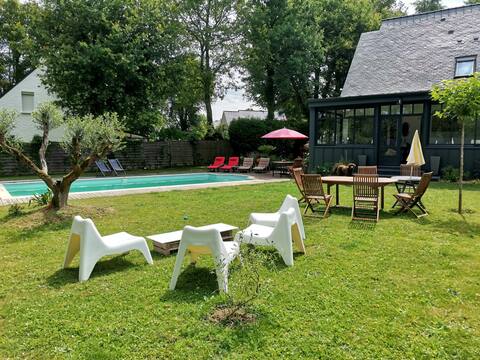
Tree house with heated pool
Entire Place • 3 bedrooms

The Anne Gite
Entire Place • 2 bedrooms
Note: Performance varies based on location, size, amenities, seasonality, and management quality. Data reflects the past 12 months.
Top Performing Airbnb Hosts in La Chapelle-sur-Erdre (2025)
Learn from the best! This table showcases top-performing Airbnb hosts in La Chapelle-sur-Erdre based on the number of properties managed and estimated total revenue over the past year. Analyze their scale and performance metrics.
| Host Name | Properties | Grossing Revenue | Stay Reviews | Avg Rating |
|---|---|---|---|---|
| Albanetrachel | 2 | $67,114 | 46 | 4.95/5.0 |
| Anne | 2 | $42,963 | 19 | 2.48/5.0 |
| Host #21801105 | 1 | $36,446 | 3 | 5.00/5.0 |
| Eléonore Et Marc | 2 | $31,959 | 63 | 4.90/5.0 |
| Anne | 2 | $28,642 | 105 | 4.83/5.0 |
| Marine | 1 | $23,562 | 33 | 4.52/5.0 |
| Nicole | 2 | $21,565 | 478 | 4.92/5.0 |
| Sylvie Catherine | 1 | $21,486 | 7 | 4.86/5.0 |
| Adeline | 1 | $17,065 | 7 | 4.86/5.0 |
| Del Moral | 1 | $16,271 | 109 | 4.97/5.0 |
Analyzing the strategies of top hosts, such as their property selection, pricing, and guest communication, can offer valuable lessons for optimizing your own Airbnb operations in La Chapelle-sur-Erdre.
Dive Deeper: Advanced La Chapelle-sur-Erdre STR Market Data (2025)
Ready to unlock more insights? AirROI provides access to advanced metrics and comprehensive Airbnb data for La Chapelle-sur-Erdre. Explore detailed analytics beyond this report to refine your investment strategy, optimize pricing, and maximize your vacation rental profits.
Explore Advanced MetricsLa Chapelle-sur-Erdre Short-Term Rental Market Composition (2025): Property & Room Types
Room Type Distribution
Property Type Distribution
Market Composition Insights for La Chapelle-sur-Erdre
- The La Chapelle-sur-Erdre Airbnb market composition is heavily skewed towards Entire Home/Apt listings, which make up 75.8% of the 62 active rentals. This indicates strong guest preference for privacy and space.
- Looking at the property type distribution in La Chapelle-sur-Erdre, House properties are the most common (64.5%), reflecting the local real estate landscape.
- Houses represent a significant 64.5% portion, catering likely to families or larger groups.
- The presence of 8.1% Hotel/Boutique listings indicates integration with traditional hospitality.
La Chapelle-sur-Erdre Airbnb Room Capacity Analysis (2025): Bedroom Distribution
Distribution of Listings by Number of Bedrooms
Room Capacity Insights for La Chapelle-sur-Erdre
- The dominant room capacity in La Chapelle-sur-Erdre is 1 bedroom listings, making up 27.4% of the market. This suggests a strong demand for properties suitable for couples or solo travelers.
- Together, 1 bedroom and 2 bedrooms properties represent 45.1% of the active Airbnb listings in La Chapelle-sur-Erdre, indicating a high concentration in these sizes.
- A significant 30.7% of listings offer 3+ bedrooms, catering to larger groups and families seeking more space in La Chapelle-sur-Erdre.
La Chapelle-sur-Erdre Vacation Rental Guest Capacity Trends (2025)
Distribution of Listings by Guest Capacity
Guest Capacity Insights for La Chapelle-sur-Erdre
- The most common guest capacity trend in La Chapelle-sur-Erdre vacation rentals is listings accommodating 2 guests (29%). This suggests the primary traveler segment is likely couples or solo travelers.
- Properties designed for 2 guests and 6 guests dominate the La Chapelle-sur-Erdre STR market, accounting for 46.7% of listings.
- 37.0% of properties accommodate 6+ guests, serving the market segment for larger families or group travel in La Chapelle-sur-Erdre.
- On average, properties in La Chapelle-sur-Erdre are equipped to host 3.9 guests.
La Chapelle-sur-Erdre Airbnb Booking Patterns (2025): Available vs. Booked Days
Available Days Distribution
Booked Days Distribution
Booking Pattern Insights for La Chapelle-sur-Erdre
- The most common availability pattern in La Chapelle-sur-Erdre falls within the 271-366 days range, representing 48.4% of listings. This suggests many properties have significant open periods on their calendars.
- Approximately 71.0% of listings show high availability (181+ days open annually), indicating potential for increased bookings or specific owner usage patterns.
- For booked days, the 31-90 days range is most frequent in La Chapelle-sur-Erdre (33.9%), reflecting common guest stay durations or potential owner blocking patterns.
- A notable 29.1% of properties secure long booking periods (181+ days booked per year), highlighting successful long-term rental strategies or significant owner usage.
La Chapelle-sur-Erdre Airbnb Minimum Stay Requirements Analysis
Distribution of Listings by Minimum Night Requirement
1 Night
22 listings
40.7% of total
2 Nights
13 listings
24.1% of total
3 Nights
3 listings
5.6% of total
4-6 Nights
6 listings
11.1% of total
7-29 Nights
6 listings
11.1% of total
30+ Nights
4 listings
7.4% of total
Key Insights
- The most prevalent minimum stay requirement in La Chapelle-sur-Erdre is 1 Night, adopted by 40.7% of listings. This highlights the market's preference for shorter, flexible bookings.
- A strong majority (64.8%) of the La Chapelle-sur-Erdre Airbnb data shows acceptance of very short stays (1-2 nights), indicating a dynamic, high-turnover market.
Recommendations
- Align with the market by considering a 1 Night minimum stay, as 40.7% of La Chapelle-sur-Erdre hosts use this setting.
- Explore offering discounts for stays of 30+ nights to attract the 7.4% of the market seeking extended stays.
- Adjust minimum nights based on seasonality – potentially shorter during low season and longer during peak demand periods in La Chapelle-sur-Erdre.
La Chapelle-sur-Erdre Airbnb Cancellation Policy Trends Analysis (2025)
Flexible
15 listings
30.6% of total
Moderate
19 listings
38.8% of total
Firm
10 listings
20.4% of total
Strict
5 listings
10.2% of total
Cancellation Policy Insights for La Chapelle-sur-Erdre
- The prevailing Airbnb cancellation policy trend in La Chapelle-sur-Erdre is Moderate, used by 38.8% of listings.
- There's a relatively balanced mix between guest-friendly (69.4%) and stricter (30.6%) policies, offering choices for different guest needs.
Recommendations for Hosts
- Consider adopting a Moderate policy to align with the 38.8% market standard in La Chapelle-sur-Erdre.
- Using a Strict policy might deter some guests, as only 10.2% of listings use it. Evaluate if potential revenue protection outweighs possible lower booking rates.
- Regularly review your cancellation policy against competitors and market demand shifts in La Chapelle-sur-Erdre.
La Chapelle-sur-Erdre STR Booking Lead Time Analysis (2025)
Average Booking Lead Time by Month
Booking Lead Time Insights for La Chapelle-sur-Erdre
- The overall average booking lead time for vacation rentals in La Chapelle-sur-Erdre is 47 days.
- Guests book furthest in advance for stays during July (average 71 days), likely coinciding with peak travel demand or local events.
- The shortest booking windows occur for stays in December (average 30 days), indicating more last-minute travel plans during this time.
- Seasonally, Summer (65 days avg.) sees the longest lead times, while Winter (31 days avg.) has the shortest, reflecting typical travel planning cycles.
Recommendations for Hosts
- Use the overall average lead time (47 days) as a baseline for your pricing and availability strategy in La Chapelle-sur-Erdre.
- For July stays, consider implementing length-of-stay discounts or slightly higher rates for bookings made less than 71 days out to capitalize on advance planning.
- Target marketing efforts for the Summer season well in advance (at least 65 days) to capture early planners.
- Monitor your own booking lead times against these La Chapelle-sur-Erdre averages to identify opportunities for dynamic pricing adjustments.
Popular & Essential Airbnb Amenities in La Chapelle-sur-Erdre (2025)
Amenity Prevalence
Amenity Insights for La Chapelle-sur-Erdre
- Essential amenities in La Chapelle-sur-Erdre that guests expect include: Heating, Hot water, Wifi, Free parking on premises. Lacking these (any) could significantly impact bookings.
- Popular amenities like Kitchen, Dishes and silverware, Essentials are common but not universal. Offering these can provide a competitive edge.
Recommendations for Hosts
- Ensure your listing includes all essential amenities for La Chapelle-sur-Erdre: Heating, Hot water, Wifi, Free parking on premises.
- Prioritize adding missing essentials: Heating, Hot water, Wifi, Free parking on premises.
- Consider adding popular differentiators like Kitchen or Dishes and silverware to increase appeal.
- Highlight unique or less common amenities you offer (e.g., hot tub, dedicated workspace, EV charger) in your listing description and photos.
- Regularly check competitor amenities in La Chapelle-sur-Erdre to stay competitive.
La Chapelle-sur-Erdre Airbnb Guest Demographics & Profile Analysis (2025)
Guest Profile Summary for La Chapelle-sur-Erdre
- The typical guest profile for Airbnb in La Chapelle-sur-Erdre consists of primarily domestic travelers (93%), often arriving from nearby Paris, typically belonging to the Post-2000s (Gen Z/Alpha) group (50%), primarily speaking French or English.
- Domestic travelers account for 92.9% of guests.
- Key international markets include France (92.9%) and United Kingdom (1.5%).
- Top languages spoken are French (49.8%) followed by English (31.5%).
- A significant demographic segment is the Post-2000s (Gen Z/Alpha) group, representing 50% of guests.
Recommendations for Hosts
- Target domestic marketing efforts towards travelers from Paris and Nantes.
- Tailor amenities and listing descriptions to appeal to the dominant Post-2000s (Gen Z/Alpha) demographic (e.g., highlight fast WiFi, smart home features, local guides).
- Highlight unique local experiences or amenities relevant to the primary guest profile.
- Consider seasonal promotions aligned with peak travel times for key origin markets.
Nearby Short-Term Rental Market Comparison
How does the La Chapelle-sur-Erdre Airbnb market stack up against its neighbors? Compare key performance metrics like average monthly revenue, ADR, and occupancy rates in surrounding areas to understand the broader regional STR landscape.
| Market | Active Properties | Monthly Revenue | Daily Rate | Avg. Occupancy |
|---|---|---|---|---|
| Moulins-le-Carbonnel | 11 | $3,213 | $320.85 | 35% |
| Vallon-sur-Gée | 11 | $2,913 | $379.01 | 30% |
| Bourneau | 11 | $2,747 | $442.07 | 35% |
| Nuaillé-d'Aunis | 10 | $2,741 | $373.83 | 37% |
| Le Bois-Plage-en-Ré | 303 | $2,528 | $284.63 | 45% |
| Chambellay | 11 | $2,525 | $255.24 | 34% |
| Sainte-Florence | 10 | $2,445 | $233.78 | 46% |
| La Flotte | 396 | $2,382 | $236.53 | 46% |
| Forges | 11 | $2,314 | $220.63 | 39% |
| Dœuil-sur-le-Mignon | 12 | $2,283 | $481.91 | 21% |