La Chapelle-des-Marais Airbnb Market Analysis 2025: Short Term Rental Data & Vacation Rental Statistics in Pays de la Loire, France
Is Airbnb profitable in La Chapelle-des-Marais in 2025? Explore comprehensive Airbnb analytics for La Chapelle-des-Marais, Pays de la Loire, France to uncover income potential. This 2025 STR market report for La Chapelle-des-Marais, based on AirROI data from April 2024 to March 2025, reveals key trends in the niche market of 19 active listings.
Whether you're considering an Airbnb investment in La Chapelle-des-Marais, optimizing your existing vacation rental, or exploring rental arbitrage opportunities, understanding the La Chapelle-des-Marais Airbnb data is crucial. Understanding the local regulations is key to maximizing your short term rental income potential. Let's dive into the specifics.
Key La Chapelle-des-Marais Airbnb Performance Metrics Overview
Monthly Airbnb Revenue Variations & Income Potential in La Chapelle-des-Marais (2025)
Understanding the monthly revenue variations for Airbnb listings in La Chapelle-des-Marais is key to maximizing your short term rental income potential. Seasonality significantly impacts earnings. Our analysis, based on data from the past 12 months, shows that the peak revenue month for STRs in La Chapelle-des-Marais is typically August, while January often presents the lowest earnings, highlighting opportunities for strategic pricing adjustments during shoulder and low seasons. Explore the typical Airbnb income in La Chapelle-des-Marais across different performance tiers:
- Best-in-class properties (Top 10%) achieve $3,934+ monthly, often utilizing dynamic pricing and superior guest experiences.
- Strong performing properties (Top 25%) earn $1,569 or more, indicating effective management and desirable locations/amenities.
- Typical properties (Median) generate around $1,131 per month, representing the average market performance.
- Entry-level properties (Bottom 25%) see earnings around $630, often with potential for optimization.
Average Monthly Airbnb Earnings Trend in La Chapelle-des-Marais
La Chapelle-des-Marais Airbnb Occupancy Rate Trends (2025)
Maximize your bookings by understanding the La Chapelle-des-Marais STR occupancy trends. Seasonal demand shifts significantly influence how often properties are booked. Typically, Augustsees the highest demand (peak season occupancy), while January experiences the lowest (low season). Effective strategies, like adjusting minimum stays or offering promotions, can boost occupancy during slower periods. Here's how different property tiers perform in La Chapelle-des-Marais:
- Best-in-class properties (Top 10%) achieve 83%+ occupancy, indicating high desirability and potentially optimized availability.
- Strong performing properties (Top 25%) maintain 71% or higher occupancy, suggesting good market fit and guest satisfaction.
- Typical properties (Median) have an occupancy rate around 48%.
- Entry-level properties (Bottom 25%) average 29% occupancy, potentially facing higher vacancy.
Average Monthly Occupancy Rate Trend in La Chapelle-des-Marais
Average Daily Rate (ADR) Airbnb Trends in La Chapelle-des-Marais (2025)
Effective short term rental pricing strategy in La Chapelle-des-Marais involves understanding monthly ADR fluctuations. The Average Daily Rate (ADR) for Airbnb in La Chapelle-des-Marais typically peaks in December and dips lowest during September. Leveraging Airbnb dynamic pricing tools or strategies based on this seasonality can significantly boost revenue. Here's a look at the typical nightly rates achieved:
- Best-in-class properties (Top 10%) command rates of $262+ per night, often due to premium features or locations.
- Strong performing properties (Top 25%) achieve nightly rates of $99 or more.
- Typical properties (Median) charge around $69 per night.
- Entry-level properties (Bottom 25%) earn around $56 per night.
Average Daily Rate (ADR) Trend by Month in La Chapelle-des-Marais
Get Live La Chapelle-des-Marais Market Intelligence 👇

Explore Real-time Analytics
Airbnb Seasonality Analysis & Trends in La Chapelle-des-Marais (2025)
Peak Season (August, July, May)
- Revenue averages $2,358 per month
- Occupancy rates average 62.1%
- Daily rates average $103
Shoulder Season
- Revenue averages $1,575 per month
- Occupancy maintains around 49.1%
- Daily rates hold near $104
Low Season (January, March, September)
- Revenue drops to average $1,369 per month
- Occupancy decreases to average 43.8%
- Daily rates adjust to average $105
Seasonality Insights for La Chapelle-des-Marais
- The Airbnb seasonality in La Chapelle-des-Marais shows highly seasonal trends requiring careful strategy. While the sections above show seasonal averages, it's also insightful to look at the extremes:
- During the high season, the absolute peak month showcases La Chapelle-des-Marais's highest earning potential, with monthly revenues capable of climbing to $2,898, occupancy reaching a high of 68.0%, and ADRs peaking at $111.
- Conversely, the slowest single month of the year, typically falling within the low season, marks the market's lowest point. In this month, revenue might dip to $1,215, occupancy could drop to 33.2%, and ADRs may adjust down to $100.
- Understanding both the seasonal averages and these monthly peaks and troughs in revenue, occupancy, and ADR is crucial for maximizing your Airbnb profit potential in La Chapelle-des-Marais.
Seasonal Strategies for Maximizing Profit
- Peak Season: Maximize revenue through premium pricing and potentially longer minimum stays. Ensure high availability.
- Low Season: Offer competitive pricing, special promotions (e.g., extended stay discounts), and flexible cancellation policies. Target off-season travelers like remote workers or budget-conscious guests.
- Shoulder Seasons: Implement dynamic pricing that balances peak and low rates. Target weekend travelers or specific events. Offer slightly more flexible terms than peak season.
- Regularly analyze your own performance against these La Chapelle-des-Marais seasonality benchmarks and adjust your pricing and availability strategy accordingly.
Best Areas for Airbnb Investment in La Chapelle-des-Marais (2025)
Exploring the top neighborhoods for short-term rentals in La Chapelle-des-Marais? This section highlights key areas, outlining why they are attractive for hosts and guests, along with notable local attractions. Consider these locations based on your target guest profile and investment strategy.
| Neighborhood / Area | Why Host Here? (Target Guests & Appeal) | Key Attractions & Landmarks |
|---|---|---|
| La Chapelle-des-Marais Center | The heart of La Chapelle-des-Marais, ideal for visitors looking to explore local shops, restaurants, and community events. It's close to key amenities and has a charming rural atmosphere. | Eglise Saint-Étienne, local markets, La Chapelle Park, attractive walking paths, community festivals |
| La Brière Natural Park | A beautiful natural reserve offering unique landscapes and biodiversity, perfect for nature lovers and outdoor enthusiasts. It attracts visitors interested in hiking, bird watching, and exploring wetlands. | Brière Marshes, Canal de la Brière, wildlife observation, boating activities, natural trails |
| Saint-Nazaire | A nearby seaside city that attracts a significant number of tourists with its beaches, waterfront promenades, and historic sites, making it a prime spot for holiday rentals. | Saint-Nazaire Beach, Escal'Atlantic, Submarine Pens, Brittany Coast, Port of Saint-Nazaire |
| Guérande | Famous for its medieval city and salt marshes, Guérande lures visitors interested in history and gastronomy. Its picturesque streets and cultural heritage make it appealing for short stays. | Guérande Old Town, Salt Marshes, Guérande Castle, Cultural heritage sites, local restaurants |
| La Baule-Escoublac | Known for its long sandy beach and upscale resorts, La Baule is a popular vacation destination for families and beachgoers, thus boosting the demand for Airbnb rentals. | La Baule Beach, Thalassotherapy centers, Promenade de la Baule, water sports, arts and crafts fairs |
| Nantes | A vibrant city with rich cultural offerings and historic sites, Nantes is a larger urban area attracting business travelers, tourists, and students, providing diverse rental opportunities. | Château des Ducs de Bretagne, Les Machines de l'île, Nantes Cathedral, Castle Park, local breweries |
| Piriac-sur-Mer | A charming coastal town with beautiful beaches and a quaint harbor, appealing for visitors looking for a peaceful retreat by the sea and outdoor activities. | Piriac Beach, Port of Piriac, Coastal trails, local seafood restaurants, historical buildings |
| Müladon | A small, picturesque village with a serene vibe and beautiful landscapes, attracting visitors who prefer quiet stays away from busy tourist spots while still enjoying nature. | Local hiking paths, Scenic viewpoints, idyllic countryside, traditional farms, culinary experiences |
Understanding Airbnb License Requirements & STR Laws in La Chapelle-des-Marais (2025)
With 11% of listings showing registration in 2025, understanding potential Airbnb license requirements is crucial in La Chapelle-des-Marais. Always verify the latest short term rental regulations and Airbnb license requirements directly with local government authorities for La Chapelle-des-Marais to ensure full compliance before hosting.
(Source: AirROI data, 2025, based on 11% licensed listings)
Top Performing Airbnb Properties in La Chapelle-des-Marais (2025)
Benchmark your potential! Explore examples of top-performing Airbnb properties in La Chapelle-des-Maraisbased on Trailing Twelve Month (TTM) revenue. Analyze their characteristics, revenue, occupancy rate, and ADR to understand what drives success in this market.
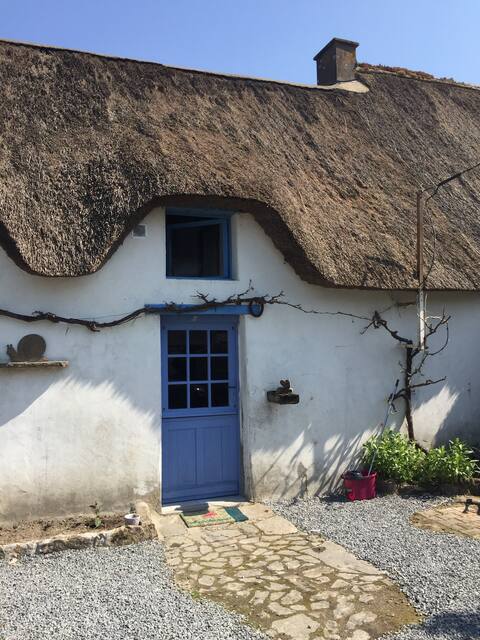
Gîte de Charme et Romantique
Entire Place • 1 bedroom
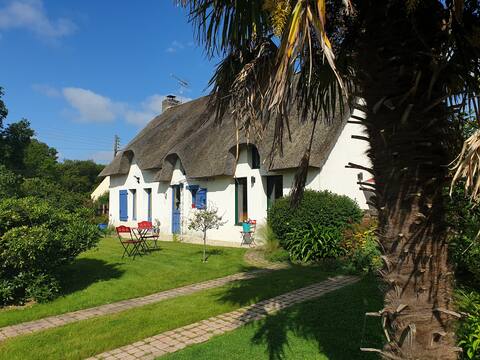
La Chaumière des Marionnettes: Linotte +Gelinotte
Entire Place • 2 bedrooms
Jolie maison avec piscine
Entire Place • 6 bedrooms
Jolie maison avec piscine
Entire Place • 6 bedrooms
La Chaumière des Marionnettes: Bergamote
Entire Place • 2 bedrooms
Le Logis des Roseaux, Meublé de Tourisme 3*
Entire Place • 2 bedrooms
Note: Performance varies based on location, size, amenities, seasonality, and management quality. Data reflects the past 12 months.
Top Performing Airbnb Hosts in La Chapelle-des-Marais (2025)
Learn from the best! This table showcases top-performing Airbnb hosts in La Chapelle-des-Marais based on the number of properties managed and estimated total revenue over the past year. Analyze their scale and performance metrics.
| Host Name | Properties | Grossing Revenue | Stay Reviews | Avg Rating |
|---|---|---|---|---|
| Gabrielle | 1 | $79,703 | 144 | 4.97/5.0 |
| Stéphane Et Nicolas | 4 | $67,819 | 1038 | 4.86/5.0 |
| Host #282881975 | 2 | $37,008 | 0 | 0.00/5.0 |
| Steph & Béa | 1 | $15,489 | 40 | 4.95/5.0 |
| Jacques Et Claude | 2 | $14,623 | 61 | 2.46/5.0 |
| Laurent | 1 | $13,873 | 6 | 5.00/5.0 |
| Stéphanie | 1 | $11,325 | 30 | 5.00/5.0 |
| Wendy | 1 | $10,366 | 64 | 5.00/5.0 |
| Nelly | 2 | $7,148 | 134 | 4.93/5.0 |
| Joelle | 1 | $4,470 | 87 | 4.84/5.0 |
Analyzing the strategies of top hosts, such as their property selection, pricing, and guest communication, can offer valuable lessons for optimizing your own Airbnb operations in La Chapelle-des-Marais.
Dive Deeper: Advanced La Chapelle-des-Marais STR Market Data (2025)
Ready to unlock more insights? AirROI provides access to advanced metrics and comprehensive Airbnb data for La Chapelle-des-Marais. Explore detailed analytics beyond this report to refine your investment strategy, optimize pricing, and maximize your vacation rental profits.
Explore Advanced MetricsLa Chapelle-des-Marais Short-Term Rental Market Composition (2025): Property & Room Types
Room Type Distribution
Property Type Distribution
Market Composition Insights for La Chapelle-des-Marais
- The La Chapelle-des-Marais Airbnb market composition is heavily skewed towards Entire Home/Apt listings, which make up 78.9% of the 19 active rentals. This indicates strong guest preference for privacy and space.
- Looking at the property type distribution in La Chapelle-des-Marais, House properties are the most common (68.4%), reflecting the local real estate landscape.
- Houses represent a significant 68.4% portion, catering likely to families or larger groups.
- The presence of 21.1% Hotel/Boutique listings indicates integration with traditional hospitality.
La Chapelle-des-Marais Airbnb Room Capacity Analysis (2025): Bedroom Distribution
Distribution of Listings by Number of Bedrooms
Room Capacity Insights for La Chapelle-des-Marais
- The dominant room capacity in La Chapelle-des-Marais is 2 bedrooms listings, making up 36.8% of the market. This suggests a strong demand for properties suitable for couples or solo travelers.
- Together, 2 bedrooms and 1 bedroom properties represent 68.4% of the active Airbnb listings in La Chapelle-des-Marais, indicating a high concentration in these sizes.
La Chapelle-des-Marais Vacation Rental Guest Capacity Trends (2025)
Distribution of Listings by Guest Capacity
Guest Capacity Insights for La Chapelle-des-Marais
- The most common guest capacity trend in La Chapelle-des-Marais vacation rentals is listings accommodating 4 guests (36.8%). This suggests the primary traveler segment is likely small families or groups.
- Properties designed for 4 guests and 2 guests dominate the La Chapelle-des-Marais STR market, accounting for 52.6% of listings.
- 26.3% of properties accommodate 6+ guests, serving the market segment for larger families or group travel in La Chapelle-des-Marais.
- On average, properties in La Chapelle-des-Marais are equipped to host 3.8 guests.
La Chapelle-des-Marais Airbnb Booking Patterns (2025): Available vs. Booked Days
Available Days Distribution
Booked Days Distribution
Booking Pattern Insights for La Chapelle-des-Marais
- The most common availability pattern in La Chapelle-des-Marais falls within the 271-366 days range, representing 42.1% of listings. This suggests many properties have significant open periods on their calendars.
- Approximately 68.4% of listings show high availability (181+ days open annually), indicating potential for increased bookings or specific owner usage patterns.
- For booked days, the 31-90 days range is most frequent in La Chapelle-des-Marais (31.6%), reflecting common guest stay durations or potential owner blocking patterns.
- A notable 31.6% of properties secure long booking periods (181+ days booked per year), highlighting successful long-term rental strategies or significant owner usage.
La Chapelle-des-Marais Airbnb Minimum Stay Requirements Analysis
Distribution of Listings by Minimum Night Requirement
1 Night
9 listings
47.4% of total
2 Nights
4 listings
21.1% of total
3 Nights
1 listings
5.3% of total
4-6 Nights
1 listings
5.3% of total
7-29 Nights
2 listings
10.5% of total
30+ Nights
2 listings
10.5% of total
Key Insights
- The most prevalent minimum stay requirement in La Chapelle-des-Marais is 1 Night, adopted by 47.4% of listings. This highlights the market's preference for shorter, flexible bookings.
- A strong majority (68.5%) of the La Chapelle-des-Marais Airbnb data shows acceptance of very short stays (1-2 nights), indicating a dynamic, high-turnover market.
- A significant segment (10.5%) caters to monthly stays (30+ nights) in La Chapelle-des-Marais, pointing to opportunities in the extended-stay market.
Recommendations
- Align with the market by considering a 1 Night minimum stay, as 47.4% of La Chapelle-des-Marais hosts use this setting.
- Explore offering discounts for stays of 30+ nights to attract the 10.5% of the market seeking extended stays.
- Adjust minimum nights based on seasonality – potentially shorter during low season and longer during peak demand periods in La Chapelle-des-Marais.
La Chapelle-des-Marais Airbnb Cancellation Policy Trends Analysis (2025)
Flexible
8 listings
50% of total
Moderate
6 listings
37.5% of total
Firm
1 listings
6.3% of total
Strict
1 listings
6.3% of total
Cancellation Policy Insights for La Chapelle-des-Marais
- The prevailing Airbnb cancellation policy trend in La Chapelle-des-Marais is Flexible, used by 50% of listings.
- The market strongly favors guest-friendly terms, with 87.5% of listings offering Flexible or Moderate policies. This suggests guests in La Chapelle-des-Marais may expect booking flexibility.
- Strict cancellation policies are quite rare (6.3%), potentially making listings with this policy less competitive unless justified by high demand or property type.
Recommendations for Hosts
- Consider adopting a Flexible policy to align with the 50% market standard in La Chapelle-des-Marais.
- Using a Strict policy might deter some guests, as only 6.3% of listings use it. Evaluate if potential revenue protection outweighs possible lower booking rates.
- Regularly review your cancellation policy against competitors and market demand shifts in La Chapelle-des-Marais.
La Chapelle-des-Marais STR Booking Lead Time Analysis (2025)
Average Booking Lead Time by Month
Booking Lead Time Insights for La Chapelle-des-Marais
- The overall average booking lead time for vacation rentals in La Chapelle-des-Marais is 46 days.
- Guests book furthest in advance for stays during July (average 85 days), likely coinciding with peak travel demand or local events.
- The shortest booking windows occur for stays in March (average 18 days), indicating more last-minute travel plans during this time.
- Seasonally, Summer (77 days avg.) sees the longest lead times, while Winter (38 days avg.) has the shortest, reflecting typical travel planning cycles.
Recommendations for Hosts
- Use the overall average lead time (46 days) as a baseline for your pricing and availability strategy in La Chapelle-des-Marais.
- For July stays, consider implementing length-of-stay discounts or slightly higher rates for bookings made less than 85 days out to capitalize on advance planning.
- Target marketing efforts for the Summer season well in advance (at least 77 days) to capture early planners.
- Monitor your own booking lead times against these La Chapelle-des-Marais averages to identify opportunities for dynamic pricing adjustments.
Popular & Essential Airbnb Amenities in La Chapelle-des-Marais (2025)
Amenity Prevalence
Amenity Insights for La Chapelle-des-Marais
- Essential amenities in La Chapelle-des-Marais that guests expect include: TV, Heating, Free parking on premises. Lacking these (any) could significantly impact bookings.
- Popular amenities like Kitchen, Smoke alarm, Hangers are common but not universal. Offering these can provide a competitive edge.
Recommendations for Hosts
- Ensure your listing includes all essential amenities for La Chapelle-des-Marais: TV, Heating, Free parking on premises.
- Consider adding popular differentiators like Kitchen or Smoke alarm to increase appeal.
- Highlight unique or less common amenities you offer (e.g., hot tub, dedicated workspace, EV charger) in your listing description and photos.
- Regularly check competitor amenities in La Chapelle-des-Marais to stay competitive.
La Chapelle-des-Marais Airbnb Guest Demographics & Profile Analysis (2025)
Guest Profile Summary for La Chapelle-des-Marais
- The typical guest profile for Airbnb in La Chapelle-des-Marais consists of primarily domestic travelers (96%), often arriving from nearby Nantes, typically belonging to the Post-2000s (Gen Z/Alpha) group (50%), primarily speaking French or English.
- Domestic travelers account for 95.8% of guests.
- Key international markets include France (95.8%) and Ireland (1.1%).
- Top languages spoken are French (49.7%) followed by English (29.7%).
- A significant demographic segment is the Post-2000s (Gen Z/Alpha) group, representing 50% of guests.
Recommendations for Hosts
- Target domestic marketing efforts towards travelers from Nantes and Paris.
- Tailor amenities and listing descriptions to appeal to the dominant Post-2000s (Gen Z/Alpha) demographic (e.g., highlight fast WiFi, smart home features, local guides).
- Highlight unique local experiences or amenities relevant to the primary guest profile.
- Consider seasonal promotions aligned with peak travel times for key origin markets.
Nearby Short-Term Rental Market Comparison
How does the La Chapelle-des-Marais Airbnb market stack up against its neighbors? Compare key performance metrics like average monthly revenue, ADR, and occupancy rates in surrounding areas to understand the broader regional STR landscape.
| Market | Active Properties | Monthly Revenue | Daily Rate | Avg. Occupancy |
|---|---|---|---|---|
| Le Bois-Plage-en-Ré | 303 | $2,528 | $284.63 | 45% |
| Sainte-Florence | 10 | $2,445 | $233.78 | 46% |
| La Flotte | 396 | $2,382 | $236.53 | 46% |
| Île-de-Bréhat | 46 | $2,254 | $221.52 | 45% |
| La Couarde-sur-Mer | 218 | $2,188 | $259.23 | 41% |
| Le Parc | 13 | $2,138 | $173.31 | 43% |
| Ombrée d'Anjou | 21 | $2,063 | $213.63 | 35% |
| Lanmodez | 19 | $2,050 | $219.93 | 42% |
| Île-aux-Moines | 98 | $2,048 | $236.18 | 42% |
| Laillé | 12 | $2,046 | $116.65 | 37% |