Durtal Airbnb Market Analysis 2025: Short Term Rental Data & Vacation Rental Statistics in Pays de la Loire, France
Is Airbnb profitable in Durtal in 2025? Explore comprehensive Airbnb analytics for Durtal, Pays de la Loire, France to uncover income potential. This 2025 STR market report for Durtal, based on AirROI data from April 2024 to March 2025, reveals key trends in the niche market of 29 active listings.
Whether you're considering an Airbnb investment in Durtal, optimizing your existing vacation rental, or exploring rental arbitrage opportunities, understanding the Durtal Airbnb data is crucial. Leveraging the low regulation environment is key to maximizing your short term rental income potential. Let's dive into the specifics.
Key Durtal Airbnb Performance Metrics Overview
Monthly Airbnb Revenue Variations & Income Potential in Durtal (2025)
Understanding the monthly revenue variations for Airbnb listings in Durtal is key to maximizing your short term rental income potential. Seasonality significantly impacts earnings. Our analysis, based on data from the past 12 months, shows that the peak revenue month for STRs in Durtal is typically August, while January often presents the lowest earnings, highlighting opportunities for strategic pricing adjustments during shoulder and low seasons. Explore the typical Airbnb income in Durtal across different performance tiers:
- Best-in-class properties (Top 10%) achieve $3,834+ monthly, often utilizing dynamic pricing and superior guest experiences.
- Strong performing properties (Top 25%) earn $1,585 or more, indicating effective management and desirable locations/amenities.
- Typical properties (Median) generate around $881 per month, representing the average market performance.
- Entry-level properties (Bottom 25%) see earnings around $503, often with potential for optimization.
Average Monthly Airbnb Earnings Trend in Durtal
Durtal Airbnb Occupancy Rate Trends (2025)
Maximize your bookings by understanding the Durtal STR occupancy trends. Seasonal demand shifts significantly influence how often properties are booked. Typically, Augustsees the highest demand (peak season occupancy), while January experiences the lowest (low season). Effective strategies, like adjusting minimum stays or offering promotions, can boost occupancy during slower periods. Here's how different property tiers perform in Durtal:
- Best-in-class properties (Top 10%) achieve 55%+ occupancy, indicating high desirability and potentially optimized availability.
- Strong performing properties (Top 25%) maintain 37% or higher occupancy, suggesting good market fit and guest satisfaction.
- Typical properties (Median) have an occupancy rate around 24%.
- Entry-level properties (Bottom 25%) average 13% occupancy, potentially facing higher vacancy.
Average Monthly Occupancy Rate Trend in Durtal
Average Daily Rate (ADR) Airbnb Trends in Durtal (2025)
Effective short term rental pricing strategy in Durtal involves understanding monthly ADR fluctuations. The Average Daily Rate (ADR) for Airbnb in Durtal typically peaks in December and dips lowest during April. Leveraging Airbnb dynamic pricing tools or strategies based on this seasonality can significantly boost revenue. Here's a look at the typical nightly rates achieved:
- Best-in-class properties (Top 10%) command rates of $442+ per night, often due to premium features or locations.
- Strong performing properties (Top 25%) achieve nightly rates of $189 or more.
- Typical properties (Median) charge around $103 per night.
- Entry-level properties (Bottom 25%) earn around $70 per night.
Average Daily Rate (ADR) Trend by Month in Durtal
Get Live Durtal Market Intelligence 👇

Explore Real-time Analytics
Airbnb Seasonality Analysis & Trends in Durtal (2025)
Peak Season (August, July, December)
- Revenue averages $2,757 per month
- Occupancy rates average 41.2%
- Daily rates average $195
Shoulder Season
- Revenue averages $1,514 per month
- Occupancy maintains around 25.8%
- Daily rates hold near $190
Low Season (January, February, March)
- Revenue drops to average $630 per month
- Occupancy decreases to average 18.0%
- Daily rates adjust to average $203
Seasonality Insights for Durtal
- The Airbnb seasonality in Durtal shows highly seasonal trends requiring careful strategy. While the sections above show seasonal averages, it's also insightful to look at the extremes:
- During the high season, the absolute peak month showcases Durtal's highest earning potential, with monthly revenues capable of climbing to $3,509, occupancy reaching a high of 46.4%, and ADRs peaking at $207.
- Conversely, the slowest single month of the year, typically falling within the low season, marks the market's lowest point. In this month, revenue might dip to $554, occupancy could drop to 16.6%, and ADRs may adjust down to $181.
- Understanding both the seasonal averages and these monthly peaks and troughs in revenue, occupancy, and ADR is crucial for maximizing your Airbnb profit potential in Durtal.
Seasonal Strategies for Maximizing Profit
- Peak Season: Maximize revenue through premium pricing and potentially longer minimum stays. Ensure high availability.
- Low Season: Offer competitive pricing, special promotions (e.g., extended stay discounts), and flexible cancellation policies. Target off-season travelers like remote workers or budget-conscious guests.
- Shoulder Seasons: Implement dynamic pricing that balances peak and low rates. Target weekend travelers or specific events. Offer slightly more flexible terms than peak season.
- Regularly analyze your own performance against these Durtal seasonality benchmarks and adjust your pricing and availability strategy accordingly.
Best Areas for Airbnb Investment in Durtal (2025)
Exploring the top neighborhoods for short-term rentals in Durtal? This section highlights key areas, outlining why they are attractive for hosts and guests, along with notable local attractions. Consider these locations based on your target guest profile and investment strategy.
| Neighborhood / Area | Why Host Here? (Target Guests & Appeal) | Key Attractions & Landmarks |
|---|---|---|
| Historic Center | Charming area with beautiful medieval architecture and close to local attractions. Ideal for tourists wanting to experience the rich history of Durtal. | Durtal Castle, Church of Saint Michael, Town Hall, Medieval streets, Local boutiques |
| Le Parc des Marechaux | A serene area offering green spaces and parks. Perfect for families and travelers looking for relaxation and nature. | Parc des Marechaux, Walking trails, Picnic areas, Playgrounds |
| La Vallée de la Loire | Scenic region with breathtaking views of the Loire River. Attracts nature lovers and those seeking outdoor activities. | Loire River, Cycling paths, Fishing spots, Nature walks |
| Local Wineries | Durtal is located near some fine vineyards. A great choice for guests interested in wine tasting and local gastronomy. | Wine tasting tours, Vineyard visits, Gourmet restaurants |
| Cultural Hub | This area hosts various cultural festivals throughout the year. Great for those wanting to immerse themselves in local culture. | Local festivals, Theater performances, Art exhibitions |
| Points of Interest | Close proximity to popular tourist spots, perfect for day trips and exploring the wider region of Pays de la Loire. | Château de Brissac, Angers, Le Puy du Fou |
| Market Town | Famous for its local markets offering fresh produce and unique goods. Great for culinary enthusiasts and shoppers. | Weekly market, Local food vendors, Artisan shops |
| Maine River Area | Beautiful riverside area to unwind and enjoy water activities. Attractive for families and adventure seekers alike. | Kayaking, Fishing, Scenic walks along the river |
Understanding Airbnb License Requirements & STR Laws in Durtal (2025)
While Durtal, Pays de la Loire, France currently shows low STR regulations, specific Airbnb license requirements might still exist or change. Always verify the latest short term rental regulations and Airbnb license requirements directly with local government authorities for Durtal to ensure full compliance before hosting.
(Source: AirROI data, 2025, based on 7% licensed listings)
Top Performing Airbnb Properties in Durtal (2025)
Benchmark your potential! Explore examples of top-performing Airbnb properties in Durtalbased on Trailing Twelve Month (TTM) revenue. Analyze their characteristics, revenue, occupancy rate, and ADR to understand what drives success in this market.
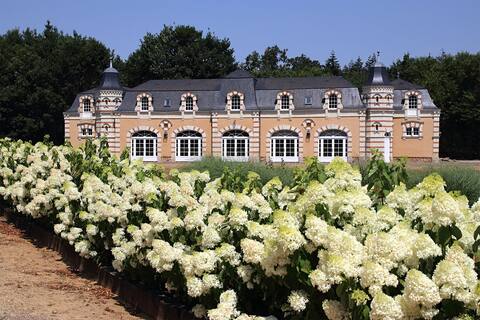
Beautiful amazing holiday rental with pool
Entire Place • 8 bedrooms

La Maison du Jardinier in Château de Chambiers
Entire Place • 3 bedrooms
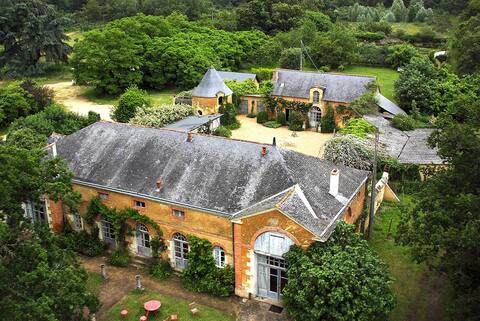
L'Orangerie at Château de Chambiers
Entire Place • 3 bedrooms

Pavillon de France at Château de Chambiers
Entire Place • 1 bedroom
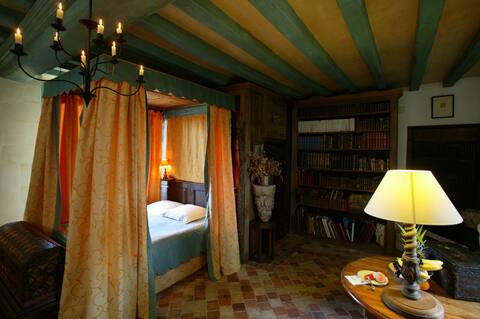
B&B Camp du Drap d'or at the Castle
Private Room • 1 bedroom

the gite de l 'orangerie
Entire Place • 1 bedroom
Note: Performance varies based on location, size, amenities, seasonality, and management quality. Data reflects the past 12 months.
Top Performing Airbnb Hosts in Durtal (2025)
Learn from the best! This table showcases top-performing Airbnb hosts in Durtal based on the number of properties managed and estimated total revenue over the past year. Analyze their scale and performance metrics.
| Host Name | Properties | Grossing Revenue | Stay Reviews | Avg Rating |
|---|---|---|---|---|
| Anne | 5 | $163,757 | 41 | 3.82/5.0 |
| Arnaud | 1 | $85,808 | 16 | 5.00/5.0 |
| Nathalie | 3 | $41,026 | 45 | 4.91/5.0 |
| Yamakado | 4 | $39,052 | 57 | 4.93/5.0 |
| Peter & Lolita | 2 | $21,816 | 303 | 4.54/5.0 |
| Stanislas | 2 | $18,295 | 96 | 5.00/5.0 |
| Bozena,Zofia | 3 | $18,036 | 168 | 4.79/5.0 |
| Pascale | 2 | $17,916 | 356 | 4.95/5.0 |
| L'Atelier Déco Du Bord Du Loir | 1 | $10,507 | 35 | 4.80/5.0 |
| Kevin | 1 | $9,623 | 25 | 4.92/5.0 |
Analyzing the strategies of top hosts, such as their property selection, pricing, and guest communication, can offer valuable lessons for optimizing your own Airbnb operations in Durtal.
Dive Deeper: Advanced Durtal STR Market Data (2025)
Ready to unlock more insights? AirROI provides access to advanced metrics and comprehensive Airbnb data for Durtal. Explore detailed analytics beyond this report to refine your investment strategy, optimize pricing, and maximize your vacation rental profits.
Explore Advanced MetricsDurtal Short-Term Rental Market Composition (2025): Property & Room Types
Room Type Distribution
Property Type Distribution
Market Composition Insights for Durtal
- The Durtal Airbnb market composition is heavily skewed towards Entire Home/Apt listings, which make up 58.6% of the 29 active rentals. This indicates strong guest preference for privacy and space.
- However, a notable 41.4% share for Private Rooms suggests opportunities for budget-conscious travelers or hosts renting out spare rooms.
- Looking at the property type distribution in Durtal, House properties are the most common (31%), reflecting the local real estate landscape.
- Houses represent a significant 31% portion, catering likely to families or larger groups.
- The presence of 31% Hotel/Boutique listings indicates integration with traditional hospitality.
- Smaller segments like unique stays (combined 3.4%) offer potential for unique stay experiences.
Durtal Airbnb Room Capacity Analysis (2025): Bedroom Distribution
Distribution of Listings by Number of Bedrooms
Room Capacity Insights for Durtal
- The dominant room capacity in Durtal is 1 bedroom listings, making up 44.8% of the market. This suggests a strong demand for properties suitable for couples or solo travelers.
- Together, 1 bedroom and 2 bedrooms properties represent 55.1% of the active Airbnb listings in Durtal, indicating a high concentration in these sizes.
Durtal Vacation Rental Guest Capacity Trends (2025)
Distribution of Listings by Guest Capacity
Guest Capacity Insights for Durtal
- The most common guest capacity trend in Durtal vacation rentals is listings accommodating 2 guests (27.6%). This suggests the primary traveler segment is likely couples or solo travelers.
- Properties designed for 2 guests and 4 guests dominate the Durtal STR market, accounting for 44.8% of listings.
- 13.8% of properties accommodate 6+ guests, serving the market segment for larger families or group travel in Durtal.
- On average, properties in Durtal are equipped to host 2.9 guests.
Durtal Airbnb Booking Patterns (2025): Available vs. Booked Days
Available Days Distribution
Booked Days Distribution
Booking Pattern Insights for Durtal
- The most common availability pattern in Durtal falls within the 271-366 days range, representing 55.2% of listings. This suggests many properties have significant open periods on their calendars.
- Approximately 96.6% of listings show high availability (181+ days open annually), indicating potential for increased bookings or specific owner usage patterns.
- For booked days, the 31-90 days range is most frequent in Durtal (51.7%), reflecting common guest stay durations or potential owner blocking patterns.
- A notable 3.4% of properties secure long booking periods (181+ days booked per year), highlighting successful long-term rental strategies or significant owner usage.
Durtal Airbnb Minimum Stay Requirements Analysis
Distribution of Listings by Minimum Night Requirement
1 Night
20 listings
69% of total
2 Nights
5 listings
17.2% of total
4-6 Nights
3 listings
10.3% of total
30+ Nights
1 listings
3.4% of total
Key Insights
- The most prevalent minimum stay requirement in Durtal is 1 Night, adopted by 69% of listings. This highlights the market's preference for shorter, flexible bookings.
- A strong majority (86.2%) of the Durtal Airbnb data shows acceptance of very short stays (1-2 nights), indicating a dynamic, high-turnover market.
Recommendations
- Align with the market by considering a 1 Night minimum stay, as 69% of Durtal hosts use this setting.
- Adjust minimum nights based on seasonality – potentially shorter during low season and longer during peak demand periods in Durtal.
Durtal Airbnb Cancellation Policy Trends Analysis (2025)
Flexible
8 listings
28.6% of total
Moderate
14 listings
50% of total
Strict
6 listings
21.4% of total
Cancellation Policy Insights for Durtal
- The prevailing Airbnb cancellation policy trend in Durtal is Moderate, used by 50% of listings.
- The market strongly favors guest-friendly terms, with 78.6% of listings offering Flexible or Moderate policies. This suggests guests in Durtal may expect booking flexibility.
Recommendations for Hosts
- Consider adopting a Moderate policy to align with the 50% market standard in Durtal.
- Regularly review your cancellation policy against competitors and market demand shifts in Durtal.
Durtal STR Booking Lead Time Analysis (2025)
Average Booking Lead Time by Month
Booking Lead Time Insights for Durtal
- The overall average booking lead time for vacation rentals in Durtal is 47 days.
- Guests book furthest in advance for stays during June (average 79 days), likely coinciding with peak travel demand or local events.
- The shortest booking windows occur for stays in January (average 25 days), indicating more last-minute travel plans during this time.
- Seasonally, Summer (70 days avg.) sees the longest lead times, while Winter (39 days avg.) has the shortest, reflecting typical travel planning cycles.
Recommendations for Hosts
- Use the overall average lead time (47 days) as a baseline for your pricing and availability strategy in Durtal.
- For June stays, consider implementing length-of-stay discounts or slightly higher rates for bookings made less than 79 days out to capitalize on advance planning.
- Target marketing efforts for the Summer season well in advance (at least 70 days) to capture early planners.
- Monitor your own booking lead times against these Durtal averages to identify opportunities for dynamic pricing adjustments.
Popular & Essential Airbnb Amenities in Durtal (2025)
Amenity Prevalence
Amenity Insights for Durtal
- Essential amenities in Durtal that guests expect include: Hot water, Heating. Lacking these (any) could significantly impact bookings.
- Popular amenities like Free parking on premises, Smoke alarm, Hangers are common but not universal. Offering these can provide a competitive edge.
Recommendations for Hosts
- Ensure your listing includes all essential amenities for Durtal: Hot water, Heating.
- Consider adding popular differentiators like Free parking on premises or Smoke alarm to increase appeal.
- Highlight unique or less common amenities you offer (e.g., hot tub, dedicated workspace, EV charger) in your listing description and photos.
- Regularly check competitor amenities in Durtal to stay competitive.
Durtal Airbnb Guest Demographics & Profile Analysis (2025)
Guest Profile Summary for Durtal
- The typical guest profile for Airbnb in Durtal consists of primarily domestic travelers (82%), often arriving from nearby Paris, typically belonging to the Post-2000s (Gen Z/Alpha) group (50%), primarily speaking French or English.
- Domestic travelers account for 82.4% of guests.
- Key international markets include France (82.4%) and United Kingdom (6%).
- Top languages spoken are French (46.2%) followed by English (31.1%).
- A significant demographic segment is the Post-2000s (Gen Z/Alpha) group, representing 50% of guests.
Recommendations for Hosts
- Target domestic marketing efforts towards travelers from Paris and Rennes.
- Tailor amenities and listing descriptions to appeal to the dominant Post-2000s (Gen Z/Alpha) demographic (e.g., highlight fast WiFi, smart home features, local guides).
- Highlight unique local experiences or amenities relevant to the primary guest profile.
- Consider seasonal promotions aligned with peak travel times for key origin markets.
Nearby Short-Term Rental Market Comparison
How does the Durtal Airbnb market stack up against its neighbors? Compare key performance metrics like average monthly revenue, ADR, and occupancy rates in surrounding areas to understand the broader regional STR landscape.
| Market | Active Properties | Monthly Revenue | Daily Rate | Avg. Occupancy |
|---|---|---|---|---|
| Coteaux-sur-Loire | 19 | $3,328 | $270.00 | 41% |
| Moulins-le-Carbonnel | 11 | $3,213 | $320.85 | 35% |
| Villiers-sur-Loir | 10 | $2,967 | $216.51 | 41% |
| Artannes-sur-Indre | 21 | $2,949 | $275.91 | 41% |
| Vallon-sur-Gée | 11 | $2,913 | $379.01 | 30% |
| La Ferté-en-Ouche | 19 | $2,854 | $258.24 | 39% |
| Tourouvre au Perche | 31 | $2,842 | $237.49 | 43% |
| Bourneau | 11 | $2,747 | $442.07 | 35% |
| Nuaillé-d'Aunis | 10 | $2,741 | $373.83 | 37% |
| Ambillou | 18 | $2,701 | $370.97 | 28% |