Commequiers Airbnb Market Analysis 2025: Short Term Rental Data & Vacation Rental Statistics in Pays de la Loire, France
Is Airbnb profitable in Commequiers in 2025? Explore comprehensive Airbnb analytics for Commequiers, Pays de la Loire, France to uncover income potential. This 2025 STR market report for Commequiers, based on AirROI data from April 2024 to March 2025, reveals key trends in the niche market of 24 active listings.
Whether you're considering an Airbnb investment in Commequiers, optimizing your existing vacation rental, or exploring rental arbitrage opportunities, understanding the Commequiers Airbnb data is crucial. Leveraging the low regulation environment is key to maximizing your short term rental income potential. Let's dive into the specifics.
Key Commequiers Airbnb Performance Metrics Overview
Monthly Airbnb Revenue Variations & Income Potential in Commequiers (2025)
Understanding the monthly revenue variations for Airbnb listings in Commequiers is key to maximizing your short term rental income potential. Seasonality significantly impacts earnings. Our analysis, based on data from the past 12 months, shows that the peak revenue month for STRs in Commequiers is typically August, while February often presents the lowest earnings, highlighting opportunities for strategic pricing adjustments during shoulder and low seasons. Explore the typical Airbnb income in Commequiers across different performance tiers:
- Best-in-class properties (Top 10%) achieve $2,711+ monthly, often utilizing dynamic pricing and superior guest experiences.
- Strong performing properties (Top 25%) earn $1,939 or more, indicating effective management and desirable locations/amenities.
- Typical properties (Median) generate around $990 per month, representing the average market performance.
- Entry-level properties (Bottom 25%) see earnings around $538, often with potential for optimization.
Average Monthly Airbnb Earnings Trend in Commequiers
Commequiers Airbnb Occupancy Rate Trends (2025)
Maximize your bookings by understanding the Commequiers STR occupancy trends. Seasonal demand shifts significantly influence how often properties are booked. Typically, Augustsees the highest demand (peak season occupancy), while April experiences the lowest (low season). Effective strategies, like adjusting minimum stays or offering promotions, can boost occupancy during slower periods. Here's how different property tiers perform in Commequiers:
- Best-in-class properties (Top 10%) achieve 69%+ occupancy, indicating high desirability and potentially optimized availability.
- Strong performing properties (Top 25%) maintain 50% or higher occupancy, suggesting good market fit and guest satisfaction.
- Typical properties (Median) have an occupancy rate around 29%.
- Entry-level properties (Bottom 25%) average 15% occupancy, potentially facing higher vacancy.
Average Monthly Occupancy Rate Trend in Commequiers
Average Daily Rate (ADR) Airbnb Trends in Commequiers (2025)
Effective short term rental pricing strategy in Commequiers involves understanding monthly ADR fluctuations. The Average Daily Rate (ADR) for Airbnb in Commequiers typically peaks in July and dips lowest during March. Leveraging Airbnb dynamic pricing tools or strategies based on this seasonality can significantly boost revenue. Here's a look at the typical nightly rates achieved:
- Best-in-class properties (Top 10%) command rates of $215+ per night, often due to premium features or locations.
- Strong performing properties (Top 25%) achieve nightly rates of $137 or more.
- Typical properties (Median) charge around $106 per night.
- Entry-level properties (Bottom 25%) earn around $72 per night.
Average Daily Rate (ADR) Trend by Month in Commequiers
Get Live Commequiers Market Intelligence 👇

Explore Real-time Analytics
Airbnb Seasonality Analysis & Trends in Commequiers (2025)
Peak Season (August, July, September)
- Revenue averages $2,103 per month
- Occupancy rates average 54.5%
- Daily rates average $124
Shoulder Season
- Revenue averages $1,201 per month
- Occupancy maintains around 27.8%
- Daily rates hold near $116
Low Season (January, February, March)
- Revenue drops to average $825 per month
- Occupancy decreases to average 28.5%
- Daily rates adjust to average $110
Seasonality Insights for Commequiers
- The Airbnb seasonality in Commequiers shows highly seasonal trends requiring careful strategy. While the sections above show seasonal averages, it's also insightful to look at the extremes:
- During the high season, the absolute peak month showcases Commequiers's highest earning potential, with monthly revenues capable of climbing to $2,716, occupancy reaching a high of 65.9%, and ADRs peaking at $127.
- Conversely, the slowest single month of the year, typically falling within the low season, marks the market's lowest point. In this month, revenue might dip to $742, occupancy could drop to 18.1%, and ADRs may adjust down to $109.
- Understanding both the seasonal averages and these monthly peaks and troughs in revenue, occupancy, and ADR is crucial for maximizing your Airbnb profit potential in Commequiers.
Seasonal Strategies for Maximizing Profit
- Peak Season: Maximize revenue through premium pricing and potentially longer minimum stays. Ensure high availability.
- Low Season: Offer competitive pricing, special promotions (e.g., extended stay discounts), and flexible cancellation policies. Target off-season travelers like remote workers or budget-conscious guests.
- Shoulder Seasons: Implement dynamic pricing that balances peak and low rates. Target weekend travelers or specific events. Offer slightly more flexible terms than peak season.
- Regularly analyze your own performance against these Commequiers seasonality benchmarks and adjust your pricing and availability strategy accordingly.
Best Areas for Airbnb Investment in Commequiers (2025)
Exploring the top neighborhoods for short-term rentals in Commequiers? This section highlights key areas, outlining why they are attractive for hosts and guests, along with notable local attractions. Consider these locations based on your target guest profile and investment strategy.
| Neighborhood / Area | Why Host Here? (Target Guests & Appeal) | Key Attractions & Landmarks |
|---|---|---|
| Commequiers Village Center | Charming village center with traditional French architecture and a local market. Ideal for tourists wanting an authentic French experience. | Local Market, Église Saint-Pierre, Lacs de Commequiers, Scenic countryside trails |
| Nearby Beaches | Proximity to beautiful sandy beaches like Saint-Jean-de-Monts and Saint-Gilles-Croix-de-Vie. Excellent for vacationers looking for sun and sea. | Saint-Jean-de-Monts Beach, Saint-Gilles-Croix-de-Vie Beach, Promenade des Plages, Water sports and activities |
| Puy du Fou | Famed historical theme park located nearby. Attracts visitors from all over France and beyond, providing a unique entertainment experience. | Puy du Fou Park, Cinescenie show, Historical reenactments, Family entertainment |
| Vendee Coastal Towns | Access to picturesque coastal towns in the Vendée department, each with unique charm. Great for families and beach lovers. | Les Sables-d'Olonne, Noirmoutier-en-l'Île, Île d'Yeu, Coastal bike trails |
| Natural Reserves | Surrounded by beautiful natural reserves, ideal for nature lovers and outdoor activities. | Marais Poitevin, La Dune du Pilat, Nature walks and hiking trails |
| Cultural Heritage Sites | Rich cultural heritage with historical sites and local festivals. Perfect for guests interested in history and local culture. | Château de Tiffauges, Local art fairs, Traditional festivals |
| Wine and Gastronomy Tour | Located in the Loire valley known for its wine production and gastronomy. Attracts food and wine enthusiasts. | Local vineyards, Wine tasting tours, Gourmet restaurants |
| Family-Friendly Activities | Great for families with plenty of activities for children. A safe and inviting environment for family holidays. | Le Grand Parc du Puy du Fou, Aquatic centers, Playgrounds and parks |
Understanding Airbnb License Requirements & STR Laws in Commequiers (2025)
While Commequiers, Pays de la Loire, France currently shows low STR regulations, specific Airbnb license requirements might still exist or change. Always verify the latest short term rental regulations and Airbnb license requirements directly with local government authorities for Commequiers to ensure full compliance before hosting.
(Source: AirROI data, 2025, based on 4% licensed listings)
Top Performing Airbnb Properties in Commequiers (2025)
Benchmark your potential! Explore examples of top-performing Airbnb properties in Commequiersbased on Trailing Twelve Month (TTM) revenue. Analyze their characteristics, revenue, occupancy rate, and ADR to understand what drives success in this market.
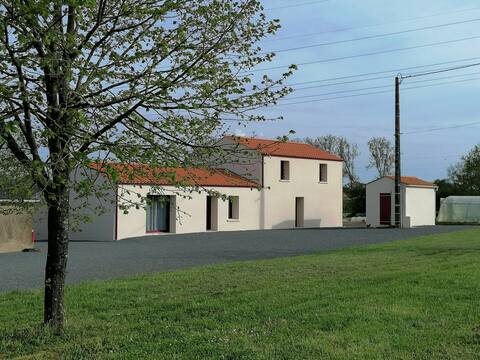
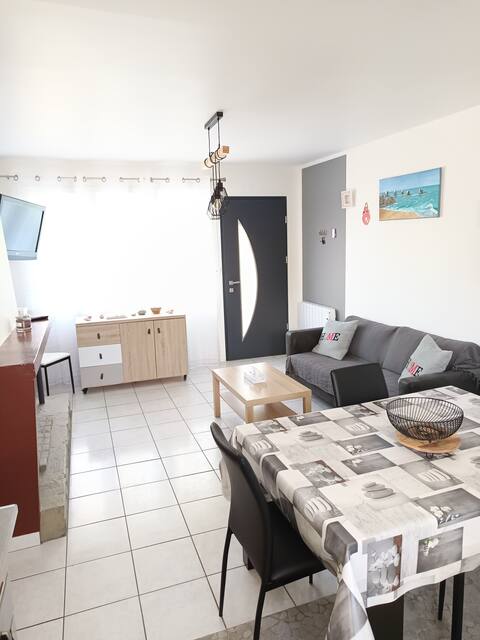
Comfortable holiday home 15 kms from the sea
Entire Place • 4 bedrooms
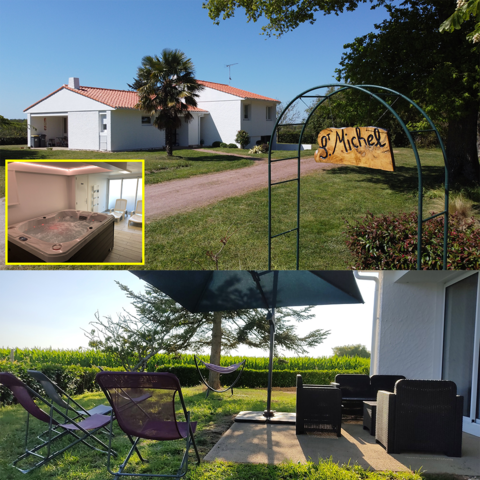
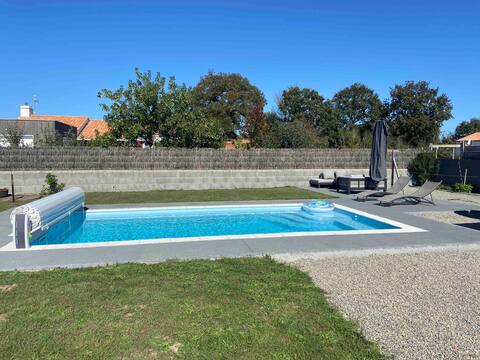
Holiday home with Spa Vendée, 10 to 12 pers.
Entire Place • 4 bedrooms
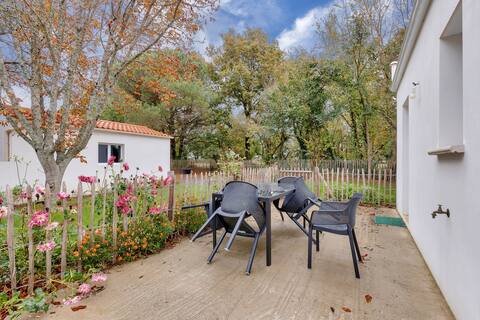
Vendée Countryside: House for 6 persons
Entire Place • 3 bedrooms
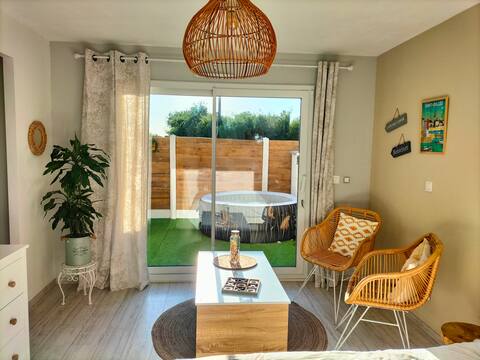
Our little cocoon with Spa, 15 min from the beaches
Entire Place • N/A
Commequiers, Vendée France
Entire Place • 3 bedrooms
Between tranquility and ocean.
Entire Place • 3 bedrooms
Note: Performance varies based on location, size, amenities, seasonality, and management quality. Data reflects the past 12 months.
Top Performing Airbnb Hosts in Commequiers (2025)
Learn from the best! This table showcases top-performing Airbnb hosts in Commequiers based on the number of properties managed and estimated total revenue over the past year. Analyze their scale and performance metrics.
| Host Name | Properties | Grossing Revenue | Stay Reviews | Avg Rating |
|---|---|---|---|---|
| Franck | 3 | $40,959 | 54 | 4.99/5.0 |
| Jacqueline | 1 | $34,504 | 9 | 5.00/5.0 |
| L'Équipe Hoomy Conciergerie | 4 | $32,776 | 26 | 4.62/5.0 |
| Guest Adom | 2 | $26,963 | 19 | 4.05/5.0 |
| Amélie Et Seb | 1 | $21,526 | 110 | 4.96/5.0 |
| Angelique | 1 | $17,601 | 20 | 4.90/5.0 |
| Romain | 1 | $15,624 | 61 | 4.84/5.0 |
| Steve | 1 | $11,422 | 16 | 5.00/5.0 |
| Didier | 1 | $11,226 | 4 | 5.00/5.0 |
| Philippe | 1 | $8,360 | 17 | 4.94/5.0 |
Analyzing the strategies of top hosts, such as their property selection, pricing, and guest communication, can offer valuable lessons for optimizing your own Airbnb operations in Commequiers.
Dive Deeper: Advanced Commequiers STR Market Data (2025)
Ready to unlock more insights? AirROI provides access to advanced metrics and comprehensive Airbnb data for Commequiers. Explore detailed analytics beyond this report to refine your investment strategy, optimize pricing, and maximize your vacation rental profits.
Explore Advanced MetricsCommequiers Short-Term Rental Market Composition (2025): Property & Room Types
Room Type Distribution
Property Type Distribution
Market Composition Insights for Commequiers
- The Commequiers Airbnb market composition is heavily skewed towards Entire Home/Apt listings, which make up 87.5% of the 24 active rentals. This indicates strong guest preference for privacy and space.
- Looking at the property type distribution in Commequiers, House properties are the most common (83.3%), reflecting the local real estate landscape.
- Houses represent a significant 83.3% portion, catering likely to families or larger groups.
- Smaller segments like outdoor/unique, others (combined 8.4%) offer potential for unique stay experiences.
Commequiers Airbnb Room Capacity Analysis (2025): Bedroom Distribution
Distribution of Listings by Number of Bedrooms
Room Capacity Insights for Commequiers
- The dominant room capacity in Commequiers is 3 bedrooms listings, making up 29.2% of the market. This suggests a strong demand for properties suitable for families or small groups.
- Together, 3 bedrooms and 1 bedroom properties represent 54.2% of the active Airbnb listings in Commequiers, indicating a high concentration in these sizes.
- A significant 37.5% of listings offer 3+ bedrooms, catering to larger groups and families seeking more space in Commequiers.
Commequiers Vacation Rental Guest Capacity Trends (2025)
Distribution of Listings by Guest Capacity
Guest Capacity Insights for Commequiers
- The most common guest capacity trend in Commequiers vacation rentals is listings accommodating 4 guests (33.3%). This suggests the primary traveler segment is likely small families or groups.
- Properties designed for 4 guests and 6 guests dominate the Commequiers STR market, accounting for 54.1% of listings.
- 41.7% of properties accommodate 6+ guests, serving the market segment for larger families or group travel in Commequiers.
- On average, properties in Commequiers are equipped to host 4.7 guests.
Commequiers Airbnb Booking Patterns (2025): Available vs. Booked Days
Available Days Distribution
Booked Days Distribution
Booking Pattern Insights for Commequiers
- The most common availability pattern in Commequiers falls within the 271-366 days range, representing 62.5% of listings. This suggests many properties have significant open periods on their calendars.
- Approximately 83.3% of listings show high availability (181+ days open annually), indicating potential for increased bookings or specific owner usage patterns.
- For booked days, the 31-90 days range is most frequent in Commequiers (37.5%), reflecting common guest stay durations or potential owner blocking patterns.
- A notable 16.7% of properties secure long booking periods (181+ days booked per year), highlighting successful long-term rental strategies or significant owner usage.
Commequiers Airbnb Minimum Stay Requirements Analysis
Distribution of Listings by Minimum Night Requirement
1 Night
3 listings
12.5% of total
2 Nights
11 listings
45.8% of total
3 Nights
4 listings
16.7% of total
7-29 Nights
1 listings
4.2% of total
30+ Nights
5 listings
20.8% of total
Key Insights
- The most prevalent minimum stay requirement in Commequiers is 2 Nights, adopted by 45.8% of listings. This highlights the market's preference for shorter, flexible bookings.
- A significant segment (20.8%) caters to monthly stays (30+ nights) in Commequiers, pointing to opportunities in the extended-stay market.
Recommendations
- Align with the market by considering a 2 Nights minimum stay, as 45.8% of Commequiers hosts use this setting.
- If feasible, allowing 1-night stays, especially midweek or during low season, could capture last-minute bookings, as only 12.5% currently do.
- A 2-night minimum appears standard (45.8%). Consider this for weekends or peak periods.
- Explore offering discounts for stays of 30+ nights to attract the 20.8% of the market seeking extended stays.
- Adjust minimum nights based on seasonality – potentially shorter during low season and longer during peak demand periods in Commequiers.
Commequiers Airbnb Cancellation Policy Trends Analysis (2025)
Super Strict 30 Days
4 listings
17.4% of total
Flexible
5 listings
21.7% of total
Moderate
7 listings
30.4% of total
Firm
4 listings
17.4% of total
Strict
3 listings
13% of total
Cancellation Policy Insights for Commequiers
- The prevailing Airbnb cancellation policy trend in Commequiers is Moderate, used by 30.4% of listings.
- There's a relatively balanced mix between guest-friendly (52.1%) and stricter (30.4%) policies, offering choices for different guest needs.
Recommendations for Hosts
- Consider adopting a Moderate policy to align with the 30.4% market standard in Commequiers.
- Using a Strict policy might deter some guests, as only 13% of listings use it. Evaluate if potential revenue protection outweighs possible lower booking rates.
- Regularly review your cancellation policy against competitors and market demand shifts in Commequiers.
Commequiers STR Booking Lead Time Analysis (2025)
Average Booking Lead Time by Month
Booking Lead Time Insights for Commequiers
- The overall average booking lead time for vacation rentals in Commequiers is 53 days.
- Guests book furthest in advance for stays during September (average 121 days), likely coinciding with peak travel demand or local events.
- The shortest booking windows occur for stays in March (average 19 days), indicating more last-minute travel plans during this time.
- Seasonally, Summer (93 days avg.) sees the longest lead times, while Winter (31 days avg.) has the shortest, reflecting typical travel planning cycles.
Recommendations for Hosts
- Use the overall average lead time (53 days) as a baseline for your pricing and availability strategy in Commequiers.
- For September stays, consider implementing length-of-stay discounts or slightly higher rates for bookings made less than 121 days out to capitalize on advance planning.
- Target marketing efforts for the Summer season well in advance (at least 93 days) to capture early planners.
- Monitor your own booking lead times against these Commequiers averages to identify opportunities for dynamic pricing adjustments.
Popular & Essential Airbnb Amenities in Commequiers (2025)
Amenity Prevalence
Amenity Insights for Commequiers
- Essential amenities in Commequiers that guests expect include: TV, Free parking on premises. Lacking these (any) could significantly impact bookings.
- Popular amenities like Smoke alarm, Hot water, Heating are common but not universal. Offering these can provide a competitive edge.
- Warning: Wifi is not universally provided but is considered essential globally. Ensure reliable Wifi is offered.
Recommendations for Hosts
- Ensure your listing includes all essential amenities for Commequiers: TV, Free parking on premises.
- Prioritize adding missing essentials: TV, Free parking on premises.
- Consider adding popular differentiators like Smoke alarm or Hot water to increase appeal.
- Highlight unique or less common amenities you offer (e.g., hot tub, dedicated workspace, EV charger) in your listing description and photos.
- Regularly check competitor amenities in Commequiers to stay competitive.
Commequiers Airbnb Guest Demographics & Profile Analysis (2025)
Guest Profile Summary for Commequiers
- The typical guest profile for Airbnb in Commequiers consists of primarily domestic travelers (96%), often arriving from nearby Tours, typically belonging to the Post-2000s (Gen Z/Alpha) group (50%), primarily speaking French or English.
- Domestic travelers account for 95.6% of guests.
- Key international markets include France (95.6%) and French Guiana (1.1%).
- Top languages spoken are French (57.1%) followed by English (32.5%).
- A significant demographic segment is the Post-2000s (Gen Z/Alpha) group, representing 50% of guests.
Recommendations for Hosts
- Target domestic marketing efforts towards travelers from Tours and Paris.
- Tailor amenities and listing descriptions to appeal to the dominant Post-2000s (Gen Z/Alpha) demographic (e.g., highlight fast WiFi, smart home features, local guides).
- Highlight unique local experiences or amenities relevant to the primary guest profile.
- Consider seasonal promotions aligned with peak travel times for key origin markets.
Nearby Short-Term Rental Market Comparison
How does the Commequiers Airbnb market stack up against its neighbors? Compare key performance metrics like average monthly revenue, ADR, and occupancy rates in surrounding areas to understand the broader regional STR landscape.
| Market | Active Properties | Monthly Revenue | Daily Rate | Avg. Occupancy |
|---|---|---|---|---|
| Vallon-sur-Gée | 11 | $2,913 | $379.01 | 30% |
| Bourneau | 11 | $2,747 | $442.07 | 35% |
| Nuaillé-d'Aunis | 10 | $2,741 | $373.83 | 37% |
| Le Bois-Plage-en-Ré | 303 | $2,528 | $284.63 | 45% |
| Chambellay | 11 | $2,525 | $255.24 | 34% |
| Sainte-Florence | 10 | $2,445 | $233.78 | 46% |
| Saint-Hippolyte | 10 | $2,443 | $204.98 | 44% |
| Abzac | 12 | $2,415 | $349.03 | 36% |
| La Flotte | 396 | $2,382 | $236.53 | 46% |
| Saint-Georges-des-Coteaux | 12 | $2,335 | $187.61 | 43% |