Clermont-Créans Airbnb Market Analysis 2025: Short Term Rental Data & Vacation Rental Statistics in Pays de la Loire, France
Is Airbnb profitable in Clermont-Créans in 2025? Explore comprehensive Airbnb analytics for Clermont-Créans, Pays de la Loire, France to uncover income potential. This 2025 STR market report for Clermont-Créans, based on AirROI data from April 2024 to March 2025, reveals key trends in the niche market of 21 active listings.
Whether you're considering an Airbnb investment in Clermont-Créans, optimizing your existing vacation rental, or exploring rental arbitrage opportunities, understanding the Clermont-Créans Airbnb data is crucial. Leveraging the low regulation environment is key to maximizing your short term rental income potential. Let's dive into the specifics.
Key Clermont-Créans Airbnb Performance Metrics Overview
Monthly Airbnb Revenue Variations & Income Potential in Clermont-Créans (2025)
Understanding the monthly revenue variations for Airbnb listings in Clermont-Créans is key to maximizing your short term rental income potential. Seasonality significantly impacts earnings. Our analysis, based on data from the past 12 months, shows that the peak revenue month for STRs in Clermont-Créans is typically August, while March often presents the lowest earnings, highlighting opportunities for strategic pricing adjustments during shoulder and low seasons. Explore the typical Airbnb income in Clermont-Créans across different performance tiers:
- Best-in-class properties (Top 10%) achieve $3,656+ monthly, often utilizing dynamic pricing and superior guest experiences.
- Strong performing properties (Top 25%) earn $2,525 or more, indicating effective management and desirable locations/amenities.
- Typical properties (Median) generate around $1,186 per month, representing the average market performance.
- Entry-level properties (Bottom 25%) see earnings around $573, often with potential for optimization.
Average Monthly Airbnb Earnings Trend in Clermont-Créans
Clermont-Créans Airbnb Occupancy Rate Trends (2025)
Maximize your bookings by understanding the Clermont-Créans STR occupancy trends. Seasonal demand shifts significantly influence how often properties are booked. Typically, Augustsees the highest demand (peak season occupancy), while March experiences the lowest (low season). Effective strategies, like adjusting minimum stays or offering promotions, can boost occupancy during slower periods. Here's how different property tiers perform in Clermont-Créans:
- Best-in-class properties (Top 10%) achieve 73%+ occupancy, indicating high desirability and potentially optimized availability.
- Strong performing properties (Top 25%) maintain 62% or higher occupancy, suggesting good market fit and guest satisfaction.
- Typical properties (Median) have an occupancy rate around 43%.
- Entry-level properties (Bottom 25%) average 23% occupancy, potentially facing higher vacancy.
Average Monthly Occupancy Rate Trend in Clermont-Créans
Average Daily Rate (ADR) Airbnb Trends in Clermont-Créans (2025)
Effective short term rental pricing strategy in Clermont-Créans involves understanding monthly ADR fluctuations. The Average Daily Rate (ADR) for Airbnb in Clermont-Créans typically peaks in August and dips lowest during February. Leveraging Airbnb dynamic pricing tools or strategies based on this seasonality can significantly boost revenue. Here's a look at the typical nightly rates achieved:
- Best-in-class properties (Top 10%) command rates of $218+ per night, often due to premium features or locations.
- Strong performing properties (Top 25%) achieve nightly rates of $143 or more.
- Typical properties (Median) charge around $89 per night.
- Entry-level properties (Bottom 25%) earn around $54 per night.
Average Daily Rate (ADR) Trend by Month in Clermont-Créans
Get Live Clermont-Créans Market Intelligence 👇

Explore Real-time Analytics
Airbnb Seasonality Analysis & Trends in Clermont-Créans (2025)
Peak Season (August, June, May)
- Revenue averages $2,513 per month
- Occupancy rates average 55.5%
- Daily rates average $256
Shoulder Season
- Revenue averages $1,560 per month
- Occupancy maintains around 43.2%
- Daily rates hold near $154
Low Season (March, September, October)
- Revenue drops to average $1,084 per month
- Occupancy decreases to average 32.9%
- Daily rates adjust to average $202
Seasonality Insights for Clermont-Créans
- The Airbnb seasonality in Clermont-Créans shows highly seasonal trends requiring careful strategy. While the sections above show seasonal averages, it's also insightful to look at the extremes:
- During the high season, the absolute peak month showcases Clermont-Créans's highest earning potential, with monthly revenues capable of climbing to $2,704, occupancy reaching a high of 69.5%, and ADRs peaking at $258.
- Conversely, the slowest single month of the year, typically falling within the low season, marks the market's lowest point. In this month, revenue might dip to $931, occupancy could drop to 30.1%, and ADRs may adjust down to $99.
- Understanding both the seasonal averages and these monthly peaks and troughs in revenue, occupancy, and ADR is crucial for maximizing your Airbnb profit potential in Clermont-Créans.
Seasonal Strategies for Maximizing Profit
- Peak Season: Maximize revenue through premium pricing and potentially longer minimum stays. Ensure high availability.
- Low Season: Offer competitive pricing, special promotions (e.g., extended stay discounts), and flexible cancellation policies. Target off-season travelers like remote workers or budget-conscious guests.
- Shoulder Seasons: Implement dynamic pricing that balances peak and low rates. Target weekend travelers or specific events. Offer slightly more flexible terms than peak season.
- Regularly analyze your own performance against these Clermont-Créans seasonality benchmarks and adjust your pricing and availability strategy accordingly.
Best Areas for Airbnb Investment in Clermont-Créans (2025)
Exploring the top neighborhoods for short-term rentals in Clermont-Créans? This section highlights key areas, outlining why they are attractive for hosts and guests, along with notable local attractions. Consider these locations based on your target guest profile and investment strategy.
| Neighborhood / Area | Why Host Here? (Target Guests & Appeal) | Key Attractions & Landmarks |
|---|---|---|
| Clermont-Créans Historic Center | The charming historic center features beautiful architecture and is close to essential services, making it ideal for tourists who want an authentic French experience. | Saint-Thomas Church, Place de la Mairie, Local shops and cafés, Weekly markets, Historic architecture |
| Parc Naturel Régional Normandie-Maine | This natural park offers stunning landscapes and outdoor activities, ideal for nature lovers and families looking for a peaceful getaway. | Hiking trails, Birdwatching, Lakes and rivers, Scenic viewpoints, Cycling paths |
| Château de Clermont-Créans | An important historical site that attracts visitors interested in culture and history, perfect for those seeking a quiet, yet rich cultural experience. | Château architecture, Historical tours, Gardens, Cultural events, Art exhibits |
| Local Vineyards | The surrounding vineyards provide a unique opportunity for wine tourism, appealing to wine enthusiasts and groups looking for an authentic experience. | Wine tasting, Vineyard tours, Wine shops, Gastronomy events, Scenic vineyard views |
| Nearby Le Mans | A larger city nearby, known for its history, culture, and the famous 24-hour car race, attracting a wide variety of visitors. | Le Mans Cathedral, Cité Plantagenêt, 24 Hours of Le Mans Museum, Local cuisine, Cultural festivals |
| Outdoor Markets | The vibrant markets in the area attract both locals and tourists, ideal for those looking for fresh produce and a taste of local life. | Weekly farmer's market, Craft stalls, Local delicacies, Culinary experiences, Community events |
| Regional Parks | Surrounding parks offer a range of outdoor activities such as hiking, cycling, and picnicking, appealing to families and outdoor enthusiasts. | Picnic areas, Bicycle paths, Natural reserves, Wildlife spotting, Adventure activities |
| Culinary Tours | The region is known for its gastronomy, offering cooking classes and food tours that attract food lovers and culinary tourists. | Cooking classes, Gourmet restaurants, Food festivals, Wine and cheese tastings, Local delicacies |
Understanding Airbnb License Requirements & STR Laws in Clermont-Créans (2025)
While Clermont-Créans, Pays de la Loire, France currently shows low STR regulations, specific Airbnb license requirements might still exist or change. Always verify the latest short term rental regulations and Airbnb license requirements directly with local government authorities for Clermont-Créans to ensure full compliance before hosting.
(Source: AirROI data, 2025, based on 10% licensed listings)
Top Performing Airbnb Properties in Clermont-Créans (2025)
Benchmark your potential! Explore examples of top-performing Airbnb properties in Clermont-Créansbased on Trailing Twelve Month (TTM) revenue. Analyze their characteristics, revenue, occupancy rate, and ADR to understand what drives success in this market.
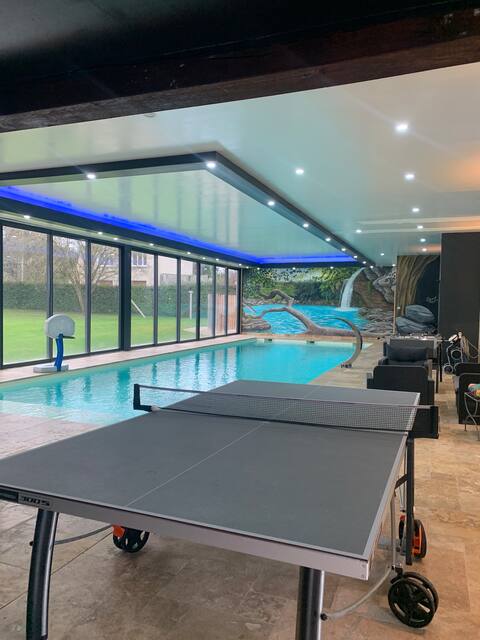
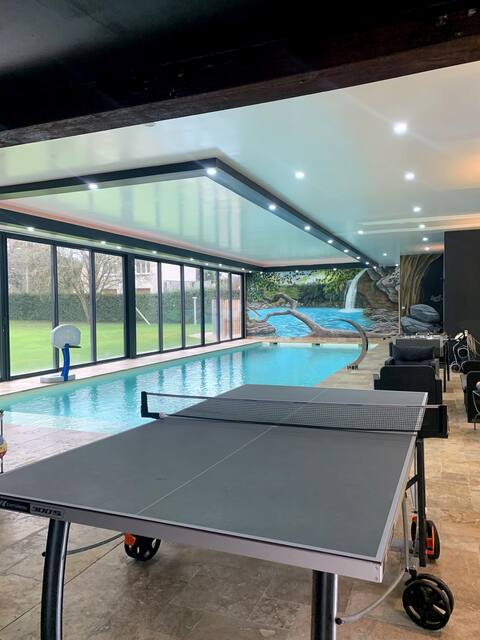
Cottage@indoor pool 31° ZOO LA FLECHE
Entire Place • 2 bedrooms

New house ideal for families
Entire Place • 3 bedrooms

Indoor pool cottage 31°ZOOLAFLECHE/24HDUMANS
Entire Place • 1 bedroom
Cottage# indoor pool31°ZOOLAFLECHE/24HDUMANS
Entire Place • 1 bedroom
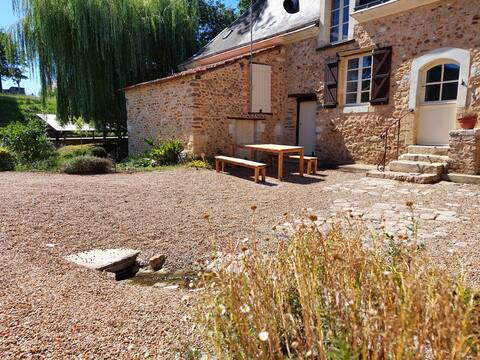
The mill estate
Entire Place • 3 bedrooms

Family home
Entire Place • 4 bedrooms
Note: Performance varies based on location, size, amenities, seasonality, and management quality. Data reflects the past 12 months.
Top Performing Airbnb Hosts in Clermont-Créans (2025)
Learn from the best! This table showcases top-performing Airbnb hosts in Clermont-Créans based on the number of properties managed and estimated total revenue over the past year. Analyze their scale and performance metrics.
| Host Name | Properties | Grossing Revenue | Stay Reviews | Avg Rating |
|---|---|---|---|---|
| Celine | 4 | $138,222 | 591 | 4.74/5.0 |
| Soufiane | 2 | $64,857 | 185 | 4.83/5.0 |
| Isaure | 1 | $21,957 | 11 | 4.91/5.0 |
| Estelle | 1 | $16,743 | 16 | 5.00/5.0 |
| Noelle Et Daniel | 1 | $15,144 | 9 | 4.78/5.0 |
| Pascale | 3 | $13,186 | 343 | 4.79/5.0 |
| Maxime | 1 | $10,856 | 4 | 4.25/5.0 |
| Michèle | 1 | $10,828 | 134 | 4.96/5.0 |
| Nicolas | 1 | $10,646 | 169 | 4.92/5.0 |
| Sandrine | 1 | $9,345 | 3 | 5.00/5.0 |
Analyzing the strategies of top hosts, such as their property selection, pricing, and guest communication, can offer valuable lessons for optimizing your own Airbnb operations in Clermont-Créans.
Dive Deeper: Advanced Clermont-Créans STR Market Data (2025)
Ready to unlock more insights? AirROI provides access to advanced metrics and comprehensive Airbnb data for Clermont-Créans. Explore detailed analytics beyond this report to refine your investment strategy, optimize pricing, and maximize your vacation rental profits.
Explore Advanced MetricsClermont-Créans Short-Term Rental Market Composition (2025): Property & Room Types
Room Type Distribution
Property Type Distribution
Market Composition Insights for Clermont-Créans
- The Clermont-Créans Airbnb market composition is heavily skewed towards Entire Home/Apt listings, which make up 66.7% of the 21 active rentals. This indicates strong guest preference for privacy and space.
- However, a notable 28.6% share for Private Rooms suggests opportunities for budget-conscious travelers or hosts renting out spare rooms.
- Looking at the property type distribution in Clermont-Créans, House properties are the most common (76.2%), reflecting the local real estate landscape.
- Houses represent a significant 76.2% portion, catering likely to families or larger groups.
- The presence of 14.3% Hotel/Boutique listings indicates integration with traditional hospitality.
Clermont-Créans Airbnb Room Capacity Analysis (2025): Bedroom Distribution
Distribution of Listings by Number of Bedrooms
Room Capacity Insights for Clermont-Créans
- The dominant room capacity in Clermont-Créans is 1 bedroom listings, making up 28.6% of the market. This suggests a strong demand for properties suitable for couples or solo travelers.
- Together, 1 bedroom and 2 bedrooms properties represent 52.4% of the active Airbnb listings in Clermont-Créans, indicating a high concentration in these sizes.
- A significant 23.9% of listings offer 3+ bedrooms, catering to larger groups and families seeking more space in Clermont-Créans.
Clermont-Créans Vacation Rental Guest Capacity Trends (2025)
Distribution of Listings by Guest Capacity
Guest Capacity Insights for Clermont-Créans
- The most common guest capacity trend in Clermont-Créans vacation rentals is listings accommodating 4 guests (19%). This suggests the primary traveler segment is likely small families or groups.
- Properties designed for 4 guests and 8+ guests dominate the Clermont-Créans STR market, accounting for 38.0% of listings.
- 38.0% of properties accommodate 6+ guests, serving the market segment for larger families or group travel in Clermont-Créans.
- On average, properties in Clermont-Créans are equipped to host 4.2 guests.
Clermont-Créans Airbnb Booking Patterns (2025): Available vs. Booked Days
Available Days Distribution
Booked Days Distribution
Booking Pattern Insights for Clermont-Créans
- The most common availability pattern in Clermont-Créans falls within the 181-270 days range, representing 42.9% of listings. This suggests many properties have significant open periods on their calendars.
- Approximately 71.5% of listings show high availability (181+ days open annually), indicating potential for increased bookings or specific owner usage patterns.
- For booked days, the 91-180 days range is most frequent in Clermont-Créans (42.9%), reflecting common guest stay durations or potential owner blocking patterns.
- A notable 28.6% of properties secure long booking periods (181+ days booked per year), highlighting successful long-term rental strategies or significant owner usage.
Clermont-Créans Airbnb Minimum Stay Requirements Analysis
Distribution of Listings by Minimum Night Requirement
1 Night
13 listings
65% of total
2 Nights
7 listings
35% of total
Key Insights
- The most prevalent minimum stay requirement in Clermont-Créans is 1 Night, adopted by 65% of listings. This highlights the market's preference for shorter, flexible bookings.
- A strong majority (100.0%) of the Clermont-Créans Airbnb data shows acceptance of very short stays (1-2 nights), indicating a dynamic, high-turnover market.
Recommendations
- Align with the market by considering a 1 Night minimum stay, as 65% of Clermont-Créans hosts use this setting.
- Adjust minimum nights based on seasonality – potentially shorter during low season and longer during peak demand periods in Clermont-Créans.
Clermont-Créans Airbnb Cancellation Policy Trends Analysis (2025)
Refundable
1 listings
5% of total
Flexible
5 listings
25% of total
Moderate
6 listings
30% of total
Firm
1 listings
5% of total
Strict
7 listings
35% of total
Cancellation Policy Insights for Clermont-Créans
- The prevailing Airbnb cancellation policy trend in Clermont-Créans is Strict, used by 35% of listings.
- There's a relatively balanced mix between guest-friendly (55.0%) and stricter (40.0%) policies, offering choices for different guest needs.
Recommendations for Hosts
- Consider adopting a Strict policy to align with the 35% market standard in Clermont-Créans.
- With 35% using Strict terms, this is a viable option in Clermont-Créans, particularly for high-value properties or during peak demand periods.
- Regularly review your cancellation policy against competitors and market demand shifts in Clermont-Créans.
Clermont-Créans STR Booking Lead Time Analysis (2025)
Average Booking Lead Time by Month
Booking Lead Time Insights for Clermont-Créans
- The overall average booking lead time for vacation rentals in Clermont-Créans is 40 days.
- Guests book furthest in advance for stays during May (average 90 days), likely coinciding with peak travel demand or local events.
- The shortest booking windows occur for stays in March (average 20 days), indicating more last-minute travel plans during this time.
- Seasonally, Summer (67 days avg.) sees the longest lead times, while Fall (34 days avg.) has the shortest, reflecting typical travel planning cycles.
Recommendations for Hosts
- Use the overall average lead time (40 days) as a baseline for your pricing and availability strategy in Clermont-Créans.
- For May stays, consider implementing length-of-stay discounts or slightly higher rates for bookings made less than 90 days out to capitalize on advance planning.
- Target marketing efforts for the Summer season well in advance (at least 67 days) to capture early planners.
- Monitor your own booking lead times against these Clermont-Créans averages to identify opportunities for dynamic pricing adjustments.
Popular & Essential Airbnb Amenities in Clermont-Créans (2025)
Amenity Prevalence
Amenity Insights for Clermont-Créans
- Essential amenities in Clermont-Créans that guests expect include: Free parking on premises, Hot water. Lacking these (any) could significantly impact bookings.
- Popular amenities like Wifi, Heating, Hangers are common but not universal. Offering these can provide a competitive edge.
- Warning: Wifi is not universally provided but is considered essential globally. Ensure reliable Wifi is offered.
Recommendations for Hosts
- Ensure your listing includes all essential amenities for Clermont-Créans: Free parking on premises, Hot water.
- Prioritize adding missing essentials: Free parking on premises, Hot water.
- Consider adding popular differentiators like Wifi or Heating to increase appeal.
- Highlight unique or less common amenities you offer (e.g., hot tub, dedicated workspace, EV charger) in your listing description and photos.
- Regularly check competitor amenities in Clermont-Créans to stay competitive.
Clermont-Créans Airbnb Guest Demographics & Profile Analysis (2025)
Guest Profile Summary for Clermont-Créans
- The typical guest profile for Airbnb in Clermont-Créans consists of primarily domestic travelers (93%), often arriving from nearby Paris, typically belonging to the Post-2000s (Gen Z/Alpha) group (50%), primarily speaking French or English.
- Domestic travelers account for 92.8% of guests.
- Key international markets include France (92.8%) and Belgium (2%).
- Top languages spoken are French (53.9%) followed by English (26.7%).
- A significant demographic segment is the Post-2000s (Gen Z/Alpha) group, representing 50% of guests.
Recommendations for Hosts
- Target domestic marketing efforts towards travelers from Paris and Angers.
- Tailor amenities and listing descriptions to appeal to the dominant Post-2000s (Gen Z/Alpha) demographic (e.g., highlight fast WiFi, smart home features, local guides).
- Highlight unique local experiences or amenities relevant to the primary guest profile.
- Consider seasonal promotions aligned with peak travel times for key origin markets.
Nearby Short-Term Rental Market Comparison
How does the Clermont-Créans Airbnb market stack up against its neighbors? Compare key performance metrics like average monthly revenue, ADR, and occupancy rates in surrounding areas to understand the broader regional STR landscape.
| Market | Active Properties | Monthly Revenue | Daily Rate | Avg. Occupancy |
|---|---|---|---|---|
| Coteaux-sur-Loire | 19 | $3,328 | $270.00 | 41% |
| Moulins-le-Carbonnel | 11 | $3,213 | $320.85 | 35% |
| Villiers-sur-Loir | 10 | $2,967 | $216.51 | 41% |
| Artannes-sur-Indre | 21 | $2,949 | $275.91 | 41% |
| Vallon-sur-Gée | 11 | $2,913 | $379.01 | 30% |
| La Ferté-en-Ouche | 19 | $2,854 | $258.24 | 39% |
| Tourouvre au Perche | 31 | $2,842 | $237.49 | 43% |
| Bourneau | 11 | $2,747 | $442.07 | 35% |
| Nuaillé-d'Aunis | 10 | $2,741 | $373.83 | 37% |
| Ambillou | 18 | $2,701 | $370.97 | 28% |