Chaumes-en-Retz Airbnb Market Analysis 2025: Short Term Rental Data & Vacation Rental Statistics in Pays de la Loire, France
Is Airbnb profitable in Chaumes-en-Retz in 2025? Explore comprehensive Airbnb analytics for Chaumes-en-Retz, Pays de la Loire, France to uncover income potential. This 2025 STR market report for Chaumes-en-Retz, based on AirROI data from April 2024 to March 2025, reveals key trends in the niche market of 27 active listings.
Whether you're considering an Airbnb investment in Chaumes-en-Retz, optimizing your existing vacation rental, or exploring rental arbitrage opportunities, understanding the Chaumes-en-Retz Airbnb data is crucial. Navigating the high regulation landscape is key to maximizing your short term rental income potential. Let's dive into the specifics.
Key Chaumes-en-Retz Airbnb Performance Metrics Overview
Monthly Airbnb Revenue Variations & Income Potential in Chaumes-en-Retz (2025)
Understanding the monthly revenue variations for Airbnb listings in Chaumes-en-Retz is key to maximizing your short term rental income potential. Seasonality significantly impacts earnings. Our analysis, based on data from the past 12 months, shows that the peak revenue month for STRs in Chaumes-en-Retz is typically August, while February often presents the lowest earnings, highlighting opportunities for strategic pricing adjustments during shoulder and low seasons. Explore the typical Airbnb income in Chaumes-en-Retz across different performance tiers:
- Best-in-class properties (Top 10%) achieve $3,098+ monthly, often utilizing dynamic pricing and superior guest experiences.
- Strong performing properties (Top 25%) earn $2,001 or more, indicating effective management and desirable locations/amenities.
- Typical properties (Median) generate around $1,087 per month, representing the average market performance.
- Entry-level properties (Bottom 25%) see earnings around $500, often with potential for optimization.
Average Monthly Airbnb Earnings Trend in Chaumes-en-Retz
Chaumes-en-Retz Airbnb Occupancy Rate Trends (2025)
Maximize your bookings by understanding the Chaumes-en-Retz STR occupancy trends. Seasonal demand shifts significantly influence how often properties are booked. Typically, Augustsees the highest demand (peak season occupancy), while March experiences the lowest (low season). Effective strategies, like adjusting minimum stays or offering promotions, can boost occupancy during slower periods. Here's how different property tiers perform in Chaumes-en-Retz:
- Best-in-class properties (Top 10%) achieve 74%+ occupancy, indicating high desirability and potentially optimized availability.
- Strong performing properties (Top 25%) maintain 56% or higher occupancy, suggesting good market fit and guest satisfaction.
- Typical properties (Median) have an occupancy rate around 32%.
- Entry-level properties (Bottom 25%) average 16% occupancy, potentially facing higher vacancy.
Average Monthly Occupancy Rate Trend in Chaumes-en-Retz
Average Daily Rate (ADR) Airbnb Trends in Chaumes-en-Retz (2025)
Effective short term rental pricing strategy in Chaumes-en-Retz involves understanding monthly ADR fluctuations. The Average Daily Rate (ADR) for Airbnb in Chaumes-en-Retz typically peaks in July and dips lowest during March. Leveraging Airbnb dynamic pricing tools or strategies based on this seasonality can significantly boost revenue. Here's a look at the typical nightly rates achieved:
- Best-in-class properties (Top 10%) command rates of $284+ per night, often due to premium features or locations.
- Strong performing properties (Top 25%) achieve nightly rates of $131 or more.
- Typical properties (Median) charge around $88 per night.
- Entry-level properties (Bottom 25%) earn around $60 per night.
Average Daily Rate (ADR) Trend by Month in Chaumes-en-Retz
Get Live Chaumes-en-Retz Market Intelligence 👇

Explore Real-time Analytics
Airbnb Seasonality Analysis & Trends in Chaumes-en-Retz (2025)
Peak Season (August, July, June)
- Revenue averages $2,168 per month
- Occupancy rates average 49.6%
- Daily rates average $157
Shoulder Season
- Revenue averages $1,695 per month
- Occupancy maintains around 36.5%
- Daily rates hold near $149
Low Season (February, March, November)
- Revenue drops to average $707 per month
- Occupancy decreases to average 27.4%
- Daily rates adjust to average $138
Seasonality Insights for Chaumes-en-Retz
- The Airbnb seasonality in Chaumes-en-Retz shows highly seasonal trends requiring careful strategy. While the sections above show seasonal averages, it's also insightful to look at the extremes:
- During the high season, the absolute peak month showcases Chaumes-en-Retz's highest earning potential, with monthly revenues capable of climbing to $2,406, occupancy reaching a high of 66.4%, and ADRs peaking at $159.
- Conversely, the slowest single month of the year, typically falling within the low season, marks the market's lowest point. In this month, revenue might dip to $485, occupancy could drop to 23.8%, and ADRs may adjust down to $133.
- Understanding both the seasonal averages and these monthly peaks and troughs in revenue, occupancy, and ADR is crucial for maximizing your Airbnb profit potential in Chaumes-en-Retz.
Seasonal Strategies for Maximizing Profit
- Peak Season: Maximize revenue through premium pricing and potentially longer minimum stays. Ensure high availability.
- Low Season: Offer competitive pricing, special promotions (e.g., extended stay discounts), and flexible cancellation policies. Target off-season travelers like remote workers or budget-conscious guests.
- Shoulder Seasons: Implement dynamic pricing that balances peak and low rates. Target weekend travelers or specific events. Offer slightly more flexible terms than peak season.
- Regularly analyze your own performance against these Chaumes-en-Retz seasonality benchmarks and adjust your pricing and availability strategy accordingly.
Best Areas for Airbnb Investment in Chaumes-en-Retz (2025)
Exploring the top neighborhoods for short-term rentals in Chaumes-en-Retz? This section highlights key areas, outlining why they are attractive for hosts and guests, along with notable local attractions. Consider these locations based on your target guest profile and investment strategy.
| Neighborhood / Area | Why Host Here? (Target Guests & Appeal) | Key Attractions & Landmarks |
|---|---|---|
| Chaumes-en-Retz Center | The central area of Chaumes-en-Retz offers charming streets and proximity to local shops and restaurants. It's an ideal spot for tourists wanting to experience the local culture. | Church of Saint-Hilaire, Local markets, Parks and recreational areas |
| Nearby Beaches | The proximity to beaches such as La Pellerin and Saint-Brévin-les-Pins makes this area attractive for families and beach-goers during the summer months. | La Pellerin Beach, Saint-Brévin Beach, Beachfront restaurants, Water sports activities |
| Nature Trails | Chaumes-en-Retz is surrounded by beautiful natural landscapes, making it ideal for outdoor enthusiasts and travelers seeking peace and tranquility. | Nature parks, Walking and biking trails, Bird watching spots |
| Cultural Sites | The region has several historical sites and buildings that attract culture lovers and history buffs, perfect for weekend getaways. | Château de Machecoul, Historical monuments, Local festivals |
| Wine Country | The nearby Loire Valley is famous for its wines, attracting wine enthusiasts looking for vineyard experiences and tastings. | Vineyards and wineries, Wine tasting tours, Scenic landscapes |
| Local Cuisine | The area offers a rich culinary scene with local specialties, ideal for food lovers and those looking to explore French cuisine. | Local restaurants, Food festivals, Farmers markets |
| Family Attractions | Close to entertainment areas that cater to families and children, making it great for family vacations. | Amusement parks, Zoo and aquariums, Family-friendly restaurants |
| Rural Escapes | The picturesque countryside around Chaumes-en-Retz offers a quiet retreat for those looking to escape the hustle and bustle of city life. | Charming rural landscapes, Farm stays, Countryside walks |
Understanding Airbnb License Requirements & STR Laws in Chaumes-en-Retz (2025)
Yes, Chaumes-en-Retz, Pays de la Loire, France enforces high STR regulations. Obtaining a license and ensuring compliance is almost certainly required according to current 2025 STR laws. Always verify the latest short term rental regulations and Airbnb license requirements directly with local government authorities for Chaumes-en-Retz to ensure full compliance before hosting.
(Source: AirROI data, 2025, based on 81% licensed listings)
Top Performing Airbnb Properties in Chaumes-en-Retz (2025)
Benchmark your potential! Explore examples of top-performing Airbnb properties in Chaumes-en-Retzbased on Trailing Twelve Month (TTM) revenue. Analyze their characteristics, revenue, occupancy rate, and ADR to understand what drives success in this market.
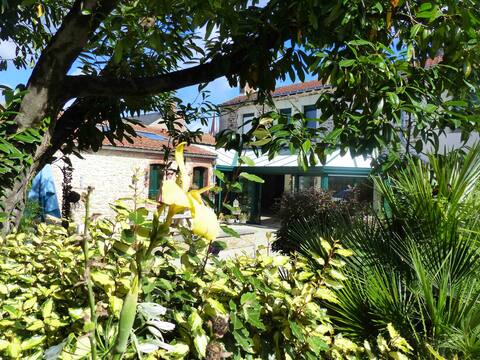
Large family home 300 m2
Entire Place • 6 bedrooms
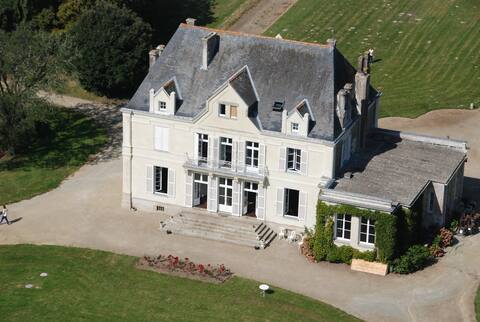
Domaine de Pierre Levée, swimming pool, close to the sea
Entire Place • 9 bedrooms
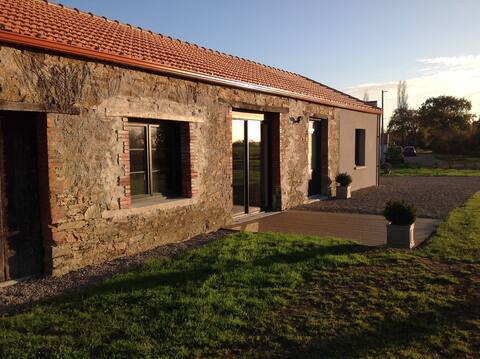
Large nature cottage. Ocean 15 km, Nantes 30 km
Entire Place • 4 bedrooms

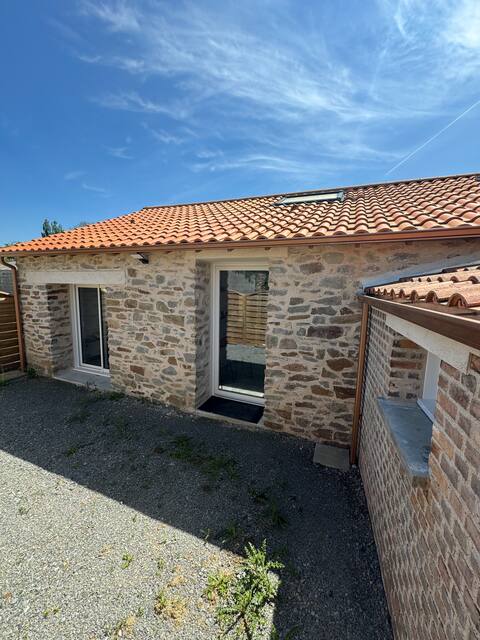
Warm and quiet house near Pornic
Entire Place • 2 bedrooms
Cottage at campaign close to the beach
Entire Place • 3 bedrooms
Tipi Cabin with breakfast near Pornic
Entire Place • 2 bedrooms
Note: Performance varies based on location, size, amenities, seasonality, and management quality. Data reflects the past 12 months.
Top Performing Airbnb Hosts in Chaumes-en-Retz (2025)
Learn from the best! This table showcases top-performing Airbnb hosts in Chaumes-en-Retz based on the number of properties managed and estimated total revenue over the past year. Analyze their scale and performance metrics.
| Host Name | Properties | Grossing Revenue | Stay Reviews | Avg Rating |
|---|---|---|---|---|
| Nina | 2 | $69,249 | 19 | 4.88/5.0 |
| Yves | 3 | $66,398 | 196 | 4.91/5.0 |
| Catherine | 1 | $42,058 | 11 | 4.91/5.0 |
| Jérôme Céline | 3 | $28,442 | 133 | 4.91/5.0 |
| Isabelle | 1 | $26,621 | 70 | 4.89/5.0 |
| Leclerc | 1 | $19,756 | 15 | 4.80/5.0 |
| Karine | 1 | $16,154 | 8 | 5.00/5.0 |
| Catherine Et Fabrice | 1 | $15,227 | 34 | 4.91/5.0 |
| Nicolas | 1 | $13,036 | 6 | 4.83/5.0 |
| Host #137511659 | 1 | $9,959 | 0 | 0.00/5.0 |
Analyzing the strategies of top hosts, such as their property selection, pricing, and guest communication, can offer valuable lessons for optimizing your own Airbnb operations in Chaumes-en-Retz.
Dive Deeper: Advanced Chaumes-en-Retz STR Market Data (2025)
Ready to unlock more insights? AirROI provides access to advanced metrics and comprehensive Airbnb data for Chaumes-en-Retz. Explore detailed analytics beyond this report to refine your investment strategy, optimize pricing, and maximize your vacation rental profits.
Explore Advanced MetricsChaumes-en-Retz Short-Term Rental Market Composition (2025): Property & Room Types
Room Type Distribution
Property Type Distribution
Market Composition Insights for Chaumes-en-Retz
- The Chaumes-en-Retz Airbnb market composition is heavily skewed towards Entire Home/Apt listings, which make up 96.3% of the 27 active rentals. This indicates strong guest preference for privacy and space.
- Looking at the property type distribution in Chaumes-en-Retz, House properties are the most common (48.1%), reflecting the local real estate landscape.
- Houses represent a significant 48.1% portion, catering likely to families or larger groups.
- The presence of 14.8% Hotel/Boutique listings indicates integration with traditional hospitality.
- Smaller segments like unique stays (combined 3.7%) offer potential for unique stay experiences.
Chaumes-en-Retz Airbnb Room Capacity Analysis (2025): Bedroom Distribution
Distribution of Listings by Number of Bedrooms
Room Capacity Insights for Chaumes-en-Retz
- The dominant room capacity in Chaumes-en-Retz is 2 bedrooms listings, making up 29.6% of the market. This suggests a strong demand for properties suitable for couples or solo travelers.
- Together, 2 bedrooms and 1 bedroom properties represent 55.5% of the active Airbnb listings in Chaumes-en-Retz, indicating a high concentration in these sizes.
- A significant 37.0% of listings offer 3+ bedrooms, catering to larger groups and families seeking more space in Chaumes-en-Retz.
Chaumes-en-Retz Vacation Rental Guest Capacity Trends (2025)
Distribution of Listings by Guest Capacity
Guest Capacity Insights for Chaumes-en-Retz
- The most common guest capacity trend in Chaumes-en-Retz vacation rentals is listings accommodating 4 guests (25.9%). This suggests the primary traveler segment is likely small families or groups.
- Properties designed for 4 guests and 8+ guests dominate the Chaumes-en-Retz STR market, accounting for 48.1% of listings.
- 44.4% of properties accommodate 6+ guests, serving the market segment for larger families or group travel in Chaumes-en-Retz.
- On average, properties in Chaumes-en-Retz are equipped to host 5.0 guests.
Chaumes-en-Retz Airbnb Booking Patterns (2025): Available vs. Booked Days
Available Days Distribution
Booked Days Distribution
Booking Pattern Insights for Chaumes-en-Retz
- The most common availability pattern in Chaumes-en-Retz falls within the 271-366 days range, representing 48.1% of listings. This suggests many properties have significant open periods on their calendars.
- Approximately 77.7% of listings show high availability (181+ days open annually), indicating potential for increased bookings or specific owner usage patterns.
- For booked days, the 31-90 days range is most frequent in Chaumes-en-Retz (33.3%), reflecting common guest stay durations or potential owner blocking patterns.
- A notable 22.2% of properties secure long booking periods (181+ days booked per year), highlighting successful long-term rental strategies or significant owner usage.
Chaumes-en-Retz Airbnb Minimum Stay Requirements Analysis
Distribution of Listings by Minimum Night Requirement
1 Night
8 listings
32% of total
2 Nights
9 listings
36% of total
3 Nights
1 listings
4% of total
7-29 Nights
2 listings
8% of total
30+ Nights
5 listings
20% of total
Key Insights
- The most prevalent minimum stay requirement in Chaumes-en-Retz is 2 Nights, adopted by 36% of listings. This highlights the market's preference for shorter, flexible bookings.
- A strong majority (68.0%) of the Chaumes-en-Retz Airbnb data shows acceptance of very short stays (1-2 nights), indicating a dynamic, high-turnover market.
- A significant segment (20%) caters to monthly stays (30+ nights) in Chaumes-en-Retz, pointing to opportunities in the extended-stay market.
Recommendations
- Align with the market by considering a 2 Nights minimum stay, as 36% of Chaumes-en-Retz hosts use this setting.
- Explore offering discounts for stays of 30+ nights to attract the 20% of the market seeking extended stays.
- Adjust minimum nights based on seasonality – potentially shorter during low season and longer during peak demand periods in Chaumes-en-Retz.
Chaumes-en-Retz Airbnb Cancellation Policy Trends Analysis (2025)
Flexible
10 listings
41.7% of total
Moderate
6 listings
25% of total
Firm
4 listings
16.7% of total
Strict
4 listings
16.7% of total
Cancellation Policy Insights for Chaumes-en-Retz
- The prevailing Airbnb cancellation policy trend in Chaumes-en-Retz is Flexible, used by 41.7% of listings.
- There's a relatively balanced mix between guest-friendly (66.7%) and stricter (33.4%) policies, offering choices for different guest needs.
Recommendations for Hosts
- Consider adopting a Flexible policy to align with the 41.7% market standard in Chaumes-en-Retz.
- Regularly review your cancellation policy against competitors and market demand shifts in Chaumes-en-Retz.
Chaumes-en-Retz STR Booking Lead Time Analysis (2025)
Average Booking Lead Time by Month
Booking Lead Time Insights for Chaumes-en-Retz
- The overall average booking lead time for vacation rentals in Chaumes-en-Retz is 53 days.
- Guests book furthest in advance for stays during July (average 79 days), likely coinciding with peak travel demand or local events.
- The shortest booking windows occur for stays in November (average 22 days), indicating more last-minute travel plans during this time.
- Seasonally, Summer (66 days avg.) sees the longest lead times, while Fall (45 days avg.) has the shortest, reflecting typical travel planning cycles.
Recommendations for Hosts
- Use the overall average lead time (53 days) as a baseline for your pricing and availability strategy in Chaumes-en-Retz.
- For July stays, consider implementing length-of-stay discounts or slightly higher rates for bookings made less than 79 days out to capitalize on advance planning.
- Target marketing efforts for the Summer season well in advance (at least 66 days) to capture early planners.
- Monitor your own booking lead times against these Chaumes-en-Retz averages to identify opportunities for dynamic pricing adjustments.
Popular & Essential Airbnb Amenities in Chaumes-en-Retz (2025)
Amenity Prevalence
Amenity Insights for Chaumes-en-Retz
- Popular amenities like Heating, Free parking on premises, TV are common but not universal. Offering these can provide a competitive edge.
- Warning: Wifi is not universally provided but is considered essential globally. Ensure reliable Wifi is offered.
Recommendations for Hosts
- Consider adding popular differentiators like Heating or Free parking on premises to increase appeal.
- Highlight unique or less common amenities you offer (e.g., hot tub, dedicated workspace, EV charger) in your listing description and photos.
- Regularly check competitor amenities in Chaumes-en-Retz to stay competitive.
Chaumes-en-Retz Airbnb Guest Demographics & Profile Analysis (2025)
Guest Profile Summary for Chaumes-en-Retz
- The typical guest profile for Airbnb in Chaumes-en-Retz consists of primarily domestic travelers (97%), often arriving from nearby Paris, typically belonging to the Post-2000s (Gen Z/Alpha) group (50%), primarily speaking French or English.
- Domestic travelers account for 96.8% of guests.
- Key international markets include France (96.8%) and Belgium (0.9%).
- Top languages spoken are French (51.2%) followed by English (29.6%).
- A significant demographic segment is the Post-2000s (Gen Z/Alpha) group, representing 50% of guests.
Recommendations for Hosts
- Target domestic marketing efforts towards travelers from Paris and Nantes.
- Tailor amenities and listing descriptions to appeal to the dominant Post-2000s (Gen Z/Alpha) demographic (e.g., highlight fast WiFi, smart home features, local guides).
- Highlight unique local experiences or amenities relevant to the primary guest profile.
- Consider seasonal promotions aligned with peak travel times for key origin markets.
Nearby Short-Term Rental Market Comparison
How does the Chaumes-en-Retz Airbnb market stack up against its neighbors? Compare key performance metrics like average monthly revenue, ADR, and occupancy rates in surrounding areas to understand the broader regional STR landscape.
| Market | Active Properties | Monthly Revenue | Daily Rate | Avg. Occupancy |
|---|---|---|---|---|
| Moulins-le-Carbonnel | 11 | $3,213 | $320.85 | 35% |
| Vallon-sur-Gée | 11 | $2,913 | $379.01 | 30% |
| Bourneau | 11 | $2,747 | $442.07 | 35% |
| Nuaillé-d'Aunis | 10 | $2,741 | $373.83 | 37% |
| Le Bois-Plage-en-Ré | 303 | $2,528 | $284.63 | 45% |
| Chambellay | 11 | $2,525 | $255.24 | 34% |
| Sainte-Florence | 10 | $2,445 | $233.78 | 46% |
| La Flotte | 396 | $2,382 | $236.53 | 46% |
| Forges | 11 | $2,314 | $220.63 | 39% |
| Dœuil-sur-le-Mignon | 12 | $2,283 | $481.91 | 21% |