Chanverrie Airbnb Market Analysis 2025: Short Term Rental Data & Vacation Rental Statistics in Pays de la Loire, France
Is Airbnb profitable in Chanverrie in 2025? Explore comprehensive Airbnb analytics for Chanverrie, Pays de la Loire, France to uncover income potential. This 2025 STR market report for Chanverrie, based on AirROI data from April 2024 to March 2025, reveals key trends in the niche market of 86 active listings.
Whether you're considering an Airbnb investment in Chanverrie, optimizing your existing vacation rental, or exploring rental arbitrage opportunities, understanding the Chanverrie Airbnb data is crucial. Navigating the high regulation landscape is key to maximizing your short term rental income potential. Let's dive into the specifics.
Key Chanverrie Airbnb Performance Metrics Overview
Monthly Airbnb Revenue Variations & Income Potential in Chanverrie (2025)
Understanding the monthly revenue variations for Airbnb listings in Chanverrie is key to maximizing your short term rental income potential. Seasonality significantly impacts earnings. Our analysis, based on data from the past 12 months, shows that the peak revenue month for STRs in Chanverrie is typically August, while March often presents the lowest earnings, highlighting opportunities for strategic pricing adjustments during shoulder and low seasons. Explore the typical Airbnb income in Chanverrie across different performance tiers:
- Best-in-class properties (Top 10%) achieve $3,530+ monthly, often utilizing dynamic pricing and superior guest experiences.
- Strong performing properties (Top 25%) earn $2,145 or more, indicating effective management and desirable locations/amenities.
- Typical properties (Median) generate around $1,264 per month, representing the average market performance.
- Entry-level properties (Bottom 25%) see earnings around $792, often with potential for optimization.
Average Monthly Airbnb Earnings Trend in Chanverrie
Chanverrie Airbnb Occupancy Rate Trends (2025)
Maximize your bookings by understanding the Chanverrie STR occupancy trends. Seasonal demand shifts significantly influence how often properties are booked. Typically, Augustsees the highest demand (peak season occupancy), while March experiences the lowest (low season). Effective strategies, like adjusting minimum stays or offering promotions, can boost occupancy during slower periods. Here's how different property tiers perform in Chanverrie:
- Best-in-class properties (Top 10%) achieve 77%+ occupancy, indicating high desirability and potentially optimized availability.
- Strong performing properties (Top 25%) maintain 59% or higher occupancy, suggesting good market fit and guest satisfaction.
- Typical properties (Median) have an occupancy rate around 40%.
- Entry-level properties (Bottom 25%) average 28% occupancy, potentially facing higher vacancy.
Average Monthly Occupancy Rate Trend in Chanverrie
Average Daily Rate (ADR) Airbnb Trends in Chanverrie (2025)
Effective short term rental pricing strategy in Chanverrie involves understanding monthly ADR fluctuations. The Average Daily Rate (ADR) for Airbnb in Chanverrie typically peaks in January and dips lowest during September. Leveraging Airbnb dynamic pricing tools or strategies based on this seasonality can significantly boost revenue. Here's a look at the typical nightly rates achieved:
- Best-in-class properties (Top 10%) command rates of $190+ per night, often due to premium features or locations.
- Strong performing properties (Top 25%) achieve nightly rates of $133 or more.
- Typical properties (Median) charge around $94 per night.
- Entry-level properties (Bottom 25%) earn around $71 per night.
Average Daily Rate (ADR) Trend by Month in Chanverrie
Get Live Chanverrie Market Intelligence 👇

Explore Real-time Analytics
Airbnb Seasonality Analysis & Trends in Chanverrie (2025)
Peak Season (August, May, July)
- Revenue averages $2,612 per month
- Occupancy rates average 65.2%
- Daily rates average $117
Shoulder Season
- Revenue averages $1,651 per month
- Occupancy maintains around 43.4%
- Daily rates hold near $117
Low Season (January, February, March)
- Revenue drops to average $884 per month
- Occupancy decreases to average 23.0%
- Daily rates adjust to average $119
Seasonality Insights for Chanverrie
- The Airbnb seasonality in Chanverrie shows highly seasonal trends requiring careful strategy. While the sections above show seasonal averages, it's also insightful to look at the extremes:
- During the high season, the absolute peak month showcases Chanverrie's highest earning potential, with monthly revenues capable of climbing to $2,928, occupancy reaching a high of 79.0%, and ADRs peaking at $121.
- Conversely, the slowest single month of the year, typically falling within the low season, marks the market's lowest point. In this month, revenue might dip to $568, occupancy could drop to 16.9%, and ADRs may adjust down to $113.
- Understanding both the seasonal averages and these monthly peaks and troughs in revenue, occupancy, and ADR is crucial for maximizing your Airbnb profit potential in Chanverrie.
Seasonal Strategies for Maximizing Profit
- Peak Season: Maximize revenue through premium pricing and potentially longer minimum stays. Ensure high availability.
- Low Season: Offer competitive pricing, special promotions (e.g., extended stay discounts), and flexible cancellation policies. Target off-season travelers like remote workers or budget-conscious guests.
- Shoulder Seasons: Implement dynamic pricing that balances peak and low rates. Target weekend travelers or specific events. Offer slightly more flexible terms than peak season.
- Regularly analyze your own performance against these Chanverrie seasonality benchmarks and adjust your pricing and availability strategy accordingly.
Best Areas for Airbnb Investment in Chanverrie (2025)
Exploring the top neighborhoods for short-term rentals in Chanverrie? This section highlights key areas, outlining why they are attractive for hosts and guests, along with notable local attractions. Consider these locations based on your target guest profile and investment strategy.
| Neighborhood / Area | Why Host Here? (Target Guests & Appeal) | Key Attractions & Landmarks |
|---|---|---|
| City Center | The heart of Chanverrie, filled with charming streets, shops, and local cafes. It's a popular spot for tourists who want to experience the local culture and amenities. | Château de Chanverrie, Place de la Mairie, Le Parc des Rochers, Les Halles de Chanverrie, Église Saint-Antoine |
| Historic District | Known for its rich history and traditional architecture, this area offers a unique glimpse into the past and attracts visitors interested in heritage and architecture. | Historical museum, Old town streets, Local artisan shops, Cultural festivals, Guided tours |
| Nature Trails | A serene area popular for nature lovers and outdoor enthusiasts, featuring beautiful walking and biking trails. Ideal for those looking to relax and enjoy the outdoors. | La Forêt de la Basse Maine, Parcours de santé, Lac de la Follière, Cycling paths, Picnic areas |
| Nearby Vineyards | Surrounded by picturesque vineyards, this area attracts wine lovers and those interested in gastronomic experiences, making it a perfect place for travelers seeking local wines and cuisine. | Vineyard tours, Wine tasting events, Local restaurants, Winery shops, Culinary workshops |
| Shopping District | A bustling shopping area with a mix of local boutiques and major brands. It draws both tourists and locals for shopping and dining experiences. | Open-air markets, Shopping centers, Local crafts, Restaurants, Cafés |
| Cultural Zone | This area is vibrant with art galleries, theatres, and cultural events, appealing to visitors interested in the arts and community events throughout the year. | Art galleries, Theatre performances, Music festivals, Workshops, Public art installations |
| Parks and Recreation | Home to well-maintained parks and recreational facilities, this area is perfect for families and individuals looking to enjoy outdoor activities and community events. | Public parks, Playgrounds, Sports fields, Community events, Nature reserves |
| Riverside Area | A scenic riverfront area that offers beautiful views and outdoor activities such as kayaking and picnicking, popular with both locals and tourists looking for leisure options. | River cruises, Water sports, Picnic spots, Scenic walking paths, Fishing areas |
Understanding Airbnb License Requirements & STR Laws in Chanverrie (2025)
Yes, Chanverrie, Pays de la Loire, France enforces high STR regulations. Obtaining a license and ensuring compliance is almost certainly required according to current 2025 STR laws. Always verify the latest short term rental regulations and Airbnb license requirements directly with local government authorities for Chanverrie to ensure full compliance before hosting.
(Source: AirROI data, 2025, based on 30% licensed listings)
Top Performing Airbnb Properties in Chanverrie (2025)
Benchmark your potential! Explore examples of top-performing Airbnb properties in Chanverriebased on Trailing Twelve Month (TTM) revenue. Analyze their characteristics, revenue, occupancy rate, and ADR to understand what drives success in this market.
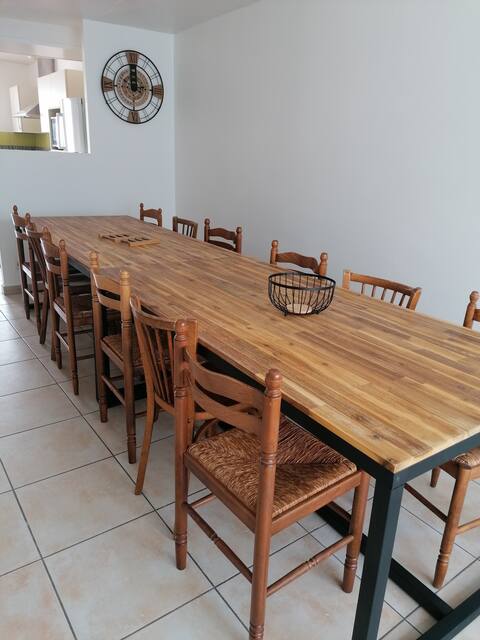
House 10/12pers center town 5 minutes from Puy Du Fou
Entire Place • 3 bedrooms

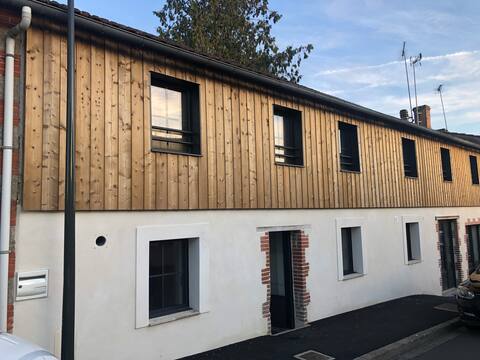
La Parenthèse Vendéenne, 10mn from Puy du Fou
Entire Place • 4 bedrooms

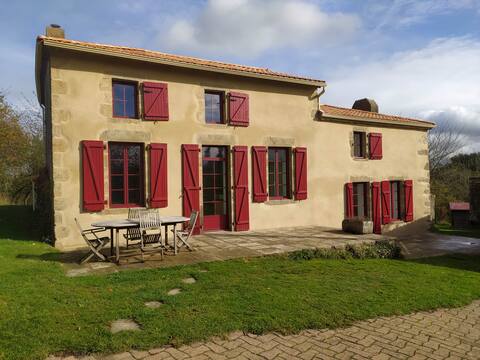
Private relaxing cottage and sport 5 km Puy du Fou
Entire Place • 2 bedrooms
Logis de la Tonnellerie 5 minutes from Puy Du Fou
Entire Place • 5 bedrooms
House less than 10 mins from Puy du Fou
Entire Place • 3 bedrooms

La Bessonnette near Puy du Fou
Entire Place • 3 bedrooms
Note: Performance varies based on location, size, amenities, seasonality, and management quality. Data reflects the past 12 months.
Top Performing Airbnb Hosts in Chanverrie (2025)
Learn from the best! This table showcases top-performing Airbnb hosts in Chanverrie based on the number of properties managed and estimated total revenue over the past year. Analyze their scale and performance metrics.
| Host Name | Properties | Grossing Revenue | Stay Reviews | Avg Rating |
|---|---|---|---|---|
| Lionel | 5 | $113,263 | 1548 | 4.87/5.0 |
| Angélique | 3 | $69,068 | 173 | 4.77/5.0 |
| Marie-Joëlle | 1 | $67,399 | 10 | 5.00/5.0 |
| Elodie | 2 | $59,059 | 47 | 5.00/5.0 |
| Victor - Tranquiloue | 5 | $53,674 | 143 | 3.75/5.0 |
| Nadine Et Juan-Manuel | 5 | $51,771 | 678 | 4.77/5.0 |
| Corentin | 3 | $50,182 | 53 | 4.91/5.0 |
| CHK Conciergerie | 4 | $38,206 | 33 | 4.66/5.0 |
| Conciergerie Bien Chez Vous | 1 | $37,709 | 69 | 4.87/5.0 |
| Didier | 3 | $37,352 | 21 | 4.73/5.0 |
Analyzing the strategies of top hosts, such as their property selection, pricing, and guest communication, can offer valuable lessons for optimizing your own Airbnb operations in Chanverrie.
Dive Deeper: Advanced Chanverrie STR Market Data (2025)
Ready to unlock more insights? AirROI provides access to advanced metrics and comprehensive Airbnb data for Chanverrie. Explore detailed analytics beyond this report to refine your investment strategy, optimize pricing, and maximize your vacation rental profits.
Explore Advanced MetricsChanverrie Short-Term Rental Market Composition (2025): Property & Room Types
Room Type Distribution
Property Type Distribution
Market Composition Insights for Chanverrie
- The Chanverrie Airbnb market composition is heavily skewed towards Entire Home/Apt listings, which make up 87.2% of the 86 active rentals. This indicates strong guest preference for privacy and space.
- Looking at the property type distribution in Chanverrie, House properties are the most common (53.5%), reflecting the local real estate landscape.
- Houses represent a significant 53.5% portion, catering likely to families or larger groups.
- The presence of 10.5% Hotel/Boutique listings indicates integration with traditional hospitality.
- Smaller segments like others (combined 2.3%) offer potential for unique stay experiences.
Chanverrie Airbnb Room Capacity Analysis (2025): Bedroom Distribution
Distribution of Listings by Number of Bedrooms
Room Capacity Insights for Chanverrie
- The dominant room capacity in Chanverrie is 1 bedroom listings, making up 32.6% of the market. This suggests a strong demand for properties suitable for couples or solo travelers.
- Together, 1 bedroom and 2 bedrooms properties represent 64.0% of the active Airbnb listings in Chanverrie, indicating a high concentration in these sizes.
Chanverrie Vacation Rental Guest Capacity Trends (2025)
Distribution of Listings by Guest Capacity
Guest Capacity Insights for Chanverrie
- The most common guest capacity trend in Chanverrie vacation rentals is listings accommodating 4 guests (27.9%). This suggests the primary traveler segment is likely small families or groups.
- Properties designed for 4 guests and 8+ guests dominate the Chanverrie STR market, accounting for 51.2% of listings.
- 33.7% of properties accommodate 6+ guests, serving the market segment for larger families or group travel in Chanverrie.
- On average, properties in Chanverrie are equipped to host 4.4 guests.
Chanverrie Airbnb Booking Patterns (2025): Available vs. Booked Days
Available Days Distribution
Booked Days Distribution
Booking Pattern Insights for Chanverrie
- The most common availability pattern in Chanverrie falls within the 181-270 days range, representing 58.1% of listings. This suggests many properties have significant open periods on their calendars.
- Approximately 81.4% of listings show high availability (181+ days open annually), indicating potential for increased bookings or specific owner usage patterns.
- For booked days, the 91-180 days range is most frequent in Chanverrie (58.1%), reflecting common guest stay durations or potential owner blocking patterns.
- A notable 19.8% of properties secure long booking periods (181+ days booked per year), highlighting successful long-term rental strategies or significant owner usage.
Chanverrie Airbnb Minimum Stay Requirements Analysis
Distribution of Listings by Minimum Night Requirement
1 Night
17 listings
20% of total
2 Nights
53 listings
62.4% of total
3 Nights
5 listings
5.9% of total
7-29 Nights
1 listings
1.2% of total
30+ Nights
9 listings
10.6% of total
Key Insights
- The most prevalent minimum stay requirement in Chanverrie is 2 Nights, adopted by 62.4% of listings. This highlights the market's preference for shorter, flexible bookings.
- A strong majority (82.4%) of the Chanverrie Airbnb data shows acceptance of very short stays (1-2 nights), indicating a dynamic, high-turnover market.
- A significant segment (10.6%) caters to monthly stays (30+ nights) in Chanverrie, pointing to opportunities in the extended-stay market.
Recommendations
- Align with the market by considering a 2 Nights minimum stay, as 62.4% of Chanverrie hosts use this setting.
- If feasible, allowing 1-night stays, especially midweek or during low season, could capture last-minute bookings, as only 20% currently do.
- Explore offering discounts for stays of 30+ nights to attract the 10.6% of the market seeking extended stays.
- Adjust minimum nights based on seasonality – potentially shorter during low season and longer during peak demand periods in Chanverrie.
Chanverrie Airbnb Cancellation Policy Trends Analysis (2025)
Flexible
16 listings
19.5% of total
Moderate
28 listings
34.1% of total
Firm
15 listings
18.3% of total
Strict
23 listings
28% of total
Cancellation Policy Insights for Chanverrie
- The prevailing Airbnb cancellation policy trend in Chanverrie is Moderate, used by 34.1% of listings.
- There's a relatively balanced mix between guest-friendly (53.6%) and stricter (46.3%) policies, offering choices for different guest needs.
Recommendations for Hosts
- Consider adopting a Moderate policy to align with the 34.1% market standard in Chanverrie.
- Regularly review your cancellation policy against competitors and market demand shifts in Chanverrie.
Chanverrie STR Booking Lead Time Analysis (2025)
Average Booking Lead Time by Month
Booking Lead Time Insights for Chanverrie
- The overall average booking lead time for vacation rentals in Chanverrie is 66 days.
- Guests book furthest in advance for stays during June (average 129 days), likely coinciding with peak travel demand or local events.
- The shortest booking windows occur for stays in January (average 42 days), indicating more last-minute travel plans during this time.
- Seasonally, Summer (110 days avg.) sees the longest lead times, while Winter (54 days avg.) has the shortest, reflecting typical travel planning cycles.
Recommendations for Hosts
- Use the overall average lead time (66 days) as a baseline for your pricing and availability strategy in Chanverrie.
- For June stays, consider implementing length-of-stay discounts or slightly higher rates for bookings made less than 129 days out to capitalize on advance planning.
- Target marketing efforts for the Summer season well in advance (at least 110 days) to capture early planners.
- Monitor your own booking lead times against these Chanverrie averages to identify opportunities for dynamic pricing adjustments.
Popular & Essential Airbnb Amenities in Chanverrie (2025)
Amenity Prevalence
Amenity Insights for Chanverrie
- Popular amenities like Smoke alarm, Hot water, Free parking on premises are common but not universal. Offering these can provide a competitive edge.
- Warning: Wifi is not universally provided but is considered essential globally. Ensure reliable Wifi is offered.
Recommendations for Hosts
- Consider adding popular differentiators like Smoke alarm or Hot water to increase appeal.
- Highlight unique or less common amenities you offer (e.g., hot tub, dedicated workspace, EV charger) in your listing description and photos.
- Regularly check competitor amenities in Chanverrie to stay competitive.
Chanverrie Airbnb Guest Demographics & Profile Analysis (2025)
Guest Profile Summary for Chanverrie
- The typical guest profile for Airbnb in Chanverrie consists of primarily domestic travelers (96%), often arriving from nearby Paris, typically belonging to the Post-2000s (Gen Z/Alpha) group (50%), primarily speaking French or English.
- Domestic travelers account for 96.0% of guests.
- Key international markets include France (96%) and Belgium (1%).
- Top languages spoken are French (51.8%) followed by English (26.5%).
- A significant demographic segment is the Post-2000s (Gen Z/Alpha) group, representing 50% of guests.
Recommendations for Hosts
- Target domestic marketing efforts towards travelers from Paris and Bordeaux.
- Tailor amenities and listing descriptions to appeal to the dominant Post-2000s (Gen Z/Alpha) demographic (e.g., highlight fast WiFi, smart home features, local guides).
- Highlight unique local experiences or amenities relevant to the primary guest profile.
- Consider seasonal promotions aligned with peak travel times for key origin markets.
Nearby Short-Term Rental Market Comparison
How does the Chanverrie Airbnb market stack up against its neighbors? Compare key performance metrics like average monthly revenue, ADR, and occupancy rates in surrounding areas to understand the broader regional STR landscape.
| Market | Active Properties | Monthly Revenue | Daily Rate | Avg. Occupancy |
|---|---|---|---|---|
| Coteaux-sur-Loire | 19 | $3,328 | $270.00 | 41% |
| Villiers-sur-Loir | 10 | $2,967 | $216.51 | 41% |
| Artannes-sur-Indre | 21 | $2,949 | $275.91 | 41% |
| Vallon-sur-Gée | 11 | $2,913 | $379.01 | 30% |
| Bourneau | 11 | $2,747 | $442.07 | 35% |
| Nuaillé-d'Aunis | 10 | $2,741 | $373.83 | 37% |
| Ambillou | 18 | $2,701 | $370.97 | 28% |
| Le Bois-Plage-en-Ré | 303 | $2,528 | $284.63 | 45% |
| Chambellay | 11 | $2,525 | $255.24 | 34% |
| Le Grand-Pressigny | 11 | $2,511 | $266.72 | 31% |