Challans Airbnb Market Analysis 2025: Short Term Rental Data & Vacation Rental Statistics in Pays de la Loire, France
Is Airbnb profitable in Challans in 2025? Explore comprehensive Airbnb analytics for Challans, Pays de la Loire, France to uncover income potential. This 2025 STR market report for Challans, based on AirROI data from April 2024 to March 2025, reveals key trends in the niche market of 61 active listings.
Whether you're considering an Airbnb investment in Challans, optimizing your existing vacation rental, or exploring rental arbitrage opportunities, understanding the Challans Airbnb data is crucial. Leveraging the low regulation environment is key to maximizing your short term rental income potential. Let's dive into the specifics.
Key Challans Airbnb Performance Metrics Overview
Monthly Airbnb Revenue Variations & Income Potential in Challans (2025)
Understanding the monthly revenue variations for Airbnb listings in Challans is key to maximizing your short term rental income potential. Seasonality significantly impacts earnings. Our analysis, based on data from the past 12 months, shows that the peak revenue month for STRs in Challans is typically August, while March often presents the lowest earnings, highlighting opportunities for strategic pricing adjustments during shoulder and low seasons. Explore the typical Airbnb income in Challans across different performance tiers:
- Best-in-class properties (Top 10%) achieve $2,431+ monthly, often utilizing dynamic pricing and superior guest experiences.
- Strong performing properties (Top 25%) earn $1,512 or more, indicating effective management and desirable locations/amenities.
- Typical properties (Median) generate around $978 per month, representing the average market performance.
- Entry-level properties (Bottom 25%) see earnings around $551, often with potential for optimization.
Average Monthly Airbnb Earnings Trend in Challans
Challans Airbnb Occupancy Rate Trends (2025)
Maximize your bookings by understanding the Challans STR occupancy trends. Seasonal demand shifts significantly influence how often properties are booked. Typically, Augustsees the highest demand (peak season occupancy), while March experiences the lowest (low season). Effective strategies, like adjusting minimum stays or offering promotions, can boost occupancy during slower periods. Here's how different property tiers perform in Challans:
- Best-in-class properties (Top 10%) achieve 77%+ occupancy, indicating high desirability and potentially optimized availability.
- Strong performing properties (Top 25%) maintain 61% or higher occupancy, suggesting good market fit and guest satisfaction.
- Typical properties (Median) have an occupancy rate around 38%.
- Entry-level properties (Bottom 25%) average 22% occupancy, potentially facing higher vacancy.
Average Monthly Occupancy Rate Trend in Challans
Average Daily Rate (ADR) Airbnb Trends in Challans (2025)
Effective short term rental pricing strategy in Challans involves understanding monthly ADR fluctuations. The Average Daily Rate (ADR) for Airbnb in Challans typically peaks in August and dips lowest during March. Leveraging Airbnb dynamic pricing tools or strategies based on this seasonality can significantly boost revenue. Here's a look at the typical nightly rates achieved:
- Best-in-class properties (Top 10%) command rates of $143+ per night, often due to premium features or locations.
- Strong performing properties (Top 25%) achieve nightly rates of $104 or more.
- Typical properties (Median) charge around $70 per night.
- Entry-level properties (Bottom 25%) earn around $55 per night.
Average Daily Rate (ADR) Trend by Month in Challans
Get Live Challans Market Intelligence 👇

Explore Real-time Analytics
Airbnb Seasonality Analysis & Trends in Challans (2025)
Peak Season (August, July, April)
- Revenue averages $1,867 per month
- Occupancy rates average 56.9%
- Daily rates average $101
Shoulder Season
- Revenue averages $1,229 per month
- Occupancy maintains around 39.6%
- Daily rates hold near $94
Low Season (January, February, March)
- Revenue drops to average $712 per month
- Occupancy decreases to average 32.1%
- Daily rates adjust to average $79
Seasonality Insights for Challans
- The Airbnb seasonality in Challans shows highly seasonal trends requiring careful strategy. While the sections above show seasonal averages, it's also insightful to look at the extremes:
- During the high season, the absolute peak month showcases Challans's highest earning potential, with monthly revenues capable of climbing to $2,168, occupancy reaching a high of 70.2%, and ADRs peaking at $102.
- Conversely, the slowest single month of the year, typically falling within the low season, marks the market's lowest point. In this month, revenue might dip to $625, occupancy could drop to 28.9%, and ADRs may adjust down to $79.
- Understanding both the seasonal averages and these monthly peaks and troughs in revenue, occupancy, and ADR is crucial for maximizing your Airbnb profit potential in Challans.
Seasonal Strategies for Maximizing Profit
- Peak Season: Maximize revenue through premium pricing and potentially longer minimum stays. Ensure high availability.
- Low Season: Offer competitive pricing, special promotions (e.g., extended stay discounts), and flexible cancellation policies. Target off-season travelers like remote workers or budget-conscious guests.
- Shoulder Seasons: Implement dynamic pricing that balances peak and low rates. Target weekend travelers or specific events. Offer slightly more flexible terms than peak season.
- Regularly analyze your own performance against these Challans seasonality benchmarks and adjust your pricing and availability strategy accordingly.
Best Areas for Airbnb Investment in Challans (2025)
Exploring the top neighborhoods for short-term rentals in Challans? This section highlights key areas, outlining why they are attractive for hosts and guests, along with notable local attractions. Consider these locations based on your target guest profile and investment strategy.
| Neighborhood / Area | Why Host Here? (Target Guests & Appeal) | Key Attractions & Landmarks |
|---|---|---|
| Château de Gilles | Historic castle located near Challans offering a unique experience for guests. Ideal for those looking for a romantic getaway or a family vacation in a majestic setting. | Château de Gilles, Parc de la Brunière, local vineyards, walking trails, historic sites |
| Les Sables-d'Olonne | Beautiful beach town just a short drive from Challans, popular for its beaches and water activities. Great for families and beach lovers. | Promenade de l'Océan, Plage de Sauveterre, Port Olona, Zoo des Sables d'Olonne, Les Sables-d'Olonne Aquarium |
| Saint Jean de Monts | Charming coastal town known for its scenic beaches and outdoor activities. Appeals to families and tourists seeking relaxation by the sea. | La Corniche, beachfront boardwalk, Cycling paths, forest of Pays de Monts, local markets |
| Noirmoutier-en-l'Île | Picturesque island known for its beautiful scenery and historical sites. Attracts visitors looking for nature and tranquility. | Noirmoutier Castle, Ile de Noirmoutier beaches, Salt marshes, Lighthouse at Cape Finisterre, Château des Duc de Bretagne |
| Les Epesses | Located near theme parks like Puy du Fou, it attracts thrill-seekers and families looking for entertainment. | Puy du Fou, Historical reenactments, outdoor festivals, rural landscapes, local cuisine |
| Saint Gilles Croix de Vie | A vibrant coastal town known for its fishing port and lively promenade, making it ideal for seaside holidays with various aquatic activities. | Marina, beachfront cafés, Flea markets, Beach activities, Fishing port |
| Challans City Center | The heart of Challans, bustling with shops, restaurants, and local culture. Perfect for those wanting to experience the local lifestyle. | Market square, Historical buildings, Local shops, Restaurants, Cultural events |
| Corniche Vendéenne | Stunning coastline with cliffs and beautiful views, attracting nature lovers and adventure seekers alike. | Cliffside walks, beach access, viewpoints, wildlife spotting, outdoor sports |
Understanding Airbnb License Requirements & STR Laws in Challans (2025)
While Challans, Pays de la Loire, France currently shows low STR regulations, specific Airbnb license requirements might still exist or change. Always verify the latest short term rental regulations and Airbnb license requirements directly with local government authorities for Challans to ensure full compliance before hosting.
(Source: AirROI data, 2025, based on 5% licensed listings)
Top Performing Airbnb Properties in Challans (2025)
Benchmark your potential! Explore examples of top-performing Airbnb properties in Challansbased on Trailing Twelve Month (TTM) revenue. Analyze their characteristics, revenue, occupancy rate, and ADR to understand what drives success in this market.
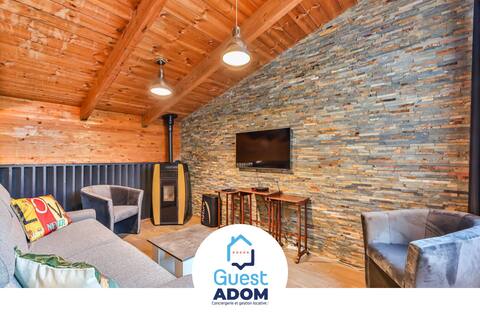
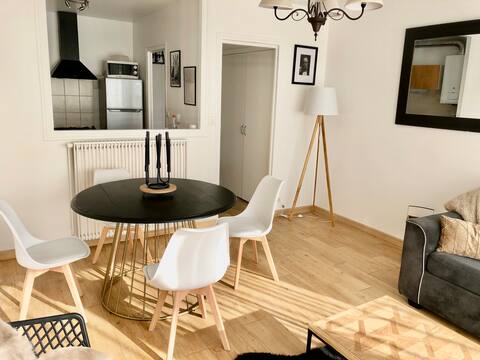
The atypical - Indoor pool house
Entire Place • 4 bedrooms
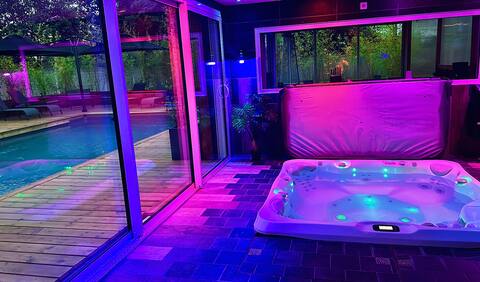
The must-see / Jaccuzi-Piscine-Sauna-Hammam
Entire Place • 2 bedrooms
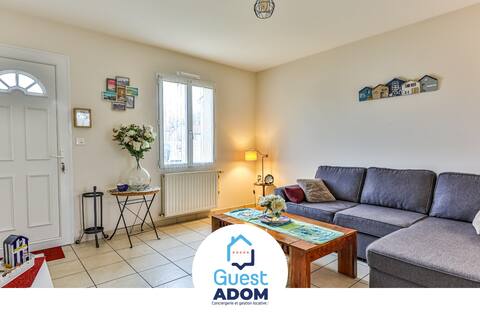
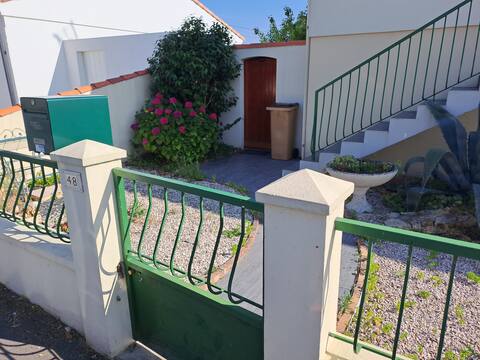
Les Pinsons - House with garden
Entire Place • 2 bedrooms
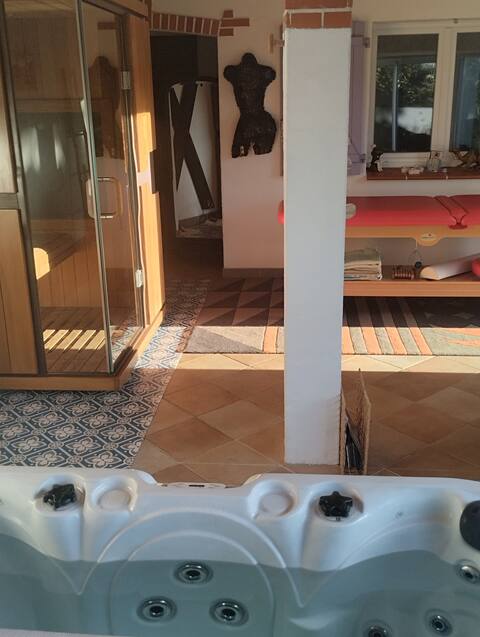
nudist Eden
Private Room • N/A
Lapartchallandans (near city center)
Entire Place • 2 bedrooms
Beautiful comfortable apartment close to amenities
Entire Place • 1 bedroom
Note: Performance varies based on location, size, amenities, seasonality, and management quality. Data reflects the past 12 months.
Top Performing Airbnb Hosts in Challans (2025)
Learn from the best! This table showcases top-performing Airbnb hosts in Challans based on the number of properties managed and estimated total revenue over the past year. Analyze their scale and performance metrics.
| Host Name | Properties | Grossing Revenue | Stay Reviews | Avg Rating |
|---|---|---|---|---|
| Guest Adom | 3 | $108,190 | 56 | 3.27/5.0 |
| Kevin | 1 | $55,205 | 204 | 4.80/5.0 |
| Romain | 5 | $48,223 | 46 | 4.92/5.0 |
| Gaudet | 2 | $34,063 | 143 | 4.92/5.0 |
| Yvan | 3 | $24,902 | 141 | 4.84/5.0 |
| Sébastien | 1 | $17,584 | 63 | 4.86/5.0 |
| Frédéric | 1 | $17,371 | 13 | 4.77/5.0 |
| Alex | 1 | $16,563 | 113 | 4.90/5.0 |
| Laurent | 1 | $16,140 | 263 | 4.93/5.0 |
| Nabil | 2 | $15,935 | 4 | 2.38/5.0 |
Analyzing the strategies of top hosts, such as their property selection, pricing, and guest communication, can offer valuable lessons for optimizing your own Airbnb operations in Challans.
Dive Deeper: Advanced Challans STR Market Data (2025)
Ready to unlock more insights? AirROI provides access to advanced metrics and comprehensive Airbnb data for Challans. Explore detailed analytics beyond this report to refine your investment strategy, optimize pricing, and maximize your vacation rental profits.
Explore Advanced MetricsChallans Short-Term Rental Market Composition (2025): Property & Room Types
Room Type Distribution
Property Type Distribution
Market Composition Insights for Challans
- The Challans Airbnb market composition is heavily skewed towards Entire Home/Apt listings, which make up 83.6% of the 61 active rentals. This indicates strong guest preference for privacy and space.
- Looking at the property type distribution in Challans, House properties are the most common (52.5%), reflecting the local real estate landscape.
- Houses represent a significant 52.5% portion, catering likely to families or larger groups.
- The presence of 13.1% Hotel/Boutique listings indicates integration with traditional hospitality.
- Smaller segments like outdoor/unique (combined 3.3%) offer potential for unique stay experiences.
Challans Airbnb Room Capacity Analysis (2025): Bedroom Distribution
Distribution of Listings by Number of Bedrooms
Room Capacity Insights for Challans
- The dominant room capacity in Challans is 1 bedroom listings, making up 49.2% of the market. This suggests a strong demand for properties suitable for couples or solo travelers.
- Together, 1 bedroom and 2 bedrooms properties represent 70.5% of the active Airbnb listings in Challans, indicating a high concentration in these sizes.
- Listings with 3+ bedrooms (8.1%) represent a smaller niche, potentially indicating an underserved market for larger group accommodations in Challans.
Challans Vacation Rental Guest Capacity Trends (2025)
Distribution of Listings by Guest Capacity
Guest Capacity Insights for Challans
- The most common guest capacity trend in Challans vacation rentals is listings accommodating 4 guests (31.1%). This suggests the primary traveler segment is likely small families or groups.
- Properties designed for 4 guests and 2 guests dominate the Challans STR market, accounting for 62.2% of listings.
- 14.8% of properties accommodate 6+ guests, serving the market segment for larger families or group travel in Challans.
- On average, properties in Challans are equipped to host 3.3 guests.
Challans Airbnb Booking Patterns (2025): Available vs. Booked Days
Available Days Distribution
Booked Days Distribution
Booking Pattern Insights for Challans
- The most common availability pattern in Challans falls within the 271-366 days range, representing 39.3% of listings. This suggests many properties have significant open periods on their calendars.
- Approximately 73.7% of listings show high availability (181+ days open annually), indicating potential for increased bookings or specific owner usage patterns.
- For booked days, the 91-180 days range is most frequent in Challans (34.4%), reflecting common guest stay durations or potential owner blocking patterns.
- A notable 27.8% of properties secure long booking periods (181+ days booked per year), highlighting successful long-term rental strategies or significant owner usage.
Challans Airbnb Minimum Stay Requirements Analysis
Distribution of Listings by Minimum Night Requirement
1 Night
17 listings
28.8% of total
2 Nights
25 listings
42.4% of total
3 Nights
4 listings
6.8% of total
4-6 Nights
5 listings
8.5% of total
7-29 Nights
3 listings
5.1% of total
30+ Nights
5 listings
8.5% of total
Key Insights
- The most prevalent minimum stay requirement in Challans is 2 Nights, adopted by 42.4% of listings. This highlights the market's preference for shorter, flexible bookings.
- A strong majority (71.2%) of the Challans Airbnb data shows acceptance of very short stays (1-2 nights), indicating a dynamic, high-turnover market.
Recommendations
- Align with the market by considering a 2 Nights minimum stay, as 42.4% of Challans hosts use this setting.
- If feasible, allowing 1-night stays, especially midweek or during low season, could capture last-minute bookings, as only 28.8% currently do.
- Explore offering discounts for stays of 30+ nights to attract the 8.5% of the market seeking extended stays.
- Adjust minimum nights based on seasonality – potentially shorter during low season and longer during peak demand periods in Challans.
Challans Airbnb Cancellation Policy Trends Analysis (2025)
Flexible
15 listings
28.3% of total
Moderate
22 listings
41.5% of total
Firm
10 listings
18.9% of total
Strict
6 listings
11.3% of total
Cancellation Policy Insights for Challans
- The prevailing Airbnb cancellation policy trend in Challans is Moderate, used by 41.5% of listings.
- There's a relatively balanced mix between guest-friendly (69.8%) and stricter (30.2%) policies, offering choices for different guest needs.
Recommendations for Hosts
- Consider adopting a Moderate policy to align with the 41.5% market standard in Challans.
- Using a Strict policy might deter some guests, as only 11.3% of listings use it. Evaluate if potential revenue protection outweighs possible lower booking rates.
- Regularly review your cancellation policy against competitors and market demand shifts in Challans.
Challans STR Booking Lead Time Analysis (2025)
Average Booking Lead Time by Month
Booking Lead Time Insights for Challans
- The overall average booking lead time for vacation rentals in Challans is 43 days.
- Guests book furthest in advance for stays during August (average 75 days), likely coinciding with peak travel demand or local events.
- The shortest booking windows occur for stays in February (average 22 days), indicating more last-minute travel plans during this time.
- Seasonally, Summer (67 days avg.) sees the longest lead times, while Winter (30 days avg.) has the shortest, reflecting typical travel planning cycles.
Recommendations for Hosts
- Use the overall average lead time (43 days) as a baseline for your pricing and availability strategy in Challans.
- For August stays, consider implementing length-of-stay discounts or slightly higher rates for bookings made less than 75 days out to capitalize on advance planning.
- Target marketing efforts for the Summer season well in advance (at least 67 days) to capture early planners.
- Monitor your own booking lead times against these Challans averages to identify opportunities for dynamic pricing adjustments.
Popular & Essential Airbnb Amenities in Challans (2025)
Amenity Prevalence
Amenity Insights for Challans
- Essential amenities in Challans that guests expect include: Heating. Lacking these (this) could significantly impact bookings.
- Popular amenities like Hot water, Wifi, Free parking on premises are common but not universal. Offering these can provide a competitive edge.
- Warning: Wifi is not universally provided but is considered essential globally. Ensure reliable Wifi is offered.
Recommendations for Hosts
- Ensure your listing includes all essential amenities for Challans: Heating.
- Prioritize adding missing essentials: Heating.
- Consider adding popular differentiators like Hot water or Wifi to increase appeal.
- Highlight unique or less common amenities you offer (e.g., hot tub, dedicated workspace, EV charger) in your listing description and photos.
- Regularly check competitor amenities in Challans to stay competitive.
Challans Airbnb Guest Demographics & Profile Analysis (2025)
Guest Profile Summary for Challans
- The typical guest profile for Airbnb in Challans consists of primarily domestic travelers (95%), often arriving from nearby Angers, typically belonging to the Post-2000s (Gen Z/Alpha) group (50%), primarily speaking French or English.
- Domestic travelers account for 95.4% of guests.
- Key international markets include France (95.4%) and United Kingdom (1%).
- Top languages spoken are French (55.1%) followed by English (26%).
- A significant demographic segment is the Post-2000s (Gen Z/Alpha) group, representing 50% of guests.
Recommendations for Hosts
- Target domestic marketing efforts towards travelers from Angers and Paris.
- Tailor amenities and listing descriptions to appeal to the dominant Post-2000s (Gen Z/Alpha) demographic (e.g., highlight fast WiFi, smart home features, local guides).
- Highlight unique local experiences or amenities relevant to the primary guest profile.
- Consider seasonal promotions aligned with peak travel times for key origin markets.
Nearby Short-Term Rental Market Comparison
How does the Challans Airbnb market stack up against its neighbors? Compare key performance metrics like average monthly revenue, ADR, and occupancy rates in surrounding areas to understand the broader regional STR landscape.
| Market | Active Properties | Monthly Revenue | Daily Rate | Avg. Occupancy |
|---|---|---|---|---|
| Vallon-sur-Gée | 11 | $2,913 | $379.01 | 30% |
| Bourneau | 11 | $2,747 | $442.07 | 35% |
| Nuaillé-d'Aunis | 10 | $2,741 | $373.83 | 37% |
| Le Bois-Plage-en-Ré | 303 | $2,528 | $284.63 | 45% |
| Chambellay | 11 | $2,525 | $255.24 | 34% |
| Sainte-Florence | 10 | $2,445 | $233.78 | 46% |
| Saint-Hippolyte | 10 | $2,443 | $204.98 | 44% |
| Abzac | 12 | $2,415 | $349.03 | 36% |
| La Flotte | 396 | $2,382 | $236.53 | 46% |
| Saint-Georges-des-Coteaux | 12 | $2,335 | $187.61 | 43% |