Châteaubriant Airbnb Market Analysis 2025: Short Term Rental Data & Vacation Rental Statistics in Pays de la Loire, France
Is Airbnb profitable in Châteaubriant in 2025? Explore comprehensive Airbnb analytics for Châteaubriant, Pays de la Loire, France to uncover income potential. This 2025 STR market report for Châteaubriant, based on AirROI data from April 2024 to March 2025, reveals key trends in the niche market of 48 active listings.
Whether you're considering an Airbnb investment in Châteaubriant, optimizing your existing vacation rental, or exploring rental arbitrage opportunities, understanding the Châteaubriant Airbnb data is crucial. Leveraging the low regulation environment is key to maximizing your short term rental income potential. Let's dive into the specifics.
Key Châteaubriant Airbnb Performance Metrics Overview
Monthly Airbnb Revenue Variations & Income Potential in Châteaubriant (2025)
Understanding the monthly revenue variations for Airbnb listings in Châteaubriant is key to maximizing your short term rental income potential. Seasonality significantly impacts earnings. Our analysis, based on data from the past 12 months, shows that the peak revenue month for STRs in Châteaubriant is typically May, while March often presents the lowest earnings, highlighting opportunities for strategic pricing adjustments during shoulder and low seasons. Explore the typical Airbnb income in Châteaubriant across different performance tiers:
- Best-in-class properties (Top 10%) achieve $1,849+ monthly, often utilizing dynamic pricing and superior guest experiences.
- Strong performing properties (Top 25%) earn $1,332 or more, indicating effective management and desirable locations/amenities.
- Typical properties (Median) generate around $840 per month, representing the average market performance.
- Entry-level properties (Bottom 25%) see earnings around $454, often with potential for optimization.
Average Monthly Airbnb Earnings Trend in Châteaubriant
Châteaubriant Airbnb Occupancy Rate Trends (2025)
Maximize your bookings by understanding the Châteaubriant STR occupancy trends. Seasonal demand shifts significantly influence how often properties are booked. Typically, Maysees the highest demand (peak season occupancy), while February experiences the lowest (low season). Effective strategies, like adjusting minimum stays or offering promotions, can boost occupancy during slower periods. Here's how different property tiers perform in Châteaubriant:
- Best-in-class properties (Top 10%) achieve 77%+ occupancy, indicating high desirability and potentially optimized availability.
- Strong performing properties (Top 25%) maintain 61% or higher occupancy, suggesting good market fit and guest satisfaction.
- Typical properties (Median) have an occupancy rate around 41%.
- Entry-level properties (Bottom 25%) average 23% occupancy, potentially facing higher vacancy.
Average Monthly Occupancy Rate Trend in Châteaubriant
Average Daily Rate (ADR) Airbnb Trends in Châteaubriant (2025)
Effective short term rental pricing strategy in Châteaubriant involves understanding monthly ADR fluctuations. The Average Daily Rate (ADR) for Airbnb in Châteaubriant typically peaks in September and dips lowest during March. Leveraging Airbnb dynamic pricing tools or strategies based on this seasonality can significantly boost revenue. Here's a look at the typical nightly rates achieved:
- Best-in-class properties (Top 10%) command rates of $106+ per night, often due to premium features or locations.
- Strong performing properties (Top 25%) achieve nightly rates of $75 or more.
- Typical properties (Median) charge around $56 per night.
- Entry-level properties (Bottom 25%) earn around $44 per night.
Average Daily Rate (ADR) Trend by Month in Châteaubriant
Get Live Châteaubriant Market Intelligence 👇
Explore Real-time Analytics
Airbnb Seasonality Analysis & Trends in Châteaubriant (2025)
Peak Season (May, June, August)
- Revenue averages $1,287 per month
- Occupancy rates average 47.6%
- Daily rates average $74
Shoulder Season
- Revenue averages $973 per month
- Occupancy maintains around 45.0%
- Daily rates hold near $71
Low Season (January, February, March)
- Revenue drops to average $724 per month
- Occupancy decreases to average 35.9%
- Daily rates adjust to average $64
Seasonality Insights for Châteaubriant
- The Airbnb seasonality in Châteaubriant shows highly seasonal trends requiring careful strategy. While the sections above show seasonal averages, it's also insightful to look at the extremes:
- During the high season, the absolute peak month showcases Châteaubriant's highest earning potential, with monthly revenues capable of climbing to $1,554, occupancy reaching a high of 51.4%, and ADRs peaking at $75.
- Conversely, the slowest single month of the year, typically falling within the low season, marks the market's lowest point. In this month, revenue might dip to $683, occupancy could drop to 34.1%, and ADRs may adjust down to $62.
- Understanding both the seasonal averages and these monthly peaks and troughs in revenue, occupancy, and ADR is crucial for maximizing your Airbnb profit potential in Châteaubriant.
Seasonal Strategies for Maximizing Profit
- Peak Season: Maximize revenue through premium pricing and potentially longer minimum stays. Ensure high availability.
- Low Season: Offer competitive pricing, special promotions (e.g., extended stay discounts), and flexible cancellation policies. Target off-season travelers like remote workers or budget-conscious guests.
- Shoulder Seasons: Implement dynamic pricing that balances peak and low rates. Target weekend travelers or specific events. Offer slightly more flexible terms than peak season.
- Regularly analyze your own performance against these Châteaubriant seasonality benchmarks and adjust your pricing and availability strategy accordingly.
Best Areas for Airbnb Investment in Châteaubriant (2025)
Exploring the top neighborhoods for short-term rentals in Châteaubriant? This section highlights key areas, outlining why they are attractive for hosts and guests, along with notable local attractions. Consider these locations based on your target guest profile and investment strategy.
| Neighborhood / Area | Why Host Here? (Target Guests & Appeal) | Key Attractions & Landmarks |
|---|---|---|
| Château de Châteaubriant | This historic castle attracts tourists interested in history and architecture. It's a significant landmark in the area and hosts various events throughout the year. | Château de Châteaubriant, Historic gardens, Museum of Châteaubriant, Local art exhibitions |
| Centre-ville | The town center is vibrant and has a mix of shops, cafes, and restaurants, making it a prime spot for visitors looking to enjoy the local culture and cuisine. | Plaza Charles-de-Gaulle, Local markets, Café culture, Shopping streets, Restaurants |
| Parc de la Mée | A scenic park offering natural beauty and opportunities for outdoor activities. Attracts families and nature lovers. | Walking trails, Picnic areas, Fishing spots, Playgrounds |
| Les Forges de la Loire | An area known for its historical significance in industry and its proximity to nature, offering unique experiences for visitors interested in history and the outdoors. | Historic forges, Nature walks, Arts and crafts events |
| Le Petit Châteaubriant | A charming neighborhood that offers a quieter experience while still being close to the town center, appealing to families and longer-term rentals. | Local parks, Family friendly activities, Community events |
| La Vallée de la Vilaine | This scenic area along the Vilaine river offers beautiful landscapes and outdoor activities, perfect for nature lovers and adventure seekers. | River activities, Biking trails, Fishing spots, Scenic views |
| Châteaubriant Market | Known for its vibrant local market, which happens several times a week, drawing visitors wanting to experience local products and hospitality. | Local foods, Craft products, Cultural exchanges |
| Surrounding Countryside | The rural areas around Châteaubriant offer charming gîtes and opportunities for agritourism, appealing to tourists looking for peace and quiet away from city life. | Countryside hiking, Farm visits, Wine tasting |
Understanding Airbnb License Requirements & STR Laws in Châteaubriant (2025)
While Châteaubriant, Pays de la Loire, France currently shows low STR regulations, specific Airbnb license requirements might still exist or change. Always verify the latest short term rental regulations and Airbnb license requirements directly with local government authorities for Châteaubriant to ensure full compliance before hosting.
(Source: AirROI data, 2025, based on 2% licensed listings)
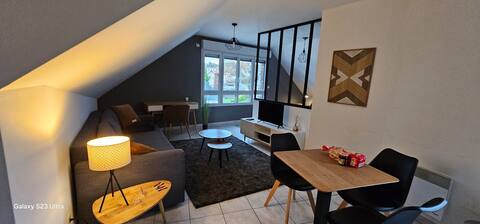
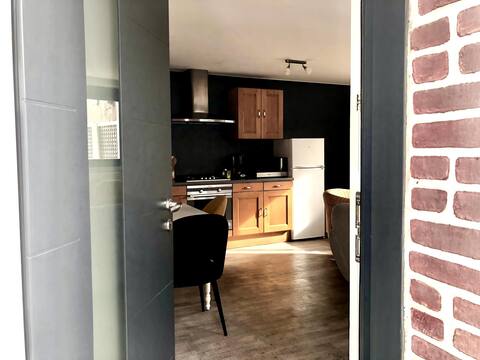
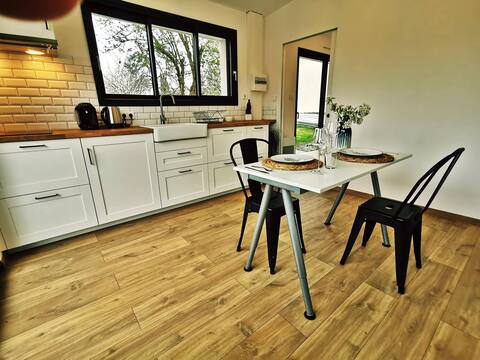
Top Performing Airbnb Properties in Châteaubriant (2025)
Benchmark your potential! Explore examples of top-performing Airbnb properties in Châteaubriantbased on Trailing Twelve Month (TTM) revenue. Analyze their characteristics, revenue, occupancy rate, and ADR to understand what drives success in this market.

La Maison des Flamingles Flaming
Entire Place • 3 bedrooms

The Turtle Apartment
Entire Place • 2 bedrooms
Appart'hotel Châteaubriant
Entire Place • 1 bedroom

T2 bis with 2 bedrooms in the city center
Entire Place • 2 bedrooms
Pretty little downtown house - 1 to 4 people
Entire Place • 2 bedrooms
The apartment in the garden of the suburbs...
Entire Place • 1 bedroom
Note: Performance varies based on location, size, amenities, seasonality, and management quality. Data reflects the past 12 months.
Top Performing Airbnb Hosts in Châteaubriant (2025)
Learn from the best! This table showcases top-performing Airbnb hosts in Châteaubriant based on the number of properties managed and estimated total revenue over the past year. Analyze their scale and performance metrics.
| Host Name | Properties | Grossing Revenue | Stay Reviews | Avg Rating |
|---|---|---|---|---|
| Sylvie | 9 | $115,668 | 395 | 4.72/5.0 |
| Cati Et Damien | 3 | $41,231 | 382 | 4.92/5.0 |
| Sandrine Et Pascal | 3 | $39,486 | 32 | 4.87/5.0 |
| ★ Dormir Comme A La Maison★ | 7 | $27,388 | 114 | 4.53/5.0 |
| Host #117509133 | 4 | $21,432 | 0 | 0.00/5.0 |
| Noel | 1 | $18,253 | 50 | 4.94/5.0 |
| Sébastien | 2 | $16,672 | 210 | 4.92/5.0 |
| Magali | 1 | $15,057 | 207 | 4.90/5.0 |
| Amélie | 1 | $13,981 | 25 | 4.88/5.0 |
| Nacali | 1 | $13,339 | 48 | 4.92/5.0 |
Analyzing the strategies of top hosts, such as their property selection, pricing, and guest communication, can offer valuable lessons for optimizing your own Airbnb operations in Châteaubriant.
Dive Deeper: Advanced Châteaubriant STR Market Data (2025)
Ready to unlock more insights? AirROI provides access to advanced metrics and comprehensive Airbnb data for Châteaubriant. Explore detailed analytics beyond this report to refine your investment strategy, optimize pricing, and maximize your vacation rental profits.
Explore Advanced MetricsChâteaubriant Short-Term Rental Market Composition (2025): Property & Room Types
Room Type Distribution
Property Type Distribution
Market Composition Insights for Châteaubriant
- The Châteaubriant Airbnb market composition is heavily skewed towards Entire Home/Apt listings, which make up 68.8% of the 48 active rentals. This indicates strong guest preference for privacy and space.
- However, a notable 31.3% share for Private Rooms suggests opportunities for budget-conscious travelers or hosts renting out spare rooms.
- Looking at the property type distribution in Châteaubriant, Apartment/Condo properties are the most common (47.9%), reflecting the local real estate landscape.
- Houses represent a significant 47.9% portion, catering likely to families or larger groups.
- Smaller segments like hotel/boutique (combined 4.2%) offer potential for unique stay experiences.
Châteaubriant Airbnb Room Capacity Analysis (2025): Bedroom Distribution
Distribution of Listings by Number of Bedrooms
Room Capacity Insights for Châteaubriant
- The dominant room capacity in Châteaubriant is 1 bedroom listings, making up 39.6% of the market. This suggests a strong demand for properties suitable for couples or solo travelers.
- Together, 1 bedroom and 2 bedrooms properties represent 56.3% of the active Airbnb listings in Châteaubriant, indicating a high concentration in these sizes.
Châteaubriant Vacation Rental Guest Capacity Trends (2025)
Distribution of Listings by Guest Capacity
Guest Capacity Insights for Châteaubriant
- The most common guest capacity trend in Châteaubriant vacation rentals is listings accommodating 4 guests (31.3%). This suggests the primary traveler segment is likely small families or groups.
- Properties designed for 4 guests and 2 guests dominate the Châteaubriant STR market, accounting for 56.3% of listings.
- 14.6% of properties accommodate 6+ guests, serving the market segment for larger families or group travel in Châteaubriant.
- On average, properties in Châteaubriant are equipped to host 3.0 guests.
Châteaubriant Airbnb Booking Patterns (2025): Available vs. Booked Days
Available Days Distribution
Booked Days Distribution
Booking Pattern Insights for Châteaubriant
- The most common availability pattern in Châteaubriant falls within the 271-366 days range, representing 39.6% of listings. This suggests many properties have significant open periods on their calendars.
- Approximately 72.9% of listings show high availability (181+ days open annually), indicating potential for increased bookings or specific owner usage patterns.
- For booked days, the 91-180 days range is most frequent in Châteaubriant (35.4%), reflecting common guest stay durations or potential owner blocking patterns.
- A notable 27.1% of properties secure long booking periods (181+ days booked per year), highlighting successful long-term rental strategies or significant owner usage.
Châteaubriant Airbnb Minimum Stay Requirements Analysis
Distribution of Listings by Minimum Night Requirement
1 Night
22 listings
50% of total
2 Nights
10 listings
22.7% of total
4-6 Nights
1 listings
2.3% of total
30+ Nights
11 listings
25% of total
Key Insights
- The most prevalent minimum stay requirement in Châteaubriant is 1 Night, adopted by 50% of listings. This highlights the market's preference for shorter, flexible bookings.
- A strong majority (72.7%) of the Châteaubriant Airbnb data shows acceptance of very short stays (1-2 nights), indicating a dynamic, high-turnover market.
- A significant segment (25%) caters to monthly stays (30+ nights) in Châteaubriant, pointing to opportunities in the extended-stay market.
Recommendations
- Align with the market by considering a 1 Night minimum stay, as 50% of Châteaubriant hosts use this setting.
- Explore offering discounts for stays of 30+ nights to attract the 25% of the market seeking extended stays.
- Adjust minimum nights based on seasonality – potentially shorter during low season and longer during peak demand periods in Châteaubriant.
Châteaubriant Airbnb Cancellation Policy Trends Analysis (2025)
Flexible
23 listings
57.5% of total
Moderate
12 listings
30% of total
Strict
5 listings
12.5% of total
Cancellation Policy Insights for Châteaubriant
- The prevailing Airbnb cancellation policy trend in Châteaubriant is Flexible, used by 57.5% of listings.
- The market strongly favors guest-friendly terms, with 87.5% of listings offering Flexible or Moderate policies. This suggests guests in Châteaubriant may expect booking flexibility.
Recommendations for Hosts
- Consider adopting a Flexible policy to align with the 57.5% market standard in Châteaubriant.
- Given the high prevalence of Flexible policies (57.5%), offering this can enhance booking appeal, especially during shoulder seasons.
- Using a Strict policy might deter some guests, as only 12.5% of listings use it. Evaluate if potential revenue protection outweighs possible lower booking rates.
- Regularly review your cancellation policy against competitors and market demand shifts in Châteaubriant.
Châteaubriant STR Booking Lead Time Analysis (2025)
Average Booking Lead Time by Month
Booking Lead Time Insights for Châteaubriant
- The overall average booking lead time for vacation rentals in Châteaubriant is 37 days.
- Guests book furthest in advance for stays during September (average 56 days), likely coinciding with peak travel demand or local events.
- The shortest booking windows occur for stays in April (average 28 days), indicating more last-minute travel plans during this time.
- Seasonally, Winter (45 days avg.) sees the longest lead times, while Spring (33 days avg.) has the shortest, reflecting typical travel planning cycles.
Recommendations for Hosts
- Use the overall average lead time (37 days) as a baseline for your pricing and availability strategy in Châteaubriant.
- For September stays, consider implementing length-of-stay discounts or slightly higher rates for bookings made less than 56 days out to capitalize on advance planning.
- Target marketing efforts for the Winter season well in advance (at least 45 days) to capture early planners.
- Monitor your own booking lead times against these Châteaubriant averages to identify opportunities for dynamic pricing adjustments.
Popular & Essential Airbnb Amenities in Châteaubriant (2025)
Amenity Prevalence
Amenity Insights for Châteaubriant
- Essential amenities in Châteaubriant that guests expect include: Wifi, TV, Heating. Lacking these (any) could significantly impact bookings.
- Popular amenities like Kitchen, Free parking on premises, Cooking basics are common but not universal. Offering these can provide a competitive edge.
Recommendations for Hosts
- Ensure your listing includes all essential amenities for Châteaubriant: Wifi, TV, Heating.
- Prioritize adding missing essentials: Wifi, TV, Heating.
- Consider adding popular differentiators like Kitchen or Free parking on premises to increase appeal.
- Highlight unique or less common amenities you offer (e.g., hot tub, dedicated workspace, EV charger) in your listing description and photos.
- Regularly check competitor amenities in Châteaubriant to stay competitive.
Châteaubriant Airbnb Guest Demographics & Profile Analysis (2025)
Guest Profile Summary for Châteaubriant
- The typical guest profile for Airbnb in Châteaubriant consists of primarily domestic travelers (89%), often arriving from nearby Nantes, typically belonging to the Post-2000s (Gen Z/Alpha) group (50%), primarily speaking French or English.
- Domestic travelers account for 89.1% of guests.
- Key international markets include France (89.1%) and United Kingdom (2.9%).
- Top languages spoken are French (52%) followed by English (29.7%).
- A significant demographic segment is the Post-2000s (Gen Z/Alpha) group, representing 50% of guests.
Recommendations for Hosts
- Target domestic marketing efforts towards travelers from Nantes and Paris.
- Tailor amenities and listing descriptions to appeal to the dominant Post-2000s (Gen Z/Alpha) demographic (e.g., highlight fast WiFi, smart home features, local guides).
- Highlight unique local experiences or amenities relevant to the primary guest profile.
- Consider seasonal promotions aligned with peak travel times for key origin markets.
Nearby Short-Term Rental Market Comparison
How does the Châteaubriant Airbnb market stack up against its neighbors? Compare key performance metrics like average monthly revenue, ADR, and occupancy rates in surrounding areas to understand the broader regional STR landscape.
| Market | Active Properties | Monthly Revenue | Daily Rate | Avg. Occupancy |
|---|---|---|---|---|
| Moulins-le-Carbonnel | 11 | $3,213 | $320.85 | 35% |
| Vallon-sur-Gée | 11 | $2,913 | $379.01 | 30% |
| Bourneau | 11 | $2,747 | $442.07 | 35% |
| Nuaillé-d'Aunis | 10 | $2,741 | $373.83 | 37% |
| Le Bois-Plage-en-Ré | 303 | $2,528 | $284.63 | 45% |
| Chambellay | 11 | $2,525 | $255.24 | 34% |
| Sainte-Florence | 10 | $2,445 | $233.78 | 46% |
| La Flotte | 396 | $2,382 | $236.53 | 46% |
| Forges | 11 | $2,314 | $220.63 | 39% |
| Dœuil-sur-le-Mignon | 12 | $2,283 | $481.91 | 21% |