Angles Airbnb Market Analysis 2025: Short Term Rental Data & Vacation Rental Statistics in Pays de la Loire, France
Is Airbnb profitable in Angles in 2025? Explore comprehensive Airbnb analytics for Angles, Pays de la Loire, France to uncover income potential. This 2025 STR market report for Angles, based on AirROI data from April 2024 to March 2025, reveals key trends in the niche market of 54 active listings.
Whether you're considering an Airbnb investment in Angles, optimizing your existing vacation rental, or exploring rental arbitrage opportunities, understanding the Angles Airbnb data is crucial. Leveraging the low regulation environment is key to maximizing your short term rental income potential. Let's dive into the specifics.
Key Angles Airbnb Performance Metrics Overview
Monthly Airbnb Revenue Variations & Income Potential in Angles (2025)
Understanding the monthly revenue variations for Airbnb listings in Angles is key to maximizing your short term rental income potential. Seasonality significantly impacts earnings. Our analysis, based on data from the past 12 months, shows that the peak revenue month for STRs in Angles is typically August, while December often presents the lowest earnings, highlighting opportunities for strategic pricing adjustments during shoulder and low seasons. Explore the typical Airbnb income in Angles across different performance tiers:
- Best-in-class properties (Top 10%) achieve $3,882+ monthly, often utilizing dynamic pricing and superior guest experiences.
- Strong performing properties (Top 25%) earn $2,564 or more, indicating effective management and desirable locations/amenities.
- Typical properties (Median) generate around $1,348 per month, representing the average market performance.
- Entry-level properties (Bottom 25%) see earnings around $652, often with potential for optimization.
Average Monthly Airbnb Earnings Trend in Angles
Angles Airbnb Occupancy Rate Trends (2025)
Maximize your bookings by understanding the Angles STR occupancy trends. Seasonal demand shifts significantly influence how often properties are booked. Typically, Augustsees the highest demand (peak season occupancy), while March experiences the lowest (low season). Effective strategies, like adjusting minimum stays or offering promotions, can boost occupancy during slower periods. Here's how different property tiers perform in Angles:
- Best-in-class properties (Top 10%) achieve 65%+ occupancy, indicating high desirability and potentially optimized availability.
- Strong performing properties (Top 25%) maintain 51% or higher occupancy, suggesting good market fit and guest satisfaction.
- Typical properties (Median) have an occupancy rate around 32%.
- Entry-level properties (Bottom 25%) average 18% occupancy, potentially facing higher vacancy.
Average Monthly Occupancy Rate Trend in Angles
Average Daily Rate (ADR) Airbnb Trends in Angles (2025)
Effective short term rental pricing strategy in Angles involves understanding monthly ADR fluctuations. The Average Daily Rate (ADR) for Airbnb in Angles typically peaks in August and dips lowest during March. Leveraging Airbnb dynamic pricing tools or strategies based on this seasonality can significantly boost revenue. Here's a look at the typical nightly rates achieved:
- Best-in-class properties (Top 10%) command rates of $238+ per night, often due to premium features or locations.
- Strong performing properties (Top 25%) achieve nightly rates of $152 or more.
- Typical properties (Median) charge around $98 per night.
- Entry-level properties (Bottom 25%) earn around $66 per night.
Average Daily Rate (ADR) Trend by Month in Angles
Get Live Angles Market Intelligence 👇

Explore Real-time Analytics
Airbnb Seasonality Analysis & Trends in Angles (2025)
Peak Season (August, April, May)
- Revenue averages $3,086 per month
- Occupancy rates average 51.8%
- Daily rates average $136
Shoulder Season
- Revenue averages $1,759 per month
- Occupancy maintains around 32.9%
- Daily rates hold near $132
Low Season (October, November, December)
- Revenue drops to average $1,216 per month
- Occupancy decreases to average 26.5%
- Daily rates adjust to average $131
Seasonality Insights for Angles
- The Airbnb seasonality in Angles shows highly seasonal trends requiring careful strategy. While the sections above show seasonal averages, it's also insightful to look at the extremes:
- During the high season, the absolute peak month showcases Angles's highest earning potential, with monthly revenues capable of climbing to $3,325, occupancy reaching a high of 70.9%, and ADRs peaking at $145.
- Conversely, the slowest single month of the year, typically falling within the low season, marks the market's lowest point. In this month, revenue might dip to $1,199, occupancy could drop to 21.5%, and ADRs may adjust down to $123.
- Understanding both the seasonal averages and these monthly peaks and troughs in revenue, occupancy, and ADR is crucial for maximizing your Airbnb profit potential in Angles.
Seasonal Strategies for Maximizing Profit
- Peak Season: Maximize revenue through premium pricing and potentially longer minimum stays. Ensure high availability.
- Low Season: Offer competitive pricing, special promotions (e.g., extended stay discounts), and flexible cancellation policies. Target off-season travelers like remote workers or budget-conscious guests.
- Shoulder Seasons: Implement dynamic pricing that balances peak and low rates. Target weekend travelers or specific events. Offer slightly more flexible terms than peak season.
- Regularly analyze your own performance against these Angles seasonality benchmarks and adjust your pricing and availability strategy accordingly.
Best Areas for Airbnb Investment in Angles (2025)
Exploring the top neighborhoods for short-term rentals in Angles? This section highlights key areas, outlining why they are attractive for hosts and guests, along with notable local attractions. Consider these locations based on your target guest profile and investment strategy.
| Neighborhood / Area | Why Host Here? (Target Guests & Appeal) | Key Attractions & Landmarks |
|---|---|---|
| Nantes City Center | The vibrant heart of Nantes, ideal for tourists with its historical sites, restaurants, and shops. Perfect for travelers looking for a central location with access to cultural experiences and nightlife. | Château des Ducs de Bretagne, Les Machines de l'île, Passage Pommeraye, Place Royale, Nantes Cathedral |
| Saint-Nazaire | A coastal town famous for its maritime heritage and beautiful beaches, attracting both summer tourists and business travelers. Great for those seeking a seaside experience close to nature. | Escal'Atlantic, La Baule Beach, Saint-Nazaire Submarine Base, Ecomusée, Saint-Nazaire Port |
| Angers | Known for its historic architecture and vibrant cultural scene, Angers is a growing destination for tourists seeking picturesque landscapes and rich history. | Château d'Angers, Terra Botanica, Angers Cathedral, Maison d'Adam, Musee des Beaux-Arts |
| La Baule-Escoublac | A stylish resort town known for its long sandy beach and charming promenade, attracting both leisure travelers and luxury seekers looking for a relaxing getaway. | La Baule Beach, Pine Forest of La Baule, Aquabaule Water Park, Golf International Barrière, Casino Barrière |
| Les Sables-d'Olonne | Renowned for its beautiful beaches and vibrant seaside promenade, known as a family-friendly destination with plenty of activities for all ages. | Les Sables-d'Olonne Beach, Aquarium Le 7ème Continent, La Rochelle, Port Olona, Zoo des Sables d'Olonne |
| Cholet | A charming town known for its textile heritage and annual events, it offers visitors a glimpse of authentic French culture and is a perfect base for exploring the region. | Musee d'Art et d'Histoire, Parc de Moine, Château de Tiffauges, La Vallée de la Loire, Cholet Textile Museum |
| Clisson | A picturesque town that embodies the charm of the Loire Valley, known for its beautiful medieval architecture and vineyards nearby, attracting tourists interested in wine and history. | Château de Clisson, The Gallo-Roman ruins, Vineyards of the Muscadet region, Pont de la Vallée, Festival de Clisson |
| Sainte-Luce-sur-Loire | A peaceful area near Nantes that offers a nature escape with proximity to urban attractions, ideal for families and outdoor enthusiasts. | Parc de la Morinière, Château de la Morinière, Loire Valley biking paths, Lac de Grand-Lieu, Local markets |
Understanding Airbnb License Requirements & STR Laws in Angles (2025)
While Angles, Pays de la Loire, France currently shows low STR regulations, specific Airbnb license requirements might still exist or change. Always verify the latest short term rental regulations and Airbnb license requirements directly with local government authorities for Angles to ensure full compliance before hosting.
(Source: AirROI data, 2025, based on 9% licensed listings)
Top Performing Airbnb Properties in Angles (2025)
Benchmark your potential! Explore examples of top-performing Airbnb properties in Anglesbased on Trailing Twelve Month (TTM) revenue. Analyze their characteristics, revenue, occupancy rate, and ADR to understand what drives success in this market.

*Villa La Hulotte* 16 pers, 5 km from the beaches*
Entire Place • 4 bedrooms
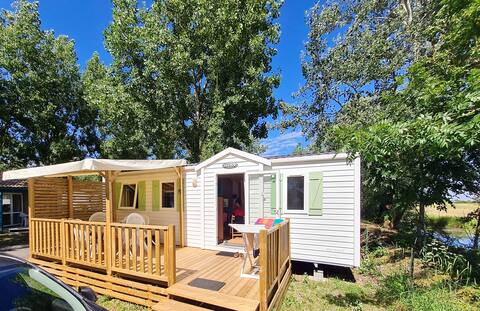
Bungalow 4 km away from the beach with shared pool
Entire Place • 3 bedrooms

Retrogaming, pool and spa
Entire Place • 3 bedrooms
House 10 minutes from the sea
Entire Place • 3 bedrooms
La Maison des Papillons
Entire Place • 3 bedrooms

Angles - heated pool -near La Tranche sur Mer
Entire Place • 2 bedrooms
Note: Performance varies based on location, size, amenities, seasonality, and management quality. Data reflects the past 12 months.
Top Performing Airbnb Hosts in Angles (2025)
Learn from the best! This table showcases top-performing Airbnb hosts in Angles based on the number of properties managed and estimated total revenue over the past year. Analyze their scale and performance metrics.
| Host Name | Properties | Grossing Revenue | Stay Reviews | Avg Rating |
|---|---|---|---|---|
| Antony | 1 | $129,311 | 58 | 4.91/5.0 |
| Host #432551754 | 1 | $37,145 | 2 | 0.00/5.0 |
| Guillaume | 1 | $34,911 | 334 | 4.87/5.0 |
| Typhaine | 1 | $29,998 | 26 | 4.81/5.0 |
| Franck | 1 | $29,573 | 13 | 5.00/5.0 |
| Frédéric | 1 | $28,611 | 7 | 4.86/5.0 |
| Host #449488095 | 1 | $23,903 | 0 | 0.00/5.0 |
| Camille | 1 | $22,863 | 10 | 4.80/5.0 |
| Chantal | 1 | $22,301 | 14 | 4.71/5.0 |
| Novasol | 1 | $21,928 | 3 | 3.33/5.0 |
Analyzing the strategies of top hosts, such as their property selection, pricing, and guest communication, can offer valuable lessons for optimizing your own Airbnb operations in Angles.
Dive Deeper: Advanced Angles STR Market Data (2025)
Ready to unlock more insights? AirROI provides access to advanced metrics and comprehensive Airbnb data for Angles. Explore detailed analytics beyond this report to refine your investment strategy, optimize pricing, and maximize your vacation rental profits.
Explore Advanced MetricsAngles Short-Term Rental Market Composition (2025): Property & Room Types
Room Type Distribution
Property Type Distribution
Market Composition Insights for Angles
- The Angles Airbnb market composition is heavily skewed towards Entire Home/Apt listings, which make up 96.3% of the 54 active rentals. This indicates strong guest preference for privacy and space.
- Looking at the property type distribution in Angles, House properties are the most common (85.2%), reflecting the local real estate landscape.
- Houses represent a significant 85.2% portion, catering likely to families or larger groups.
- The presence of 5.6% Hotel/Boutique listings indicates integration with traditional hospitality.
- Smaller segments like others (combined 3.7%) offer potential for unique stay experiences.
Angles Airbnb Room Capacity Analysis (2025): Bedroom Distribution
Distribution of Listings by Number of Bedrooms
Room Capacity Insights for Angles
- The dominant room capacity in Angles is 3 bedrooms listings, making up 48.1% of the market. This suggests a strong demand for properties suitable for families or small groups.
- Together, 3 bedrooms and 2 bedrooms properties represent 75.9% of the active Airbnb listings in Angles, indicating a high concentration in these sizes.
- A significant 57.4% of listings offer 3+ bedrooms, catering to larger groups and families seeking more space in Angles.
Angles Vacation Rental Guest Capacity Trends (2025)
Distribution of Listings by Guest Capacity
Guest Capacity Insights for Angles
- The most common guest capacity trend in Angles vacation rentals is listings accommodating 6 guests (51.9%). This suggests the primary traveler segment is likely larger groups.
- Properties designed for 6 guests and 8+ guests dominate the Angles STR market, accounting for 70.4% of listings.
- 70.4% of properties accommodate 6+ guests, serving the market segment for larger families or group travel in Angles.
- On average, properties in Angles are equipped to host 5.6 guests.
Angles Airbnb Booking Patterns (2025): Available vs. Booked Days
Available Days Distribution
Booked Days Distribution
Booking Pattern Insights for Angles
- The most common availability pattern in Angles falls within the 271-366 days range, representing 51.9% of listings. This suggests many properties have significant open periods on their calendars.
- Approximately 88.9% of listings show high availability (181+ days open annually), indicating potential for increased bookings or specific owner usage patterns.
- For booked days, the 91-180 days range is most frequent in Angles (38.9%), reflecting common guest stay durations or potential owner blocking patterns.
- A notable 11.1% of properties secure long booking periods (181+ days booked per year), highlighting successful long-term rental strategies or significant owner usage.
Angles Airbnb Minimum Stay Requirements Analysis
Distribution of Listings by Minimum Night Requirement
1 Night
6 listings
12% of total
2 Nights
18 listings
36% of total
3 Nights
5 listings
10% of total
4-6 Nights
9 listings
18% of total
7-29 Nights
8 listings
16% of total
30+ Nights
4 listings
8% of total
Key Insights
- The most prevalent minimum stay requirement in Angles is 2 Nights, adopted by 36% of listings. This highlights the market's preference for shorter, flexible bookings.
Recommendations
- Align with the market by considering a 2 Nights minimum stay, as 36% of Angles hosts use this setting.
- If feasible, allowing 1-night stays, especially midweek or during low season, could capture last-minute bookings, as only 12% currently do.
- A 2-night minimum appears standard (36%). Consider this for weekends or peak periods.
- Explore offering discounts for stays of 30+ nights to attract the 8% of the market seeking extended stays.
- Adjust minimum nights based on seasonality – potentially shorter during low season and longer during peak demand periods in Angles.
Angles Airbnb Cancellation Policy Trends Analysis (2025)
Super Strict 60 Days
1 listings
2.2% of total
Flexible
13 listings
28.9% of total
Moderate
13 listings
28.9% of total
Firm
13 listings
28.9% of total
Strict
5 listings
11.1% of total
Cancellation Policy Insights for Angles
- The prevailing Airbnb cancellation policy trend in Angles is Flexible, used by 28.9% of listings.
- There's a relatively balanced mix between guest-friendly (57.8%) and stricter (40.0%) policies, offering choices for different guest needs.
Recommendations for Hosts
- Consider adopting a Flexible policy to align with the 28.9% market standard in Angles.
- Using a Strict policy might deter some guests, as only 11.1% of listings use it. Evaluate if potential revenue protection outweighs possible lower booking rates.
- Regularly review your cancellation policy against competitors and market demand shifts in Angles.
Angles STR Booking Lead Time Analysis (2025)
Average Booking Lead Time by Month
Booking Lead Time Insights for Angles
- The overall average booking lead time for vacation rentals in Angles is 50 days.
- Guests book furthest in advance for stays during June (average 87 days), likely coinciding with peak travel demand or local events.
- The shortest booking windows occur for stays in February (average 22 days), indicating more last-minute travel plans during this time.
- Seasonally, Summer (73 days avg.) sees the longest lead times, while Winter (40 days avg.) has the shortest, reflecting typical travel planning cycles.
Recommendations for Hosts
- Use the overall average lead time (50 days) as a baseline for your pricing and availability strategy in Angles.
- For June stays, consider implementing length-of-stay discounts or slightly higher rates for bookings made less than 87 days out to capitalize on advance planning.
- Target marketing efforts for the Summer season well in advance (at least 73 days) to capture early planners.
- Monitor your own booking lead times against these Angles averages to identify opportunities for dynamic pricing adjustments.
Popular & Essential Airbnb Amenities in Angles (2025)
Amenity Prevalence
Amenity Insights for Angles
- Essential amenities in Angles that guests expect include: Heating, Kitchen, Free parking on premises. Lacking these (any) could significantly impact bookings.
- Popular amenities like Dishes and silverware, TV, Coffee maker are common but not universal. Offering these can provide a competitive edge.
Recommendations for Hosts
- Ensure your listing includes all essential amenities for Angles: Heating, Kitchen, Free parking on premises.
- Prioritize adding missing essentials: Heating, Kitchen, Free parking on premises.
- Consider adding popular differentiators like Dishes and silverware or TV to increase appeal.
- Highlight unique or less common amenities you offer (e.g., hot tub, dedicated workspace, EV charger) in your listing description and photos.
- Regularly check competitor amenities in Angles to stay competitive.
Angles Airbnb Guest Demographics & Profile Analysis (2025)
Guest Profile Summary for Angles
- The typical guest profile for Airbnb in Angles consists of primarily domestic travelers (93%), often arriving from nearby Nantes, typically belonging to the Post-2000s (Gen Z/Alpha) group (50%), primarily speaking French or English.
- Domestic travelers account for 92.6% of guests.
- Key international markets include France (92.6%) and United Kingdom (2.9%).
- Top languages spoken are French (50.3%) followed by English (32.2%).
- A significant demographic segment is the Post-2000s (Gen Z/Alpha) group, representing 50% of guests.
Recommendations for Hosts
- Target domestic marketing efforts towards travelers from Nantes and Paris.
- Tailor amenities and listing descriptions to appeal to the dominant Post-2000s (Gen Z/Alpha) demographic (e.g., highlight fast WiFi, smart home features, local guides).
- Highlight unique local experiences or amenities relevant to the primary guest profile.
- Consider seasonal promotions aligned with peak travel times for key origin markets.
Nearby Short-Term Rental Market Comparison
How does the Angles Airbnb market stack up against its neighbors? Compare key performance metrics like average monthly revenue, ADR, and occupancy rates in surrounding areas to understand the broader regional STR landscape.
| Market | Active Properties | Monthly Revenue | Daily Rate | Avg. Occupancy |
|---|---|---|---|---|
| Vallon-sur-Gée | 11 | $2,913 | $379.01 | 30% |
| Bourneau | 11 | $2,747 | $442.07 | 35% |
| Nuaillé-d'Aunis | 10 | $2,741 | $373.83 | 37% |
| Le Bois-Plage-en-Ré | 303 | $2,528 | $284.63 | 45% |
| Chambellay | 11 | $2,525 | $255.24 | 34% |
| Sainte-Florence | 10 | $2,445 | $233.78 | 46% |
| Saint-Hippolyte | 10 | $2,443 | $204.98 | 44% |
| Abzac | 12 | $2,415 | $349.03 | 36% |
| La Flotte | 396 | $2,382 | $236.53 | 46% |
| Saint-Georges-des-Coteaux | 12 | $2,335 | $187.61 | 43% |