Vinassan Airbnb Market Analysis 2025: Short Term Rental Data & Vacation Rental Statistics in Occitania, France
Is Airbnb profitable in Vinassan in 2025? Explore comprehensive Airbnb analytics for Vinassan, Occitania, France to uncover income potential. This 2025 STR market report for Vinassan, based on AirROI data from April 2024 to March 2025, reveals key trends in the niche market of 22 active listings.
Whether you're considering an Airbnb investment in Vinassan, optimizing your existing vacation rental, or exploring rental arbitrage opportunities, understanding the Vinassan Airbnb data is crucial. Leveraging the low regulation environment is key to maximizing your short term rental income potential. Let's dive into the specifics.
Key Vinassan Airbnb Performance Metrics Overview
Monthly Airbnb Revenue Variations & Income Potential in Vinassan (2025)
Understanding the monthly revenue variations for Airbnb listings in Vinassan is key to maximizing your short term rental income potential. Seasonality significantly impacts earnings. Our analysis, based on data from the past 12 months, shows that the peak revenue month for STRs in Vinassan is typically August, while November often presents the lowest earnings, highlighting opportunities for strategic pricing adjustments during shoulder and low seasons. Explore the typical Airbnb income in Vinassan across different performance tiers:
- Best-in-class properties (Top 10%) achieve $4,083+ monthly, often utilizing dynamic pricing and superior guest experiences.
- Strong performing properties (Top 25%) earn $2,267 or more, indicating effective management and desirable locations/amenities.
- Typical properties (Median) generate around $965 per month, representing the average market performance.
- Entry-level properties (Bottom 25%) see earnings around $500, often with potential for optimization.
Average Monthly Airbnb Earnings Trend in Vinassan
Vinassan Airbnb Occupancy Rate Trends (2025)
Maximize your bookings by understanding the Vinassan STR occupancy trends. Seasonal demand shifts significantly influence how often properties are booked. Typically, Augustsees the highest demand (peak season occupancy), while November experiences the lowest (low season). Effective strategies, like adjusting minimum stays or offering promotions, can boost occupancy during slower periods. Here's how different property tiers perform in Vinassan:
- Best-in-class properties (Top 10%) achieve 64%+ occupancy, indicating high desirability and potentially optimized availability.
- Strong performing properties (Top 25%) maintain 43% or higher occupancy, suggesting good market fit and guest satisfaction.
- Typical properties (Median) have an occupancy rate around 29%.
- Entry-level properties (Bottom 25%) average 15% occupancy, potentially facing higher vacancy.
Average Monthly Occupancy Rate Trend in Vinassan
Average Daily Rate (ADR) Airbnb Trends in Vinassan (2025)
Effective short term rental pricing strategy in Vinassan involves understanding monthly ADR fluctuations. The Average Daily Rate (ADR) for Airbnb in Vinassan typically peaks in July and dips lowest during March. Leveraging Airbnb dynamic pricing tools or strategies based on this seasonality can significantly boost revenue. Here's a look at the typical nightly rates achieved:
- Best-in-class properties (Top 10%) command rates of $293+ per night, often due to premium features or locations.
- Strong performing properties (Top 25%) achieve nightly rates of $219 or more.
- Typical properties (Median) charge around $110 per night.
- Entry-level properties (Bottom 25%) earn around $71 per night.
Average Daily Rate (ADR) Trend by Month in Vinassan
Get Live Vinassan Market Intelligence 👇

Explore Real-time Analytics
Airbnb Seasonality Analysis & Trends in Vinassan (2025)
Peak Season (August, July, June)
- Revenue averages $3,012 per month
- Occupancy rates average 51.3%
- Daily rates average $160
Shoulder Season
- Revenue averages $1,419 per month
- Occupancy maintains around 29.5%
- Daily rates hold near $148
Low Season (January, February, November)
- Revenue drops to average $703 per month
- Occupancy decreases to average 19.4%
- Daily rates adjust to average $149
Seasonality Insights for Vinassan
- The Airbnb seasonality in Vinassan shows highly seasonal trends requiring careful strategy. While the sections above show seasonal averages, it's also insightful to look at the extremes:
- During the high season, the absolute peak month showcases Vinassan's highest earning potential, with monthly revenues capable of climbing to $4,111, occupancy reaching a high of 72.7%, and ADRs peaking at $164.
- Conversely, the slowest single month of the year, typically falling within the low season, marks the market's lowest point. In this month, revenue might dip to $665, occupancy could drop to 16.4%, and ADRs may adjust down to $145.
- Understanding both the seasonal averages and these monthly peaks and troughs in revenue, occupancy, and ADR is crucial for maximizing your Airbnb profit potential in Vinassan.
Seasonal Strategies for Maximizing Profit
- Peak Season: Maximize revenue through premium pricing and potentially longer minimum stays. Ensure high availability.
- Low Season: Offer competitive pricing, special promotions (e.g., extended stay discounts), and flexible cancellation policies. Target off-season travelers like remote workers or budget-conscious guests.
- Shoulder Seasons: Implement dynamic pricing that balances peak and low rates. Target weekend travelers or specific events. Offer slightly more flexible terms than peak season.
- Regularly analyze your own performance against these Vinassan seasonality benchmarks and adjust your pricing and availability strategy accordingly.
Best Areas for Airbnb Investment in Vinassan (2025)
Exploring the top neighborhoods for short-term rentals in Vinassan? This section highlights key areas, outlining why they are attractive for hosts and guests, along with notable local attractions. Consider these locations based on your target guest profile and investment strategy.
| Neighborhood / Area | Why Host Here? (Target Guests & Appeal) | Key Attractions & Landmarks |
|---|---|---|
| Vinassan Village | Charming French village close to the coast, offering a peaceful atmosphere with access to local markets and cultural experiences. Perfect for guests seeking an authentic French experience away from busy tourist hubs. | Local Markets, Café de la Place, Nearby vineyards, Historical sites, Walking trails |
| Narbonne | Historic town with Roman ruins and vibrant markets. Ideal for travelers interested in history and culture, providing a blend of urban amenities and historical sights. | Narbonne Cathedral, Via Domitia, Les Halles de Narbonne, Palais des Archevêques, Canal de la Robine |
| Leucate | Scenic coastal town known for its beaches and sailing activities. Attracts beachgoers and water sports enthusiasts, making it a great spot for vacation rentals. | Leucate Plage, Windsurfing and kite surfing spots, Port Leucate, Local seafood restaurants, Natural reserves |
| Béziers | Vibrant town famous for its festivals and Mediterranean culture. A fantastic location for Airbnb owing to its events, cultural heritage, and wine tours. | St. Nazaire Cathedral, The Canal du Midi, Les Allées Paul Riquet, Béziers Feria, Wine tasting tours |
| Sigean | A small town known for its wildlife park, making it a great destination for families and nature lovers seeking unique experiences. | Sigean African Reserve, Plage de la Franqui, Cultural heritage sites, Local wine tours, Nearby hiking trails |
| Cap d'Agde | Famous seaside resort known for its nudist beach and vibrant nightlife. Suitable for tourists looking for lively beach experiences and summer entertainment. | Cap d'Agde nudist beach, Aqualand, Local bars and clubs, Marina, Boat tours |
| Cuxac-d'Aude | Quiet rural location with beautiful landscapes and agricultural heritage. Attractive for tourists looking for tranquility and nature. | Local farms, Historical church, Cycling routes, Scenic countryside, Wine tasting experiences |
| Port-la-Nouvelle | A seaside town featuring beautiful beaches and rich history. Great for guests looking to enjoy seaside activities and regional cuisine. | Port-la-Nouvelle beach, Historical port, Fresh seafood markets, Maritime museum, Fishing tours |
Understanding Airbnb License Requirements & STR Laws in Vinassan (2025)
While Vinassan, Occitania, France currently shows low STR regulations, specific Airbnb license requirements might still exist or change. Always verify the latest short term rental regulations and Airbnb license requirements directly with local government authorities for Vinassan to ensure full compliance before hosting.
(Source: AirROI data, 2025, based on 9% licensed listings)
Top Performing Airbnb Properties in Vinassan (2025)
Benchmark your potential! Explore examples of top-performing Airbnb properties in Vinassanbased on Trailing Twelve Month (TTM) revenue. Analyze their characteristics, revenue, occupancy rate, and ADR to understand what drives success in this market.

Les Portes de la Mer
Entire Place • 5 bedrooms

Contemporary Villa T5 Piscine - Grands Buffets
Entire Place • 4 bedrooms
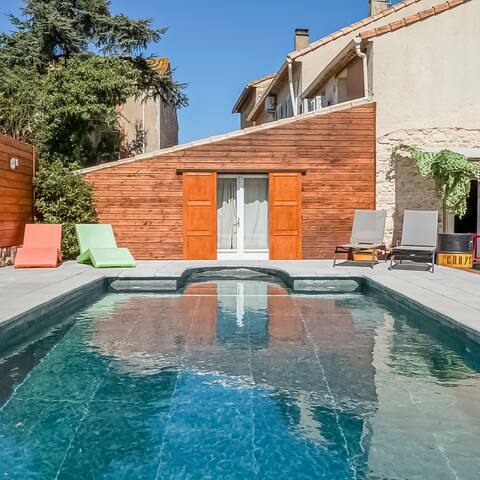
Villa in Clape Clim/Private Pool
Entire Place • 3 bedrooms
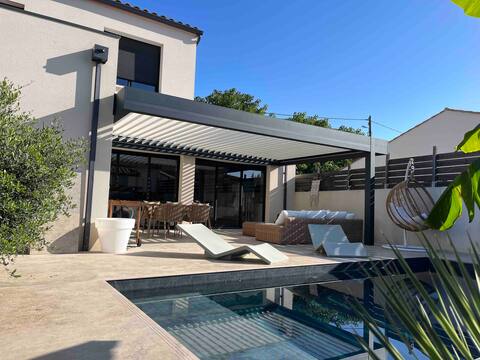
Modern Villa with Pool in Vinassan
Entire Place • 4 bedrooms
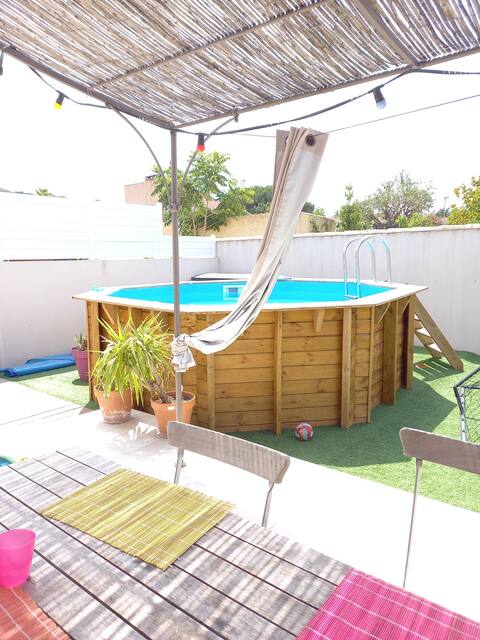
Villa in quiet village and close to the sea
Entire Place • 3 bedrooms
New villa near beach and 5 min to Narbonne
Entire Place • 3 bedrooms
Note: Performance varies based on location, size, amenities, seasonality, and management quality. Data reflects the past 12 months.
Top Performing Airbnb Hosts in Vinassan (2025)
Learn from the best! This table showcases top-performing Airbnb hosts in Vinassan based on the number of properties managed and estimated total revenue over the past year. Analyze their scale and performance metrics.
| Host Name | Properties | Grossing Revenue | Stay Reviews | Avg Rating |
|---|---|---|---|---|
| Gilles | 1 | $43,657 | 175 | 4.92/5.0 |
| Frank | 1 | $38,929 | 164 | 4.82/5.0 |
| Eric | 2 | $34,116 | 7 | 2.50/5.0 |
| Corinne | 1 | $30,049 | 9 | 5.00/5.0 |
| Mathieu | 1 | $22,347 | 10 | 4.70/5.0 |
| Pauline | 1 | $20,757 | 9 | 4.89/5.0 |
| Jacqueline | 1 | $20,662 | 22 | 4.77/5.0 |
| Cyril | 1 | $14,147 | 8 | 4.75/5.0 |
| Nadine | 1 | $13,518 | 14 | 5.00/5.0 |
| Jeff Et Pricilla | 1 | $9,635 | 17 | 4.88/5.0 |
Analyzing the strategies of top hosts, such as their property selection, pricing, and guest communication, can offer valuable lessons for optimizing your own Airbnb operations in Vinassan.
Dive Deeper: Advanced Vinassan STR Market Data (2025)
Ready to unlock more insights? AirROI provides access to advanced metrics and comprehensive Airbnb data for Vinassan. Explore detailed analytics beyond this report to refine your investment strategy, optimize pricing, and maximize your vacation rental profits.
Explore Advanced MetricsVinassan Short-Term Rental Market Composition (2025): Property & Room Types
Room Type Distribution
Property Type Distribution
Market Composition Insights for Vinassan
- The Vinassan Airbnb market composition is heavily skewed towards Entire Home/Apt listings, which make up 100% of the 22 active rentals. This indicates strong guest preference for privacy and space.
- Looking at the property type distribution in Vinassan, House properties are the most common (68.2%), reflecting the local real estate landscape.
- Houses represent a significant 68.2% portion, catering likely to families or larger groups.
- Smaller segments like others (combined 4.5%) offer potential for unique stay experiences.
Vinassan Airbnb Room Capacity Analysis (2025): Bedroom Distribution
Distribution of Listings by Number of Bedrooms
Room Capacity Insights for Vinassan
- The dominant room capacity in Vinassan is 4 bedrooms listings, making up 31.8% of the market. This suggests a strong demand for properties suitable for families or small groups.
- Together, 4 bedrooms and 1 bedroom properties represent 54.5% of the active Airbnb listings in Vinassan, indicating a high concentration in these sizes.
- A significant 54.5% of listings offer 3+ bedrooms, catering to larger groups and families seeking more space in Vinassan.
Vinassan Vacation Rental Guest Capacity Trends (2025)
Distribution of Listings by Guest Capacity
Guest Capacity Insights for Vinassan
- The most common guest capacity trend in Vinassan vacation rentals is listings accommodating 8+ guests (36.4%). This suggests the primary traveler segment is likely larger groups.
- Properties designed for 8+ guests and 4 guests dominate the Vinassan STR market, accounting for 63.7% of listings.
- 54.5% of properties accommodate 6+ guests, serving the market segment for larger families or group travel in Vinassan.
- On average, properties in Vinassan are equipped to host 5.7 guests.
Vinassan Airbnb Booking Patterns (2025): Available vs. Booked Days
Available Days Distribution
Booked Days Distribution
Booking Pattern Insights for Vinassan
- The most common availability pattern in Vinassan falls within the 271-366 days range, representing 50% of listings. This suggests many properties have significant open periods on their calendars.
- Approximately 100.0% of listings show high availability (181+ days open annually), indicating potential for increased bookings or specific owner usage patterns.
- For booked days, the 91-180 days range is most frequent in Vinassan (50%), reflecting common guest stay durations or potential owner blocking patterns.
Vinassan Airbnb Minimum Stay Requirements Analysis
Distribution of Listings by Minimum Night Requirement
1 Night
5 listings
22.7% of total
2 Nights
10 listings
45.5% of total
3 Nights
4 listings
18.2% of total
4-6 Nights
2 listings
9.1% of total
7-29 Nights
1 listings
4.5% of total
Key Insights
- The most prevalent minimum stay requirement in Vinassan is 2 Nights, adopted by 45.5% of listings. This highlights the market's preference for shorter, flexible bookings.
- A strong majority (68.2%) of the Vinassan Airbnb data shows acceptance of very short stays (1-2 nights), indicating a dynamic, high-turnover market.
Recommendations
- Align with the market by considering a 2 Nights minimum stay, as 45.5% of Vinassan hosts use this setting.
- If feasible, allowing 1-night stays, especially midweek or during low season, could capture last-minute bookings, as only 22.7% currently do.
- Adjust minimum nights based on seasonality – potentially shorter during low season and longer during peak demand periods in Vinassan.
Vinassan Airbnb Cancellation Policy Trends Analysis (2025)
Super Strict 60 Days
1 listings
5.3% of total
Flexible
1 listings
5.3% of total
Moderate
5 listings
26.3% of total
Firm
2 listings
10.5% of total
Strict
10 listings
52.6% of total
Cancellation Policy Insights for Vinassan
- The prevailing Airbnb cancellation policy trend in Vinassan is Strict, used by 52.6% of listings.
- A majority (63.1%) of hosts in Vinassan utilize Firm or Strict policies, indicating a market where hosts prioritize booking security.
Recommendations for Hosts
- Consider adopting a Strict policy to align with the 52.6% market standard in Vinassan.
- With 52.6% using Strict terms, this is a viable option in Vinassan, particularly for high-value properties or during peak demand periods.
- Regularly review your cancellation policy against competitors and market demand shifts in Vinassan.
Vinassan STR Booking Lead Time Analysis (2025)
Average Booking Lead Time by Month
Booking Lead Time Insights for Vinassan
- The overall average booking lead time for vacation rentals in Vinassan is 64 days.
- Guests book furthest in advance for stays during July (average 98 days), likely coinciding with peak travel demand or local events.
- The shortest booking windows occur for stays in March (average 43 days), indicating more last-minute travel plans during this time.
- Seasonally, Summer (84 days avg.) sees the longest lead times, while Fall (66 days avg.) has the shortest, reflecting typical travel planning cycles.
Recommendations for Hosts
- Use the overall average lead time (64 days) as a baseline for your pricing and availability strategy in Vinassan.
- For July stays, consider implementing length-of-stay discounts or slightly higher rates for bookings made less than 98 days out to capitalize on advance planning.
- Target marketing efforts for the Summer season well in advance (at least 84 days) to capture early planners.
- Monitor your own booking lead times against these Vinassan averages to identify opportunities for dynamic pricing adjustments.
Popular & Essential Airbnb Amenities in Vinassan (2025)
Amenity Prevalence
Amenity Insights for Vinassan
- Essential amenities in Vinassan that guests expect include: Kitchen, Washer, Refrigerator, Microwave, Free parking on premises, TV, Heating. Lacking these (any) could significantly impact bookings.
- Popular amenities like Dishes and silverware, Coffee maker, Hangers are common but not universal. Offering these can provide a competitive edge.
Recommendations for Hosts
- Ensure your listing includes all essential amenities for Vinassan: Kitchen, Washer, Refrigerator, Microwave, Free parking on premises, TV, Heating.
- Prioritize adding missing essentials: Washer, Refrigerator, Microwave, Free parking on premises, TV, Heating.
- Consider adding popular differentiators like Dishes and silverware or Coffee maker to increase appeal.
- Highlight unique or less common amenities you offer (e.g., hot tub, dedicated workspace, EV charger) in your listing description and photos.
- Regularly check competitor amenities in Vinassan to stay competitive.
Vinassan Airbnb Guest Demographics & Profile Analysis (2025)
Guest Profile Summary for Vinassan
- The typical guest profile for Airbnb in Vinassan consists of primarily domestic travelers (86%), often arriving from nearby Toulouse, typically belonging to the Post-2000s (Gen Z/Alpha) group (50%), primarily speaking French or English.
- Domestic travelers account for 86.4% of guests.
- Key international markets include France (86.4%) and Spain (3.6%).
- Top languages spoken are French (47.3%) followed by English (27.3%).
- A significant demographic segment is the Post-2000s (Gen Z/Alpha) group, representing 50% of guests.
Recommendations for Hosts
- Target domestic marketing efforts towards travelers from Toulouse and Marseille.
- Tailor amenities and listing descriptions to appeal to the dominant Post-2000s (Gen Z/Alpha) demographic (e.g., highlight fast WiFi, smart home features, local guides).
- Highlight unique local experiences or amenities relevant to the primary guest profile.
- Consider seasonal promotions aligned with peak travel times for key origin markets.
Nearby Short-Term Rental Market Comparison
How does the Vinassan Airbnb market stack up against its neighbors? Compare key performance metrics like average monthly revenue, ADR, and occupancy rates in surrounding areas to understand the broader regional STR landscape.
| Market | Active Properties | Monthly Revenue | Daily Rate | Avg. Occupancy |
|---|---|---|---|---|
| Cornellà del Terri | 17 | $4,960 | $460.96 | 41% |
| Amer | 10 | $4,848 | $397.58 | 40% |
| Porqueres | 12 | $4,714 | $469.05 | 36% |
| Villeneuvette | 13 | $4,150 | $337.56 | 44% |
| Divajeu | 19 | $3,941 | $410.65 | 42% |
| Bordils | 11 | $3,557 | $525.15 | 36% |
| Vilademuls | 20 | $3,489 | $328.54 | 36% |
| Vilanant | 10 | $3,424 | $343.93 | 34% |
| Bàscara | 13 | $3,317 | $437.52 | 39% |
| Castelnou | 12 | $3,274 | $302.12 | 31% |