Vignec Airbnb Market Analysis 2025: Short Term Rental Data & Vacation Rental Statistics in Occitania, France
Is Airbnb profitable in Vignec in 2025? Explore comprehensive Airbnb analytics for Vignec, Occitania, France to uncover income potential. This 2025 STR market report for Vignec, based on AirROI data from April 2024 to March 2025, reveals key trends in the niche market of 69 active listings.
Whether you're considering an Airbnb investment in Vignec, optimizing your existing vacation rental, or exploring rental arbitrage opportunities, understanding the Vignec Airbnb data is crucial. Understanding the local regulations is key to maximizing your short term rental income potential. Let's dive into the specifics.
Key Vignec Airbnb Performance Metrics Overview
Monthly Airbnb Revenue Variations & Income Potential in Vignec (2025)
Understanding the monthly revenue variations for Airbnb listings in Vignec is key to maximizing your short term rental income potential. Seasonality significantly impacts earnings. Our analysis, based on data from the past 12 months, shows that the peak revenue month for STRs in Vignec is typically February, while November often presents the lowest earnings, highlighting opportunities for strategic pricing adjustments during shoulder and low seasons. Explore the typical Airbnb income in Vignec across different performance tiers:
- Best-in-class properties (Top 10%) achieve $2,906+ monthly, often utilizing dynamic pricing and superior guest experiences.
- Strong performing properties (Top 25%) earn $1,995 or more, indicating effective management and desirable locations/amenities.
- Typical properties (Median) generate around $1,128 per month, representing the average market performance.
- Entry-level properties (Bottom 25%) see earnings around $650, often with potential for optimization.
Average Monthly Airbnb Earnings Trend in Vignec
Vignec Airbnb Occupancy Rate Trends (2025)
Maximize your bookings by understanding the Vignec STR occupancy trends. Seasonal demand shifts significantly influence how often properties are booked. Typically, Februarysees the highest demand (peak season occupancy), while May experiences the lowest (low season). Effective strategies, like adjusting minimum stays or offering promotions, can boost occupancy during slower periods. Here's how different property tiers perform in Vignec:
- Best-in-class properties (Top 10%) achieve 70%+ occupancy, indicating high desirability and potentially optimized availability.
- Strong performing properties (Top 25%) maintain 49% or higher occupancy, suggesting good market fit and guest satisfaction.
- Typical properties (Median) have an occupancy rate around 33%.
- Entry-level properties (Bottom 25%) average 20% occupancy, potentially facing higher vacancy.
Average Monthly Occupancy Rate Trend in Vignec
Average Daily Rate (ADR) Airbnb Trends in Vignec (2025)
Effective short term rental pricing strategy in Vignec involves understanding monthly ADR fluctuations. The Average Daily Rate (ADR) for Airbnb in Vignec typically peaks in February and dips lowest during November. Leveraging Airbnb dynamic pricing tools or strategies based on this seasonality can significantly boost revenue. Here's a look at the typical nightly rates achieved:
- Best-in-class properties (Top 10%) command rates of $201+ per night, often due to premium features or locations.
- Strong performing properties (Top 25%) achieve nightly rates of $154 or more.
- Typical properties (Median) charge around $109 per night.
- Entry-level properties (Bottom 25%) earn around $80 per night.
Average Daily Rate (ADR) Trend by Month in Vignec
Get Live Vignec Market Intelligence 👇

Explore Real-time Analytics
Airbnb Seasonality Analysis & Trends in Vignec (2025)
Peak Season (February, August, July)
- Revenue averages $2,424 per month
- Occupancy rates average 59.5%
- Daily rates average $152
Shoulder Season
- Revenue averages $1,382 per month
- Occupancy maintains around 31.4%
- Daily rates hold near $145
Low Season (September, October, November)
- Revenue drops to average $804 per month
- Occupancy decreases to average 25.9%
- Daily rates adjust to average $130
Seasonality Insights for Vignec
- The Airbnb seasonality in Vignec shows highly seasonal trends requiring careful strategy. While the sections above show seasonal averages, it's also insightful to look at the extremes:
- During the high season, the absolute peak month showcases Vignec's highest earning potential, with monthly revenues capable of climbing to $2,969, occupancy reaching a high of 66.2%, and ADRs peaking at $172.
- Conversely, the slowest single month of the year, typically falling within the low season, marks the market's lowest point. In this month, revenue might dip to $677, occupancy could drop to 21.2%, and ADRs may adjust down to $127.
- Understanding both the seasonal averages and these monthly peaks and troughs in revenue, occupancy, and ADR is crucial for maximizing your Airbnb profit potential in Vignec.
Seasonal Strategies for Maximizing Profit
- Peak Season: Maximize revenue through premium pricing and potentially longer minimum stays. Ensure high availability.
- Low Season: Offer competitive pricing, special promotions (e.g., extended stay discounts), and flexible cancellation policies. Target off-season travelers like remote workers or budget-conscious guests.
- Shoulder Seasons: Implement dynamic pricing that balances peak and low rates. Target weekend travelers or specific events. Offer slightly more flexible terms than peak season.
- Regularly analyze your own performance against these Vignec seasonality benchmarks and adjust your pricing and availability strategy accordingly.
Best Areas for Airbnb Investment in Vignec (2025)
Exploring the top neighborhoods for short-term rentals in Vignec? This section highlights key areas, outlining why they are attractive for hosts and guests, along with notable local attractions. Consider these locations based on your target guest profile and investment strategy.
| Neighborhood / Area | Why Host Here? (Target Guests & Appeal) | Key Attractions & Landmarks |
|---|---|---|
| Vignec Village | A charming village with traditional architecture and a cozy atmosphere. Ideal for tourists looking for a peaceful retreat with easy access to ski facilities and local amenities. | Ski resorts of Saint-Lary-Soulan, Local markets, Hiking trails, Scenic views of the Pyrenees, Église de Vignec |
| Saint-Lary-Soulan | A popular ski resort town nearby, attracting winter sports enthusiasts and summer tourists. Great for year-round rental opportunities due to the outdoor activities available. | Saint-Lary-Soulan ski resort, Thermal spa, Pic du Midi, Local shops and restaurants, Cable car rides |
| Piau Engaly | One of the highest ski resorts in the Pyrenees, it's a hotspot for skiing and snowboarding. Attracts adventurous tourists looking for snow activities. | Piau Engaly ski area, Winter sports activities, Snow parks, Beautiful alpine scenery, Mountain hiking trails |
| Arreau | A picturesque town just a short drive from Vignec, known for its historical sites and nature trails. A great location for those seeking a more local experience. | Church of Saint-Jean-Baptiste, Les Granges de la Vallée d'Aure, Walking and cycling routes, Local cafes, Arts and crafts shops |
| Luz-Saint-Sauveur | A quaint town that serves as a gateway to the nearby ski resorts and offers a range of outdoor activities. Popular in both winter and summer. | Luz Ardiden ski resort, Terraces overlooking the river, Thermal baths, Hiking routes to the Cirque de Gavarnie, Charming boutiques |
| Bagnères-de-Luchon | Famous for its thermal spas and beautiful mountain scenery, it attracts visitors year-round for wellness retreats and outdoor experiences. | Luchon thermal baths, Cable car to Superbagnères, Hiking and biking trails, Charming mountain architecture, Local gastronomy |
| Cauterets | Another popular ski resort with access to both winter sports and summer hiking. Known for its beautiful natural surroundings and thermal springs. | Cauterets ski area, Laune Forest, Pont d'Espagne, Thermal spas, Natural waterfalls |
| Gourdan-Polignan | A small town with historical significance, offering a quieter alternative to busier tourist spots while still being close to outdoor activities and attractions. | Historical buildings, Nature trails, Local artisan shops, Peaceful parks, Cultural heritage sites |
Understanding Airbnb License Requirements & STR Laws in Vignec (2025)
With 19% of listings showing registration in 2025, understanding potential Airbnb license requirements is crucial in Vignec. Always verify the latest short term rental regulations and Airbnb license requirements directly with local government authorities for Vignec to ensure full compliance before hosting.
(Source: AirROI data, 2025, based on 19% licensed listings)
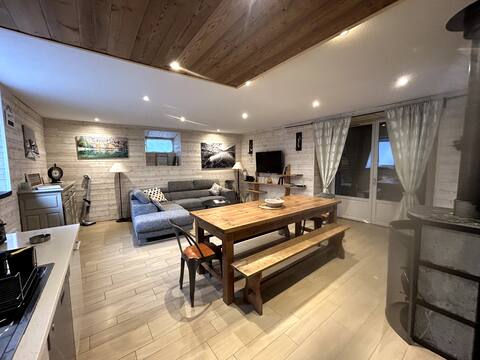
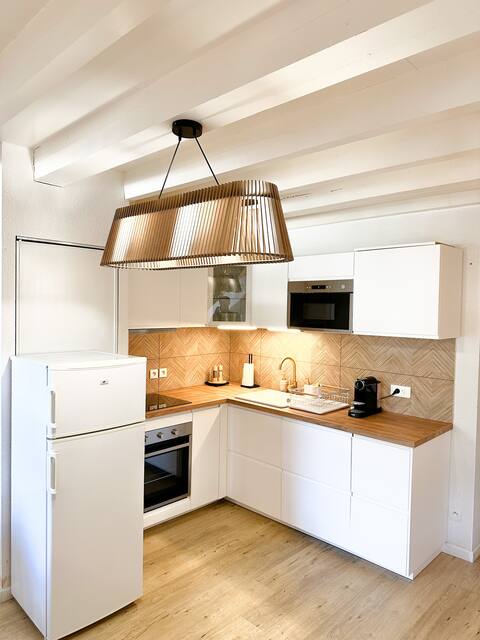
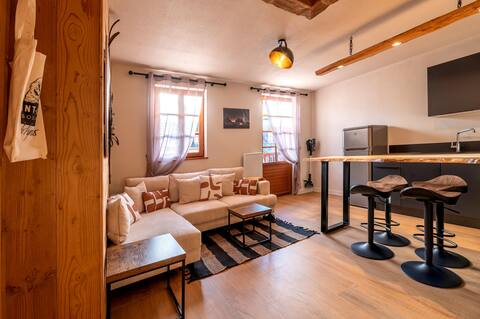
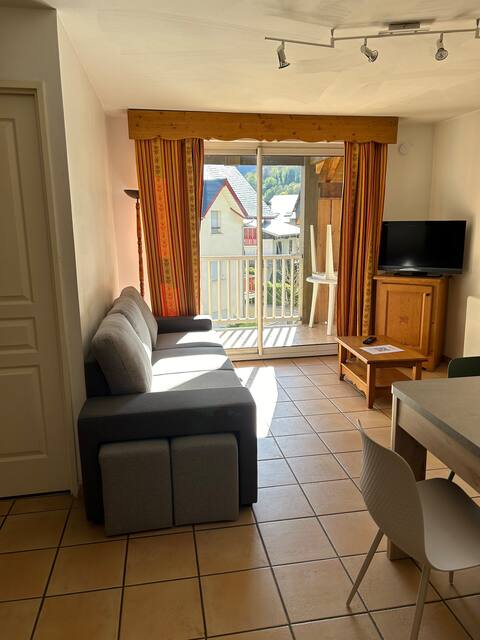
Top Performing Airbnb Properties in Vignec (2025)
Benchmark your potential! Explore examples of top-performing Airbnb properties in Vignecbased on Trailing Twelve Month (TTM) revenue. Analyze their characteristics, revenue, occupancy rate, and ADR to understand what drives success in this market.
⭐️KasaLodge, Pyrenean Village, Hiking, Sauna
Entire Place • 4 bedrooms

♥️KasaLilou, Grand Gîte de prestige St Lary
Entire Place • 8 bedrooms
La Suite d 'Aure
Entire Place • 3 bedrooms
L 'igloo, Deco Modern, Spacious and Luxurious Chalet
Entire Place • 1 bedroom
Apartment for 8/10 people, near St Lary Soulan
Entire Place • 4 bedrooms
LA COLONELLE
Entire Place • 5 bedrooms
Note: Performance varies based on location, size, amenities, seasonality, and management quality. Data reflects the past 12 months.
Top Performing Airbnb Hosts in Vignec (2025)
Learn from the best! This table showcases top-performing Airbnb hosts in Vignec based on the number of properties managed and estimated total revenue over the past year. Analyze their scale and performance metrics.
| Host Name | Properties | Grossing Revenue | Stay Reviews | Avg Rating |
|---|---|---|---|---|
| Carole | 2 | $113,179 | 62 | 4.97/5.0 |
| Jean Marie | 2 | $45,737 | 132 | 4.98/5.0 |
| Patrick | 2 | $39,344 | 13 | 2.38/5.0 |
| Marion | 1 | $36,680 | 22 | 4.95/5.0 |
| Lionel | 2 | $32,719 | 35 | 4.35/5.0 |
| Carole | 1 | $26,928 | 97 | 4.96/5.0 |
| Cyril | 1 | $26,757 | 44 | 4.82/5.0 |
| Maxime | 1 | $25,631 | 14 | 4.86/5.0 |
| Aimie | 1 | $24,800 | 16 | 4.94/5.0 |
| Marie | 1 | $23,334 | 179 | 4.79/5.0 |
Analyzing the strategies of top hosts, such as their property selection, pricing, and guest communication, can offer valuable lessons for optimizing your own Airbnb operations in Vignec.
Dive Deeper: Advanced Vignec STR Market Data (2025)
Ready to unlock more insights? AirROI provides access to advanced metrics and comprehensive Airbnb data for Vignec. Explore detailed analytics beyond this report to refine your investment strategy, optimize pricing, and maximize your vacation rental profits.
Explore Advanced MetricsVignec Short-Term Rental Market Composition (2025): Property & Room Types
Room Type Distribution
Property Type Distribution
Market Composition Insights for Vignec
- The Vignec Airbnb market composition is heavily skewed towards Entire Home/Apt listings, which make up 98.6% of the 69 active rentals. This indicates strong guest preference for privacy and space.
- Looking at the property type distribution in Vignec, Apartment/Condo properties are the most common (73.9%), reflecting the local real estate landscape.
- Houses represent a significant 26.1% portion, catering likely to families or larger groups.
Vignec Airbnb Room Capacity Analysis (2025): Bedroom Distribution
Distribution of Listings by Number of Bedrooms
Room Capacity Insights for Vignec
- The dominant room capacity in Vignec is 2 bedrooms listings, making up 33.3% of the market. This suggests a strong demand for properties suitable for couples or solo travelers.
- Together, 2 bedrooms and 3 bedrooms properties represent 59.4% of the active Airbnb listings in Vignec, indicating a high concentration in these sizes.
- A significant 37.7% of listings offer 3+ bedrooms, catering to larger groups and families seeking more space in Vignec.
Vignec Vacation Rental Guest Capacity Trends (2025)
Distribution of Listings by Guest Capacity
Guest Capacity Insights for Vignec
- The most common guest capacity trend in Vignec vacation rentals is listings accommodating 4 guests (31.9%). This suggests the primary traveler segment is likely small families or groups.
- Properties designed for 4 guests and 8+ guests dominate the Vignec STR market, accounting for 59.4% of listings.
- 53.6% of properties accommodate 6+ guests, serving the market segment for larger families or group travel in Vignec.
- On average, properties in Vignec are equipped to host 5.5 guests.
Vignec Airbnb Booking Patterns (2025): Available vs. Booked Days
Available Days Distribution
Booked Days Distribution
Booking Pattern Insights for Vignec
- The most common availability pattern in Vignec falls within the 181-270 days range, representing 47.8% of listings. This suggests many properties have significant open periods on their calendars.
- Approximately 85.5% of listings show high availability (181+ days open annually), indicating potential for increased bookings or specific owner usage patterns.
- For booked days, the 91-180 days range is most frequent in Vignec (52.2%), reflecting common guest stay durations or potential owner blocking patterns.
- A notable 14.4% of properties secure long booking periods (181+ days booked per year), highlighting successful long-term rental strategies or significant owner usage.
Vignec Airbnb Minimum Stay Requirements Analysis
Distribution of Listings by Minimum Night Requirement
1 Night
5 listings
7.5% of total
2 Nights
8 listings
11.9% of total
3 Nights
4 listings
6% of total
4-6 Nights
21 listings
31.3% of total
7-29 Nights
11 listings
16.4% of total
30+ Nights
18 listings
26.9% of total
Key Insights
- The most prevalent minimum stay requirement in Vignec is 4-6 Nights, adopted by 31.3% of listings. This highlights the market's preference for longer commitments.
- Very short stays (1-2 nights) are less common (19.4%), suggesting hosts prefer slightly longer bookings to optimize turnover.
- A significant segment (26.9%) caters to monthly stays (30+ nights) in Vignec, pointing to opportunities in the extended-stay market.
Recommendations
- Align with the market by considering a 4-6 Nights minimum stay, as 31.3% of Vignec hosts use this setting.
- If feasible, allowing 1-night stays, especially midweek or during low season, could capture last-minute bookings, as only 7.5% currently do.
- Explore offering discounts for stays of 30+ nights to attract the 26.9% of the market seeking extended stays.
- Adjust minimum nights based on seasonality – potentially shorter during low season and longer during peak demand periods in Vignec.
Vignec Airbnb Cancellation Policy Trends Analysis (2025)
Super Strict 60 Days
1 listings
1.5% of total
Flexible
12 listings
18.5% of total
Moderate
19 listings
29.2% of total
Firm
15 listings
23.1% of total
Strict
18 listings
27.7% of total
Cancellation Policy Insights for Vignec
- The prevailing Airbnb cancellation policy trend in Vignec is Moderate, used by 29.2% of listings.
- A majority (50.8%) of hosts in Vignec utilize Firm or Strict policies, indicating a market where hosts prioritize booking security.
Recommendations for Hosts
- Consider adopting a Moderate policy to align with the 29.2% market standard in Vignec.
- Regularly review your cancellation policy against competitors and market demand shifts in Vignec.
Vignec STR Booking Lead Time Analysis (2025)
Average Booking Lead Time by Month
Booking Lead Time Insights for Vignec
- The overall average booking lead time for vacation rentals in Vignec is 67 days.
- Guests book furthest in advance for stays during August (average 100 days), likely coinciding with peak travel demand or local events.
- The shortest booking windows occur for stays in April (average 45 days), indicating more last-minute travel plans during this time.
- Seasonally, Summer (94 days avg.) sees the longest lead times, while Spring (54 days avg.) has the shortest, reflecting typical travel planning cycles.
Recommendations for Hosts
- Use the overall average lead time (67 days) as a baseline for your pricing and availability strategy in Vignec.
- For August stays, consider implementing length-of-stay discounts or slightly higher rates for bookings made less than 100 days out to capitalize on advance planning.
- Target marketing efforts for the Summer season well in advance (at least 94 days) to capture early planners.
- Monitor your own booking lead times against these Vignec averages to identify opportunities for dynamic pricing adjustments.
Popular & Essential Airbnb Amenities in Vignec (2025)
Amenity Prevalence
Amenity Insights for Vignec
- Essential amenities in Vignec that guests expect include: Kitchen, TV, Heating. Lacking these (any) could significantly impact bookings.
- Popular amenities like Hot water, Microwave, Free parking on premises are common but not universal. Offering these can provide a competitive edge.
Recommendations for Hosts
- Ensure your listing includes all essential amenities for Vignec: Kitchen, TV, Heating.
- Prioritize adding missing essentials: TV, Heating.
- Consider adding popular differentiators like Hot water or Microwave to increase appeal.
- Highlight unique or less common amenities you offer (e.g., hot tub, dedicated workspace, EV charger) in your listing description and photos.
- Regularly check competitor amenities in Vignec to stay competitive.
Vignec Airbnb Guest Demographics & Profile Analysis (2025)
Guest Profile Summary for Vignec
- The typical guest profile for Airbnb in Vignec consists of primarily domestic travelers (86%), often arriving from nearby Toulouse, typically belonging to the Post-2000s (Gen Z/Alpha) group (50%), primarily speaking French or English.
- Domestic travelers account for 85.5% of guests.
- Key international markets include France (85.5%) and Spain (10.2%).
- Top languages spoken are French (43%) followed by English (33%).
- A significant demographic segment is the Post-2000s (Gen Z/Alpha) group, representing 50% of guests.
Recommendations for Hosts
- Target domestic marketing efforts towards travelers from Toulouse and Bordeaux.
- Tailor amenities and listing descriptions to appeal to the dominant Post-2000s (Gen Z/Alpha) demographic (e.g., highlight fast WiFi, smart home features, local guides).
- Highlight unique local experiences or amenities relevant to the primary guest profile.
- Consider seasonal promotions aligned with peak travel times for key origin markets.
Nearby Short-Term Rental Market Comparison
How does the Vignec Airbnb market stack up against its neighbors? Compare key performance metrics like average monthly revenue, ADR, and occupancy rates in surrounding areas to understand the broader regional STR landscape.
| Market | Active Properties | Monthly Revenue | Daily Rate | Avg. Occupancy |
|---|---|---|---|---|
| Canyelles | 49 | $5,958 | $1023.94 | 37% |
| la Baronia de Rialb | 14 | $4,296 | $393.88 | 43% |
| Sant Martí Sarroca | 10 | $3,855 | $337.60 | 43% |
| Banyeres del Penedès | 12 | $3,474 | $373.99 | 37% |
| Mediona | 11 | $3,355 | $550.99 | 37% |
| Corbera de Llobregat | 14 | $3,275 | $304.33 | 52% |
| Riudoms | 10 | $3,270 | $363.84 | 36% |
| Olivella | 94 | $3,211 | $420.71 | 41% |
| Castellet i la Gornal | 15 | $3,167 | $465.42 | 39% |
| Aiguamúrcia | 11 | $3,008 | $223.61 | 47% |