Toulouse Airbnb Market Analysis 2025: Short Term Rental Data & Vacation Rental Statistics in Occitania, France
Is Airbnb profitable in Toulouse in 2025? Explore comprehensive Airbnb analytics for Toulouse, Occitania, France to uncover income potential. This 2025 STR market report for Toulouse, based on AirROI data from April 2024 to March 2025, reveals key trends in the bustling market of 3,544 active listings.
Whether you're considering an Airbnb investment in Toulouse, optimizing your existing vacation rental, or exploring rental arbitrage opportunities, understanding the Toulouse Airbnb data is crucial. Navigating the high regulation landscape is key to maximizing your short term rental income potential. Let's dive into the specifics.
Key Toulouse Airbnb Performance Metrics Overview
Monthly Airbnb Revenue Variations & Income Potential in Toulouse (2025)
Understanding the monthly revenue variations for Airbnb listings in Toulouse is key to maximizing your short term rental income potential. Seasonality significantly impacts earnings. Our analysis, based on data from the past 12 months, shows that the peak revenue month for STRs in Toulouse is typically May, while February often presents the lowest earnings, highlighting opportunities for strategic pricing adjustments during shoulder and low seasons. Explore the typical Airbnb income in Toulouse across different performance tiers:
- Best-in-class properties (Top 10%) achieve $2,589+ monthly, often utilizing dynamic pricing and superior guest experiences.
- Strong performing properties (Top 25%) earn $1,796 or more, indicating effective management and desirable locations/amenities.
- Typical properties (Median) generate around $1,191 per month, representing the average market performance.
- Entry-level properties (Bottom 25%) see earnings around $663, often with potential for optimization.
Average Monthly Airbnb Earnings Trend in Toulouse
Toulouse Airbnb Occupancy Rate Trends (2025)
Maximize your bookings by understanding the Toulouse STR occupancy trends. Seasonal demand shifts significantly influence how often properties are booked. Typically, Septembersees the highest demand (peak season occupancy), while March experiences the lowest (low season). Effective strategies, like adjusting minimum stays or offering promotions, can boost occupancy during slower periods. Here's how different property tiers perform in Toulouse:
- Best-in-class properties (Top 10%) achieve 87%+ occupancy, indicating high desirability and potentially optimized availability.
- Strong performing properties (Top 25%) maintain 75% or higher occupancy, suggesting good market fit and guest satisfaction.
- Typical properties (Median) have an occupancy rate around 54%.
- Entry-level properties (Bottom 25%) average 28% occupancy, potentially facing higher vacancy.
Average Monthly Occupancy Rate Trend in Toulouse
Average Daily Rate (ADR) Airbnb Trends in Toulouse (2025)
Effective short term rental pricing strategy in Toulouse involves understanding monthly ADR fluctuations. The Average Daily Rate (ADR) for Airbnb in Toulouse typically peaks in December and dips lowest during April. Leveraging Airbnb dynamic pricing tools or strategies based on this seasonality can significantly boost revenue. Here's a look at the typical nightly rates achieved:
- Best-in-class properties (Top 10%) command rates of $132+ per night, often due to premium features or locations.
- Strong performing properties (Top 25%) achieve nightly rates of $90 or more.
- Typical properties (Median) charge around $64 per night.
- Entry-level properties (Bottom 25%) earn around $47 per night.
Average Daily Rate (ADR) Trend by Month in Toulouse
Get Live Toulouse Market Intelligence 👇

Explore Real-time Analytics
Airbnb Seasonality Analysis & Trends in Toulouse (2025)
Peak Season (May, June, April)
- Revenue averages $1,679 per month
- Occupancy rates average 49.1%
- Daily rates average $79
Shoulder Season
- Revenue averages $1,459 per month
- Occupancy maintains around 55.7%
- Daily rates hold near $82
Low Season (January, February, March)
- Revenue drops to average $1,057 per month
- Occupancy decreases to average 46.1%
- Daily rates adjust to average $81
Seasonality Insights for Toulouse
- The Airbnb seasonality in Toulouse shows moderate seasonality with distinct peak and low periods. While the sections above show seasonal averages, it's also insightful to look at the extremes:
- During the high season, the absolute peak month showcases Toulouse's highest earning potential, with monthly revenues capable of climbing to $1,735, occupancy reaching a high of 59.3%, and ADRs peaking at $86.
- Conversely, the slowest single month of the year, typically falling within the low season, marks the market's lowest point. In this month, revenue might dip to $1,032, occupancy could drop to 44.1%, and ADRs may adjust down to $79.
- Understanding both the seasonal averages and these monthly peaks and troughs in revenue, occupancy, and ADR is crucial for maximizing your Airbnb profit potential in Toulouse.
Seasonal Strategies for Maximizing Profit
- Peak Season: Maximize revenue through premium pricing and potentially longer minimum stays. Ensure high availability.
- Low Season: Offer competitive pricing, special promotions (e.g., extended stay discounts), and flexible cancellation policies. Target off-season travelers like remote workers or budget-conscious guests.
- Shoulder Seasons: Implement dynamic pricing that balances peak and low rates. Target weekend travelers or specific events. Offer slightly more flexible terms than peak season.
- Regularly analyze your own performance against these Toulouse seasonality benchmarks and adjust your pricing and availability strategy accordingly.
Best Areas for Airbnb Investment in Toulouse (2025)
Exploring the top neighborhoods for short-term rentals in Toulouse? This section highlights key areas, outlining why they are attractive for hosts and guests, along with notable local attractions. Consider these locations based on your target guest profile and investment strategy.
| Neighborhood / Area | Why Host Here? (Target Guests & Appeal) | Key Attractions & Landmarks |
|---|---|---|
| Capitole | The historic heart of Toulouse, known for its stunning architecture and vibrant atmosphere. It's a popular spot for tourists due to its central location and proximity to key attractions. | Capitole de Toulouse, Place du Capitole, Toulouse Cathedral, Victor Hugo Market, Museum of Toulouse, Canal du Midi |
| Saint-Cyprien | An up-and-coming neighborhood located across the Garonne River. Famous for its artistic vibe, local eateries, and close-knit community. It offers a more affordable option for visitors and a unique cultural experience. | Saint-Cyprien Church, La Prairie des Filatiers, Les Abattoirs, Open-air markets, Garonne Riverbanks |
| Carmelitains | A trendy district known for its lively atmosphere, with numerous cafés, bars, and small shops. It's increasingly popular among younger travelers looking for a vibrant nightlife and cultural experiences. | Carmelite Monastery, Pierre Goudouli Square, Café des Artistes, local boutique shops, live music venues |
| Les Chalets | A residential area that balances local life with easy access to city attractions. Known for its beautiful gardens and parks, perfect for families or travelers seeking a quieter stay. | Jardin des Plantes, Cité de l'Espace, Capitole Theater, local parks, family-friendly restaurants |
| Minimes | A diverse neighborhood popular with students and young professionals, offering a mix of local shops and restaurants. It's close to the university and provides a lively atmosphere. | Canal de Brienne, Les Argoulets Park, local markets, University of Toulouse, bicycle paths |
| Rangueil | Well-known for its proximity to several universities and hospitals, this neighborhood attracts academic visitors and healthcare professionals, making it a strategic investment for Airbnb rentals. | Rangueil University, Hospital Purpan, local student cafés, green spaces, scenic viewpoints |
| Port Saint-Sauveur | A picturesque area along the canal that draws visitors for its scenic views and leisure activities. Great for tourists looking to enjoy outdoor activities and a more tranquil setting. | Canal de la Garonne, biking paths, waterfront restaurants, park areas, art installations |
| Compans-Caffarelli | A growing area with a beautiful park and proximity to the business district. It's popular among corporate travelers and those attending conferences, making it ideal for short-term rentals. | Compans Caffarelli Park, Japanese Garden, Palais des Congrès, business hotel amenities, local eateries |
Understanding Airbnb License Requirements & STR Laws in Toulouse (2025)
Yes, Toulouse, Occitania, France enforces high STR regulations. Obtaining a license and ensuring compliance is almost certainly required according to current 2025 STR laws. Always verify the latest short term rental regulations and Airbnb license requirements directly with local government authorities for Toulouse to ensure full compliance before hosting.
(Source: AirROI data, 2025, based on 71% licensed listings)
Top Performing Airbnb Properties in Toulouse (2025)
Benchmark your potential! Explore examples of top-performing Airbnb properties in Toulousebased on Trailing Twelve Month (TTM) revenue. Analyze their characteristics, revenue, occupancy rate, and ADR to understand what drives success in this market.
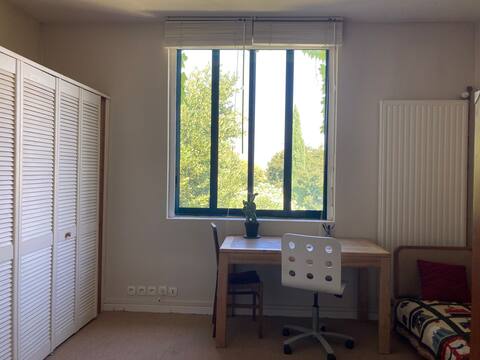
Studio proche métro + parking
Entire Place • 1 bedroom

Villa Sainte Blanche
Entire Place • 6 bedrooms
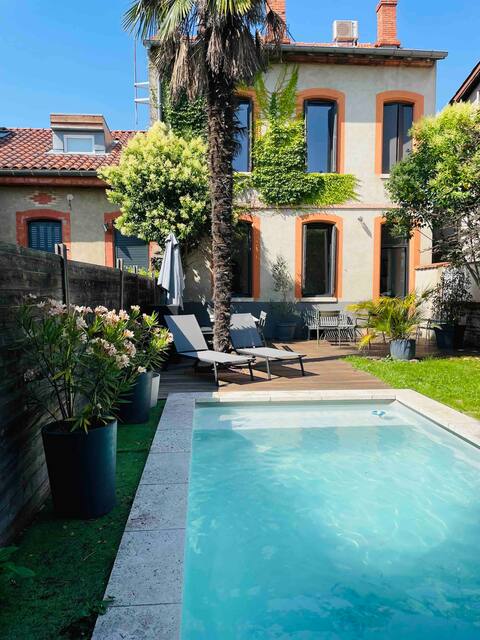
Authentic Toulouse House
Entire Place • 4 bedrooms

Architect Villa 400m2 with Indoor Pool
Entire Place • 5 bedrooms
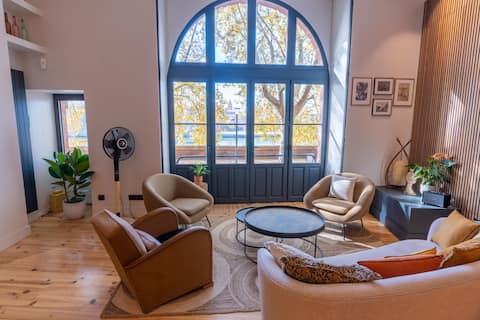
Le Lombard: Panorama of the Garonne
Entire Place • 3 bedrooms
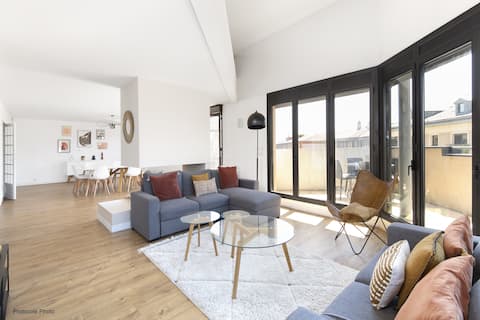
Nocnoc <Le Pargamin> Large duplex Place St Pierre
Entire Place • 5 bedrooms
Note: Performance varies based on location, size, amenities, seasonality, and management quality. Data reflects the past 12 months.
Top Performing Airbnb Hosts in Toulouse (2025)
Learn from the best! This table showcases top-performing Airbnb hosts in Toulouse based on the number of properties managed and estimated total revenue over the past year. Analyze their scale and performance metrics.
| Host Name | Properties | Grossing Revenue | Stay Reviews | Avg Rating |
|---|---|---|---|---|
| Agence COCOONR / BOOK&PAY | 80 | $1,682,276 | 1541 | 4.34/5.0 |
| Mathieu | 33 | $750,590 | 1667 | 4.81/5.0 |
| Emilie & Jordan | 46 | $635,070 | 1526 | 3.82/5.0 |
| Angie | 35 | $582,568 | 942 | 4.68/5.0 |
| Yumē | 24 | $488,535 | 1433 | 4.74/5.0 |
| Conciergerie Toulouzhanna | 21 | $395,142 | 1332 | 4.71/5.0 |
| Philippe | 16 | $351,114 | 335 | 4.19/5.0 |
| Julien | 19 | $346,258 | 914 | 4.38/5.0 |
| Eric | 16 | $327,697 | 764 | 4.45/5.0 |
| Agence Cocoonr Toulouse | 20 | $321,972 | 1154 | 4.58/5.0 |
Analyzing the strategies of top hosts, such as their property selection, pricing, and guest communication, can offer valuable lessons for optimizing your own Airbnb operations in Toulouse.
Dive Deeper: Advanced Toulouse STR Market Data (2025)
Ready to unlock more insights? AirROI provides access to advanced metrics and comprehensive Airbnb data for Toulouse. Explore detailed analytics beyond this report to refine your investment strategy, optimize pricing, and maximize your vacation rental profits.
Explore Advanced MetricsToulouse Short-Term Rental Market Composition (2025): Property & Room Types
Room Type Distribution
Property Type Distribution
Market Composition Insights for Toulouse
- The Toulouse Airbnb market composition is heavily skewed towards Entire Home/Apt listings, which make up 83.4% of the 3,544 active rentals. This indicates strong guest preference for privacy and space.
- Looking at the property type distribution in Toulouse, Apartment/Condo properties are the most common (85.1%), reflecting the local real estate landscape.
- Smaller segments like hotel/boutique, others, outdoor/unique, unique stays (combined 3.8%) offer potential for unique stay experiences.
Toulouse Airbnb Room Capacity Analysis (2025): Bedroom Distribution
Distribution of Listings by Number of Bedrooms
Room Capacity Insights for Toulouse
- The dominant room capacity in Toulouse is 1 bedroom listings, making up 51.8% of the market. This suggests a strong demand for properties suitable for couples or solo travelers.
- Together, 1 bedroom and 2 bedrooms properties represent 68.4% of the active Airbnb listings in Toulouse, indicating a high concentration in these sizes.
- With over half the market (51.8%) consisting of studios or 1-bedroom units, Toulouse is particularly well-suited for individuals or couples.
- Listings with 3+ bedrooms (8.7%) represent a smaller niche, potentially indicating an underserved market for larger group accommodations in Toulouse.
Toulouse Vacation Rental Guest Capacity Trends (2025)
Distribution of Listings by Guest Capacity
Guest Capacity Insights for Toulouse
- The most common guest capacity trend in Toulouse vacation rentals is listings accommodating 2 guests (39.1%). This suggests the primary traveler segment is likely couples or solo travelers.
- Properties designed for 2 guests and 4 guests dominate the Toulouse STR market, accounting for 66.7% of listings.
- A significant 41.7% of listings cater specifically to 1-2 guests, highlighting strong demand from couples and solo travelers in Toulouse.
- 11.5% of properties accommodate 6+ guests, serving the market segment for larger families or group travel in Toulouse.
- On average, properties in Toulouse are equipped to host 3.0 guests.
Toulouse Airbnb Booking Patterns (2025): Available vs. Booked Days
Available Days Distribution
Booked Days Distribution
Booking Pattern Insights for Toulouse
- The most common availability pattern in Toulouse falls within the 91-180 days range, representing 29.8% of listings. This suggests many properties have significant open periods on their calendars.
- Approximately 57.8% of listings show high availability (181+ days open annually), indicating potential for increased bookings or specific owner usage patterns.
- For booked days, the 181-270 days range is most frequent in Toulouse (30%), reflecting common guest stay durations or potential owner blocking patterns.
- A notable 43.6% of properties secure long booking periods (181+ days booked per year), highlighting successful long-term rental strategies or significant owner usage.
Toulouse Airbnb Minimum Stay Requirements Analysis
Distribution of Listings by Minimum Night Requirement
1 Night
812 listings
25.6% of total
2 Nights
1075 listings
33.9% of total
3 Nights
403 listings
12.7% of total
4-6 Nights
233 listings
7.3% of total
7-29 Nights
119 listings
3.8% of total
30+ Nights
530 listings
16.7% of total
Key Insights
- The most prevalent minimum stay requirement in Toulouse is 2 Nights, adopted by 33.9% of listings. This highlights the market's preference for shorter, flexible bookings.
- A significant segment (16.7%) caters to monthly stays (30+ nights) in Toulouse, pointing to opportunities in the extended-stay market.
Recommendations
- Align with the market by considering a 2 Nights minimum stay, as 33.9% of Toulouse hosts use this setting.
- If feasible, allowing 1-night stays, especially midweek or during low season, could capture last-minute bookings, as only 25.6% currently do.
- Explore offering discounts for stays of 30+ nights to attract the 16.7% of the market seeking extended stays.
- Adjust minimum nights based on seasonality – potentially shorter during low season and longer during peak demand periods in Toulouse.
Toulouse Airbnb Cancellation Policy Trends Analysis (2025)
Non-refundable
1 listings
0% of total
Refundable
1 listings
0% of total
Super Strict 30 Days
1 listings
0% of total
Flexible
929 listings
30.9% of total
Moderate
1338 listings
44.4% of total
Firm
338 listings
11.2% of total
Strict
403 listings
13.4% of total
Cancellation Policy Insights for Toulouse
- The prevailing Airbnb cancellation policy trend in Toulouse is Moderate, used by 44.4% of listings.
- The market strongly favors guest-friendly terms, with 75.3% of listings offering Flexible or Moderate policies. This suggests guests in Toulouse may expect booking flexibility.
Recommendations for Hosts
- Consider adopting a Moderate policy to align with the 44.4% market standard in Toulouse.
- Using a Strict policy might deter some guests, as only 13.4% of listings use it. Evaluate if potential revenue protection outweighs possible lower booking rates.
- Regularly review your cancellation policy against competitors and market demand shifts in Toulouse.
Toulouse STR Booking Lead Time Analysis (2025)
Average Booking Lead Time by Month
Booking Lead Time Insights for Toulouse
- The overall average booking lead time for vacation rentals in Toulouse is 36 days.
- Guests book furthest in advance for stays during June (average 53 days), likely coinciding with peak travel demand or local events.
- The shortest booking windows occur for stays in February (average 29 days), indicating more last-minute travel plans during this time.
- Seasonally, Summer (47 days avg.) sees the longest lead times, while Winter (31 days avg.) has the shortest, reflecting typical travel planning cycles.
Recommendations for Hosts
- Use the overall average lead time (36 days) as a baseline for your pricing and availability strategy in Toulouse.
- For June stays, consider implementing length-of-stay discounts or slightly higher rates for bookings made less than 53 days out to capitalize on advance planning.
- Target marketing efforts for the Summer season well in advance (at least 47 days) to capture early planners.
- Monitor your own booking lead times against these Toulouse averages to identify opportunities for dynamic pricing adjustments.
Popular & Essential Airbnb Amenities in Toulouse (2025)
Amenity Prevalence
Amenity Insights for Toulouse
- Essential amenities in Toulouse that guests expect include: Kitchen, Heating, Wifi. Lacking these (any) could significantly impact bookings.
- Popular amenities like Hot water, Smoke alarm, Essentials are common but not universal. Offering these can provide a competitive edge.
Recommendations for Hosts
- Ensure your listing includes all essential amenities for Toulouse: Kitchen, Heating, Wifi.
- Prioritize adding missing essentials: Kitchen, Heating, Wifi.
- Consider adding popular differentiators like Hot water or Smoke alarm to increase appeal.
- Highlight unique or less common amenities you offer (e.g., hot tub, dedicated workspace, EV charger) in your listing description and photos.
- Regularly check competitor amenities in Toulouse to stay competitive.
Toulouse Airbnb Guest Demographics & Profile Analysis (2025)
Guest Profile Summary for Toulouse
- The typical guest profile for Airbnb in Toulouse consists of primarily domestic travelers (71%), often arriving from nearby Paris, typically belonging to the Post-2000s (Gen Z/Alpha) group (50%), primarily speaking French or English.
- Domestic travelers account for 70.6% of guests.
- Key international markets include France (70.6%) and United Kingdom (4.4%).
- Top languages spoken are French (37.9%) followed by English (34.4%).
- A significant demographic segment is the Post-2000s (Gen Z/Alpha) group, representing 50% of guests.
Recommendations for Hosts
- Target domestic marketing efforts towards travelers from Paris and Toulouse.
- Tailor amenities and listing descriptions to appeal to the dominant Post-2000s (Gen Z/Alpha) demographic (e.g., highlight fast WiFi, smart home features, local guides).
- Highlight unique local experiences or amenities relevant to the primary guest profile.
- Consider seasonal promotions aligned with peak travel times for key origin markets.
Nearby Short-Term Rental Market Comparison
How does the Toulouse Airbnb market stack up against its neighbors? Compare key performance metrics like average monthly revenue, ADR, and occupancy rates in surrounding areas to understand the broader regional STR landscape.
| Market | Active Properties | Monthly Revenue | Daily Rate | Avg. Occupancy |
|---|---|---|---|---|
| Cornellà del Terri | 17 | $4,960 | $460.96 | 41% |
| Amer | 10 | $4,848 | $397.58 | 40% |
| Porqueres | 12 | $4,714 | $469.05 | 36% |
| la Baronia de Rialb | 14 | $4,296 | $393.88 | 43% |
| Bordils | 11 | $3,557 | $525.15 | 36% |
| Vilademuls | 20 | $3,489 | $328.54 | 36% |
| Vilanant | 10 | $3,424 | $343.93 | 34% |
| Astaffort | 10 | $3,393 | $314.20 | 35% |
| Bàscara | 13 | $3,317 | $437.52 | 39% |
| Castelnou | 12 | $3,274 | $302.12 | 31% |