Thuir Airbnb Market Analysis 2025: Short Term Rental Data & Vacation Rental Statistics in Occitania, France
Is Airbnb profitable in Thuir in 2025? Explore comprehensive Airbnb analytics for Thuir, Occitania, France to uncover income potential. This 2025 STR market report for Thuir, based on AirROI data from April 2024 to March 2025, reveals key trends in the niche market of 75 active listings.
Whether you're considering an Airbnb investment in Thuir, optimizing your existing vacation rental, or exploring rental arbitrage opportunities, understanding the Thuir Airbnb data is crucial. Leveraging the low regulation environment is key to maximizing your short term rental income potential. Let's dive into the specifics.
Key Thuir Airbnb Performance Metrics Overview
Monthly Airbnb Revenue Variations & Income Potential in Thuir (2025)
Understanding the monthly revenue variations for Airbnb listings in Thuir is key to maximizing your short term rental income potential. Seasonality significantly impacts earnings. Our analysis, based on data from the past 12 months, shows that the peak revenue month for STRs in Thuir is typically August, while March often presents the lowest earnings, highlighting opportunities for strategic pricing adjustments during shoulder and low seasons. Explore the typical Airbnb income in Thuir across different performance tiers:
- Best-in-class properties (Top 10%) achieve $2,901+ monthly, often utilizing dynamic pricing and superior guest experiences.
- Strong performing properties (Top 25%) earn $1,429 or more, indicating effective management and desirable locations/amenities.
- Typical properties (Median) generate around $809 per month, representing the average market performance.
- Entry-level properties (Bottom 25%) see earnings around $412, often with potential for optimization.
Average Monthly Airbnb Earnings Trend in Thuir
Thuir Airbnb Occupancy Rate Trends (2025)
Maximize your bookings by understanding the Thuir STR occupancy trends. Seasonal demand shifts significantly influence how often properties are booked. Typically, Augustsees the highest demand (peak season occupancy), while March experiences the lowest (low season). Effective strategies, like adjusting minimum stays or offering promotions, can boost occupancy during slower periods. Here's how different property tiers perform in Thuir:
- Best-in-class properties (Top 10%) achieve 63%+ occupancy, indicating high desirability and potentially optimized availability.
- Strong performing properties (Top 25%) maintain 43% or higher occupancy, suggesting good market fit and guest satisfaction.
- Typical properties (Median) have an occupancy rate around 27%.
- Entry-level properties (Bottom 25%) average 14% occupancy, potentially facing higher vacancy.
Average Monthly Occupancy Rate Trend in Thuir
Average Daily Rate (ADR) Airbnb Trends in Thuir (2025)
Effective short term rental pricing strategy in Thuir involves understanding monthly ADR fluctuations. The Average Daily Rate (ADR) for Airbnb in Thuir typically peaks in July and dips lowest during November. Leveraging Airbnb dynamic pricing tools or strategies based on this seasonality can significantly boost revenue. Here's a look at the typical nightly rates achieved:
- Best-in-class properties (Top 10%) command rates of $214+ per night, often due to premium features or locations.
- Strong performing properties (Top 25%) achieve nightly rates of $135 or more.
- Typical properties (Median) charge around $88 per night.
- Entry-level properties (Bottom 25%) earn around $60 per night.
Average Daily Rate (ADR) Trend by Month in Thuir
Get Live Thuir Market Intelligence 👇

Explore Real-time Analytics
Airbnb Seasonality Analysis & Trends in Thuir (2025)
Peak Season (August, April, July)
- Revenue averages $2,016 per month
- Occupancy rates average 45.4%
- Daily rates average $129
Shoulder Season
- Revenue averages $1,170 per month
- Occupancy maintains around 30.4%
- Daily rates hold near $120
Low Season (January, March, November)
- Revenue drops to average $588 per month
- Occupancy decreases to average 20.0%
- Daily rates adjust to average $107
Seasonality Insights for Thuir
- The Airbnb seasonality in Thuir shows highly seasonal trends requiring careful strategy. While the sections above show seasonal averages, it's also insightful to look at the extremes:
- During the high season, the absolute peak month showcases Thuir's highest earning potential, with monthly revenues capable of climbing to $2,196, occupancy reaching a high of 58.7%, and ADRs peaking at $129.
- Conversely, the slowest single month of the year, typically falling within the low season, marks the market's lowest point. In this month, revenue might dip to $507, occupancy could drop to 16.7%, and ADRs may adjust down to $105.
- Understanding both the seasonal averages and these monthly peaks and troughs in revenue, occupancy, and ADR is crucial for maximizing your Airbnb profit potential in Thuir.
Seasonal Strategies for Maximizing Profit
- Peak Season: Maximize revenue through premium pricing and potentially longer minimum stays. Ensure high availability.
- Low Season: Offer competitive pricing, special promotions (e.g., extended stay discounts), and flexible cancellation policies. Target off-season travelers like remote workers or budget-conscious guests.
- Shoulder Seasons: Implement dynamic pricing that balances peak and low rates. Target weekend travelers or specific events. Offer slightly more flexible terms than peak season.
- Regularly analyze your own performance against these Thuir seasonality benchmarks and adjust your pricing and availability strategy accordingly.
Best Areas for Airbnb Investment in Thuir (2025)
Exploring the top neighborhoods for short-term rentals in Thuir? This section highlights key areas, outlining why they are attractive for hosts and guests, along with notable local attractions. Consider these locations based on your target guest profile and investment strategy.
| Neighborhood / Area | Why Host Here? (Target Guests & Appeal) | Key Attractions & Landmarks |
|---|---|---|
| Thuir City Center | The heart of Thuir, offering charming streets and proximity to cafes and shops. It’s appealing for those who want to experience local culture and amenities. | Thuir Natural History Museum, the local market, Place de la République |
| Les Aspres | A picturesque area around Thuir known for its vineyards and scenic rural landscapes. Ideal for those looking for a quieter stay amidst nature. | Vineyards, Cycling routes, Hiking trails |
| Thuir Arboretum | A beautiful park with diverse plant species, perfect for outdoor lovers. This area will attract visitors looking for relaxation and nature walks. | Arboretum de la Vigne et des Vins, Walking paths, Picnic areas |
| Banyuls-sur-Mer | Close to Thuir, this coastal town offers stunning beaches and marine life. Attractive to those who want both relaxation and adventure by the sea. | Beaches, Scuba diving, Wine tasting at local vineyards |
| Perpignan | A nearby city with rich history and vibrant culture. It offers a wider range of attractions for tourists seeking urban experiences. | Palais des Rois de Majorque, Perpignan Cathedral, Le Castillet |
| Céret | Famous for its cherries and art scene, this charming town is popular among tourists looking for cultural experiences and art galleries. | Musee d'Art Moderne, Céret cherry festival, Historic town center |
| Collioure | A beautiful coastal village west of Thuir known for its stunning harbor and artistic heritage. It attracts visitors seeking beautiful views and local cuisine. | Collioure Beach, Château Royal, Art galleries |
| Saint-Cyprien | A popular beach resort town close to Thuir, ideal for travelers looking for sun and sea activities along with family-friendly amenities. | St-Cyprien Plage, Water sports, Golf courses |
Understanding Airbnb License Requirements & STR Laws in Thuir (2025)
While Thuir, Occitania, France currently shows low STR regulations, specific Airbnb license requirements might still exist or change. Always verify the latest short term rental regulations and Airbnb license requirements directly with local government authorities for Thuir to ensure full compliance before hosting.
(Source: AirROI data, 2025, based on 7% licensed listings)
Top Performing Airbnb Properties in Thuir (2025)
Benchmark your potential! Explore examples of top-performing Airbnb properties in Thuirbased on Trailing Twelve Month (TTM) revenue. Analyze their characteristics, revenue, occupancy rate, and ADR to understand what drives success in this market.
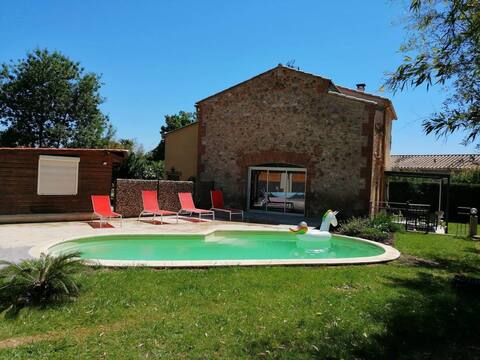
Comfortable CATALAN MAS
Entire Place • 6 bedrooms
L'Eden des Aspres
Entire Place • 3 bedrooms
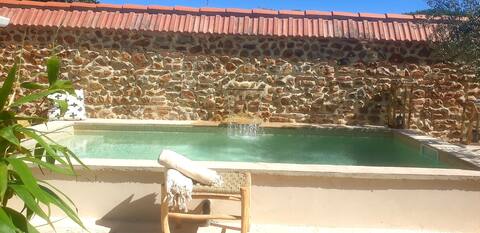
La parenthèse Thuir gite 4 stars with pool.
Entire Place • 2 bedrooms

weekend love as a couple
Entire Place • 1 bedroom
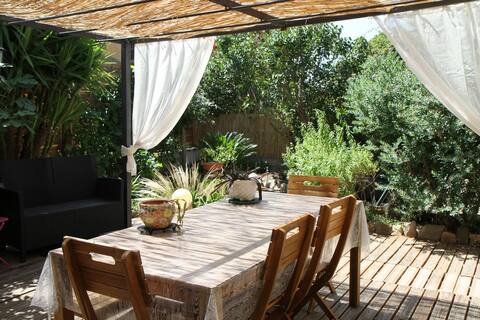
Maison : La Casa Felice
Entire Place • 3 bedrooms

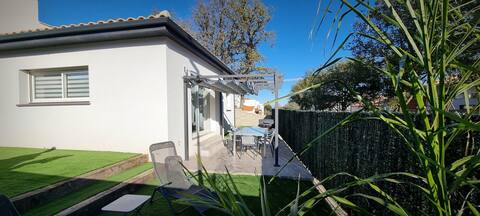
House with large garden - Can cando
Entire Place • 2 bedrooms
Note: Performance varies based on location, size, amenities, seasonality, and management quality. Data reflects the past 12 months.
Top Performing Airbnb Hosts in Thuir (2025)
Learn from the best! This table showcases top-performing Airbnb hosts in Thuir based on the number of properties managed and estimated total revenue over the past year. Analyze their scale and performance metrics.
| Host Name | Properties | Grossing Revenue | Stay Reviews | Avg Rating |
|---|---|---|---|---|
| Fabrice | 3 | $43,013 | 25 | 3.20/5.0 |
| Christophe | 1 | $42,217 | 4 | 4.75/5.0 |
| Hélène | 1 | $37,400 | 27 | 4.89/5.0 |
| Valerie | 1 | $28,476 | 90 | 4.92/5.0 |
| Muriel | 1 | $22,707 | 5 | 5.00/5.0 |
| Galdric | 1 | $22,533 | 20 | 4.90/5.0 |
| Anne-Marie | 1 | $20,976 | 10 | 5.00/5.0 |
| Louise | 1 | $20,528 | 38 | 4.97/5.0 |
| Pascal | 1 | $19,745 | 12 | 5.00/5.0 |
| Host #209959502 | 1 | $17,220 | 3 | 5.00/5.0 |
Analyzing the strategies of top hosts, such as their property selection, pricing, and guest communication, can offer valuable lessons for optimizing your own Airbnb operations in Thuir.
Dive Deeper: Advanced Thuir STR Market Data (2025)
Ready to unlock more insights? AirROI provides access to advanced metrics and comprehensive Airbnb data for Thuir. Explore detailed analytics beyond this report to refine your investment strategy, optimize pricing, and maximize your vacation rental profits.
Explore Advanced MetricsThuir Short-Term Rental Market Composition (2025): Property & Room Types
Room Type Distribution
Property Type Distribution
Market Composition Insights for Thuir
- The Thuir Airbnb market composition is heavily skewed towards Entire Home/Apt listings, which make up 89.3% of the 75 active rentals. This indicates strong guest preference for privacy and space.
- Looking at the property type distribution in Thuir, House properties are the most common (64%), reflecting the local real estate landscape.
- Houses represent a significant 64% portion, catering likely to families or larger groups.
- Smaller segments like others, outdoor/unique, unique stays, hotel/boutique (combined 9.3%) offer potential for unique stay experiences.
Thuir Airbnb Room Capacity Analysis (2025): Bedroom Distribution
Distribution of Listings by Number of Bedrooms
Room Capacity Insights for Thuir
- The dominant room capacity in Thuir is 1 bedroom listings, making up 42.7% of the market. This suggests a strong demand for properties suitable for couples or solo travelers.
- Together, 1 bedroom and 2 bedrooms properties represent 68.0% of the active Airbnb listings in Thuir, indicating a high concentration in these sizes.
- A significant 25.3% of listings offer 3+ bedrooms, catering to larger groups and families seeking more space in Thuir.
Thuir Vacation Rental Guest Capacity Trends (2025)
Distribution of Listings by Guest Capacity
Guest Capacity Insights for Thuir
- The most common guest capacity trend in Thuir vacation rentals is listings accommodating 2 guests (28%). This suggests the primary traveler segment is likely couples or solo travelers.
- Properties designed for 2 guests and 4 guests dominate the Thuir STR market, accounting for 56.0% of listings.
- 29.4% of properties accommodate 6+ guests, serving the market segment for larger families or group travel in Thuir.
- On average, properties in Thuir are equipped to host 4.0 guests.
Thuir Airbnb Booking Patterns (2025): Available vs. Booked Days
Available Days Distribution
Booked Days Distribution
Booking Pattern Insights for Thuir
- The most common availability pattern in Thuir falls within the 271-366 days range, representing 60% of listings. This suggests many properties have significant open periods on their calendars.
- Approximately 94.7% of listings show high availability (181+ days open annually), indicating potential for increased bookings or specific owner usage patterns.
- For booked days, the 91-180 days range is most frequent in Thuir (38.7%), reflecting common guest stay durations or potential owner blocking patterns.
- A notable 5.3% of properties secure long booking periods (181+ days booked per year), highlighting successful long-term rental strategies or significant owner usage.
Thuir Airbnb Minimum Stay Requirements Analysis
Distribution of Listings by Minimum Night Requirement
1 Night
16 listings
24.2% of total
2 Nights
30 listings
45.5% of total
3 Nights
8 listings
12.1% of total
4-6 Nights
9 listings
13.6% of total
7-29 Nights
3 listings
4.5% of total
Key Insights
- The most prevalent minimum stay requirement in Thuir is 2 Nights, adopted by 45.5% of listings. This highlights the market's preference for shorter, flexible bookings.
- A strong majority (69.7%) of the Thuir Airbnb data shows acceptance of very short stays (1-2 nights), indicating a dynamic, high-turnover market.
Recommendations
- Align with the market by considering a 2 Nights minimum stay, as 45.5% of Thuir hosts use this setting.
- If feasible, allowing 1-night stays, especially midweek or during low season, could capture last-minute bookings, as only 24.2% currently do.
- Adjust minimum nights based on seasonality – potentially shorter during low season and longer during peak demand periods in Thuir.
Thuir Airbnb Cancellation Policy Trends Analysis (2025)
Flexible
14 listings
21.5% of total
Moderate
21 listings
32.3% of total
Firm
11 listings
16.9% of total
Strict
19 listings
29.2% of total
Cancellation Policy Insights for Thuir
- The prevailing Airbnb cancellation policy trend in Thuir is Moderate, used by 32.3% of listings.
- There's a relatively balanced mix between guest-friendly (53.8%) and stricter (46.1%) policies, offering choices for different guest needs.
Recommendations for Hosts
- Consider adopting a Moderate policy to align with the 32.3% market standard in Thuir.
- Regularly review your cancellation policy against competitors and market demand shifts in Thuir.
Thuir STR Booking Lead Time Analysis (2025)
Average Booking Lead Time by Month
Booking Lead Time Insights for Thuir
- The overall average booking lead time for vacation rentals in Thuir is 45 days.
- Guests book furthest in advance for stays during July (average 72 days), likely coinciding with peak travel demand or local events.
- The shortest booking windows occur for stays in March (average 18 days), indicating more last-minute travel plans during this time.
- Seasonally, Summer (67 days avg.) sees the longest lead times, while Spring (35 days avg.) has the shortest, reflecting typical travel planning cycles.
Recommendations for Hosts
- Use the overall average lead time (45 days) as a baseline for your pricing and availability strategy in Thuir.
- For July stays, consider implementing length-of-stay discounts or slightly higher rates for bookings made less than 72 days out to capitalize on advance planning.
- Target marketing efforts for the Summer season well in advance (at least 67 days) to capture early planners.
- Monitor your own booking lead times against these Thuir averages to identify opportunities for dynamic pricing adjustments.
Popular & Essential Airbnb Amenities in Thuir (2025)
Amenity Prevalence
Amenity Insights for Thuir
- Essential amenities in Thuir that guests expect include: Kitchen. Lacking these (this) could significantly impact bookings.
- Popular amenities like Wifi, Hot water, Heating are common but not universal. Offering these can provide a competitive edge.
- Warning: Wifi is not universally provided but is considered essential globally. Ensure reliable Wifi is offered.
Recommendations for Hosts
- Ensure your listing includes all essential amenities for Thuir: Kitchen.
- Prioritize adding missing essentials: Kitchen.
- Consider adding popular differentiators like Wifi or Hot water to increase appeal.
- Highlight unique or less common amenities you offer (e.g., hot tub, dedicated workspace, EV charger) in your listing description and photos.
- Regularly check competitor amenities in Thuir to stay competitive.
Thuir Airbnb Guest Demographics & Profile Analysis (2025)
Guest Profile Summary for Thuir
- The typical guest profile for Airbnb in Thuir consists of primarily domestic travelers (75%), often arriving from nearby Toulouse, typically belonging to the Post-2000s (Gen Z/Alpha) group (50%), primarily speaking French or English.
- Domestic travelers account for 75.2% of guests.
- Key international markets include France (75.2%) and Spain (7.8%).
- Top languages spoken are French (38.9%) followed by English (29.6%).
- A significant demographic segment is the Post-2000s (Gen Z/Alpha) group, representing 50% of guests.
Recommendations for Hosts
- Target domestic marketing efforts towards travelers from Toulouse and Paris.
- Tailor amenities and listing descriptions to appeal to the dominant Post-2000s (Gen Z/Alpha) demographic (e.g., highlight fast WiFi, smart home features, local guides).
- Highlight unique local experiences or amenities relevant to the primary guest profile.
- Consider seasonal promotions aligned with peak travel times for key origin markets.
Nearby Short-Term Rental Market Comparison
How does the Thuir Airbnb market stack up against its neighbors? Compare key performance metrics like average monthly revenue, ADR, and occupancy rates in surrounding areas to understand the broader regional STR landscape.
| Market | Active Properties | Monthly Revenue | Daily Rate | Avg. Occupancy |
|---|---|---|---|---|
| Vall-llobrega | 15 | $10,261 | $798.88 | 44% |
| Canyelles | 49 | $5,958 | $1023.94 | 37% |
| Arenys de Munt | 28 | $5,100 | $514.27 | 41% |
| Teià | 25 | $5,027 | $348.45 | 45% |
| Cornellà del Terri | 17 | $4,960 | $460.96 | 41% |
| Tiana | 12 | $4,955 | $299.97 | 48% |
| Amer | 10 | $4,848 | $397.58 | 40% |
| Bescanó | 11 | $4,761 | $445.38 | 41% |
| Porqueres | 12 | $4,714 | $469.05 | 36% |
| Premià de Dalt | 28 | $4,630 | $345.43 | 49% |