Teyran Airbnb Market Analysis 2025: Short Term Rental Data & Vacation Rental Statistics in Occitania, France
Is Airbnb profitable in Teyran in 2025? Explore comprehensive Airbnb analytics for Teyran, Occitania, France to uncover income potential. This 2025 STR market report for Teyran, based on AirROI data from April 2024 to March 2025, reveals key trends in the niche market of 31 active listings.
Whether you're considering an Airbnb investment in Teyran, optimizing your existing vacation rental, or exploring rental arbitrage opportunities, understanding the Teyran Airbnb data is crucial. Leveraging the low regulation environment is key to maximizing your short term rental income potential. Let's dive into the specifics.
Key Teyran Airbnb Performance Metrics Overview
Monthly Airbnb Revenue Variations & Income Potential in Teyran (2025)
Understanding the monthly revenue variations for Airbnb listings in Teyran is key to maximizing your short term rental income potential. Seasonality significantly impacts earnings. Our analysis, based on data from the past 12 months, shows that the peak revenue month for STRs in Teyran is typically August, while February often presents the lowest earnings, highlighting opportunities for strategic pricing adjustments during shoulder and low seasons. Explore the typical Airbnb income in Teyran across different performance tiers:
- Best-in-class properties (Top 10%) achieve $3,963+ monthly, often utilizing dynamic pricing and superior guest experiences.
- Strong performing properties (Top 25%) earn $2,107 or more, indicating effective management and desirable locations/amenities.
- Typical properties (Median) generate around $1,230 per month, representing the average market performance.
- Entry-level properties (Bottom 25%) see earnings around $680, often with potential for optimization.
Average Monthly Airbnb Earnings Trend in Teyran
Teyran Airbnb Occupancy Rate Trends (2025)
Maximize your bookings by understanding the Teyran STR occupancy trends. Seasonal demand shifts significantly influence how often properties are booked. Typically, Augustsees the highest demand (peak season occupancy), while June experiences the lowest (low season). Effective strategies, like adjusting minimum stays or offering promotions, can boost occupancy during slower periods. Here's how different property tiers perform in Teyran:
- Best-in-class properties (Top 10%) achieve 75%+ occupancy, indicating high desirability and potentially optimized availability.
- Strong performing properties (Top 25%) maintain 59% or higher occupancy, suggesting good market fit and guest satisfaction.
- Typical properties (Median) have an occupancy rate around 38%.
- Entry-level properties (Bottom 25%) average 25% occupancy, potentially facing higher vacancy.
Average Monthly Occupancy Rate Trend in Teyran
Average Daily Rate (ADR) Airbnb Trends in Teyran (2025)
Effective short term rental pricing strategy in Teyran involves understanding monthly ADR fluctuations. The Average Daily Rate (ADR) for Airbnb in Teyran typically peaks in August and dips lowest during March. Leveraging Airbnb dynamic pricing tools or strategies based on this seasonality can significantly boost revenue. Here's a look at the typical nightly rates achieved:
- Best-in-class properties (Top 10%) command rates of $415+ per night, often due to premium features or locations.
- Strong performing properties (Top 25%) achieve nightly rates of $291 or more.
- Typical properties (Median) charge around $122 per night.
- Entry-level properties (Bottom 25%) earn around $67 per night.
Average Daily Rate (ADR) Trend by Month in Teyran
Get Live Teyran Market Intelligence 👇

Explore Real-time Analytics
Airbnb Seasonality Analysis & Trends in Teyran (2025)
Peak Season (August, July, May)
- Revenue averages $2,887 per month
- Occupancy rates average 58.9%
- Daily rates average $193
Shoulder Season
- Revenue averages $1,585 per month
- Occupancy maintains around 38.6%
- Daily rates hold near $189
Low Season (January, February, March)
- Revenue drops to average $840 per month
- Occupancy decreases to average 31.1%
- Daily rates adjust to average $182
Seasonality Insights for Teyran
- The Airbnb seasonality in Teyran shows highly seasonal trends requiring careful strategy. While the sections above show seasonal averages, it's also insightful to look at the extremes:
- During the high season, the absolute peak month showcases Teyran's highest earning potential, with monthly revenues capable of climbing to $3,614, occupancy reaching a high of 65.7%, and ADRs peaking at $196.
- Conversely, the slowest single month of the year, typically falling within the low season, marks the market's lowest point. In this month, revenue might dip to $678, occupancy could drop to 24.7%, and ADRs may adjust down to $182.
- Understanding both the seasonal averages and these monthly peaks and troughs in revenue, occupancy, and ADR is crucial for maximizing your Airbnb profit potential in Teyran.
Seasonal Strategies for Maximizing Profit
- Peak Season: Maximize revenue through premium pricing and potentially longer minimum stays. Ensure high availability.
- Low Season: Offer competitive pricing, special promotions (e.g., extended stay discounts), and flexible cancellation policies. Target off-season travelers like remote workers or budget-conscious guests.
- Shoulder Seasons: Implement dynamic pricing that balances peak and low rates. Target weekend travelers or specific events. Offer slightly more flexible terms than peak season.
- Regularly analyze your own performance against these Teyran seasonality benchmarks and adjust your pricing and availability strategy accordingly.
Best Areas for Airbnb Investment in Teyran (2025)
Exploring the top neighborhoods for short-term rentals in Teyran? This section highlights key areas, outlining why they are attractive for hosts and guests, along with notable local attractions. Consider these locations based on your target guest profile and investment strategy.
| Neighborhood / Area | Why Host Here? (Target Guests & Appeal) | Key Attractions & Landmarks |
|---|---|---|
| Teyran Village Center | Charming village atmosphere with local shops and cafés. Ideal for visitors looking for a peaceful retreat close to Montpellier. | Local Markets, Teyran Church, Nearby vineyards, Walking trails, Cycling routes |
| Montpellier City Center | Vibrant urban hub with rich history, culture, and nightlife. Perfect for travelers wanting to explore a dynamic city environment. | Place de la Comédie, Musée Fabre, Le Polygone shopping center, Jardin des Plantes, Historic architecture |
| Pic St. Loup Region | Renowned for its stunning natural beauty and outdoor activities. Attracts adventure seekers and nature lovers, ideal for eco-tourism. | Hiking trails, Wine tasting tours, Scenic views, Mountain climbing |
| La Pascale Park | A serene park setting perfect for families and relaxation. Great for those looking to unwind in nature while still being close to amenities. | Children's playground, Picnic areas, Walking paths, Event spaces |
| Cave Cooperative des Vignerons | A unique experience for wine lovers to sample and purchase local wines. Attracts tourists interested in gastronomy and local produce. | Wine tasting events, Guided vineyard tours, Wine cellar tours |
| Montpellier Zoo | Popular destination for families and wildlife enthusiasts. Offers educational experiences and close encounters with various species. | Animal exhibits, Children's play area, Picnic spots |
| Stadium de la Mosson | Home to local sporting events and concerts. Attracts sports fans and entertainment seekers. | Football matches, Concerts, Community events |
| Languedoc Vineyards | Famous wine region with beautiful landscapes and cultural heritage. Appeals to wine enthusiasts and those interested in French culture. | Vineyard tours, Wine festivals, Scenic drives, Local gastronomy events |
Understanding Airbnb License Requirements & STR Laws in Teyran (2025)
While Teyran, Occitania, France currently shows low STR regulations, specific Airbnb license requirements might still exist or change. Always verify the latest short term rental regulations and Airbnb license requirements directly with local government authorities for Teyran to ensure full compliance before hosting.
(Source: AirROI data, 2025, finding no licensed listings among those analyzed)
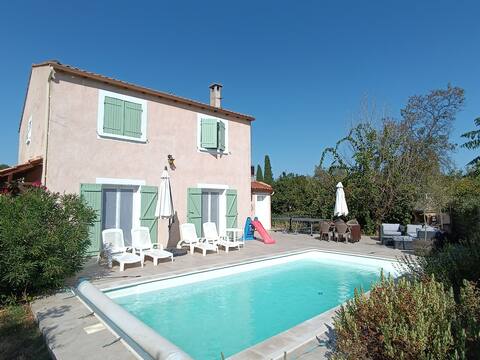
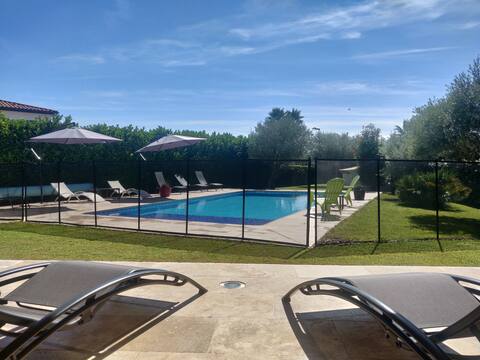
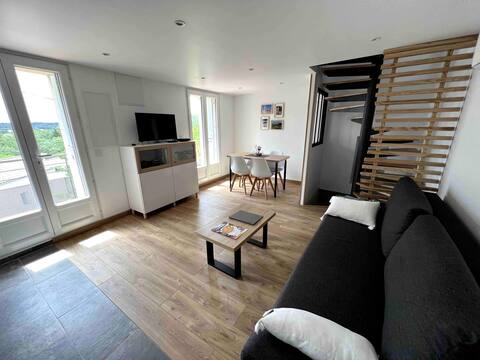
Top Performing Airbnb Properties in Teyran (2025)
Benchmark your potential! Explore examples of top-performing Airbnb properties in Teyranbased on Trailing Twelve Month (TTM) revenue. Analyze their characteristics, revenue, occupancy rate, and ADR to understand what drives success in this market.
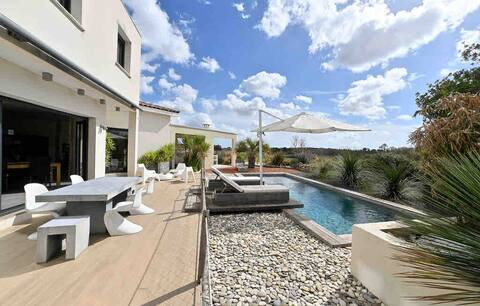
House+pool+bath facing the vines ✨✨✨
Entire Place • 3 bedrooms
Villa avec piscine au calme, entre terre et mer
Entire Place • 4 bedrooms
Stunning comfortable villa with pool
Entire Place • 4 bedrooms
Village house in Teyran
Entire Place • 1 bedroom

Outdoor apartment with wooded exterior
Entire Place • 3 bedrooms
Small quiet house, garrigue and Montpellier sea
Entire Place • 1 bedroom
Note: Performance varies based on location, size, amenities, seasonality, and management quality. Data reflects the past 12 months.
Top Performing Airbnb Hosts in Teyran (2025)
Learn from the best! This table showcases top-performing Airbnb hosts in Teyran based on the number of properties managed and estimated total revenue over the past year. Analyze their scale and performance metrics.
| Host Name | Properties | Grossing Revenue | Stay Reviews | Avg Rating |
|---|---|---|---|---|
| Cissou | 1 | $59,096 | 12 | 4.92/5.0 |
| Host #3182837 | 1 | $29,619 | 7 | 4.71/5.0 |
| Pierre Et Betty | 1 | $27,209 | 6 | 5.00/5.0 |
| Christelle | 1 | $24,932 | 33 | 4.94/5.0 |
| Bruno | 1 | $22,005 | 100 | 4.99/5.0 |
| Fanny | 2 | $21,019 | 12 | 2.42/5.0 |
| Stéphanie | 1 | $20,539 | 117 | 4.91/5.0 |
| Armelle | 2 | $20,323 | 17 | 2.47/5.0 |
| Host #464013578 | 1 | $17,535 | 0 | 0.00/5.0 |
| Gabrielle Cloé Flora | 1 | $17,231 | 26 | 4.81/5.0 |
Analyzing the strategies of top hosts, such as their property selection, pricing, and guest communication, can offer valuable lessons for optimizing your own Airbnb operations in Teyran.
Dive Deeper: Advanced Teyran STR Market Data (2025)
Ready to unlock more insights? AirROI provides access to advanced metrics and comprehensive Airbnb data for Teyran. Explore detailed analytics beyond this report to refine your investment strategy, optimize pricing, and maximize your vacation rental profits.
Explore Advanced MetricsTeyran Short-Term Rental Market Composition (2025): Property & Room Types
Room Type Distribution
Property Type Distribution
Market Composition Insights for Teyran
- The Teyran Airbnb market composition is heavily skewed towards Entire Home/Apt listings, which make up 93.5% of the 31 active rentals. This indicates strong guest preference for privacy and space.
- Looking at the property type distribution in Teyran, House properties are the most common (67.7%), reflecting the local real estate landscape.
- Houses represent a significant 67.7% portion, catering likely to families or larger groups.
Teyran Airbnb Room Capacity Analysis (2025): Bedroom Distribution
Distribution of Listings by Number of Bedrooms
Room Capacity Insights for Teyran
- The dominant room capacity in Teyran is 1 bedroom listings, making up 32.3% of the market. This suggests a strong demand for properties suitable for couples or solo travelers.
- Together, 1 bedroom and 4 bedrooms properties represent 51.7% of the active Airbnb listings in Teyran, indicating a high concentration in these sizes.
- A significant 48.4% of listings offer 3+ bedrooms, catering to larger groups and families seeking more space in Teyran.
Teyran Vacation Rental Guest Capacity Trends (2025)
Distribution of Listings by Guest Capacity
Guest Capacity Insights for Teyran
- The most common guest capacity trend in Teyran vacation rentals is listings accommodating 8+ guests (32.3%). This suggests the primary traveler segment is likely larger groups.
- Properties designed for 8+ guests and 4 guests dominate the Teyran STR market, accounting for 51.7% of listings.
- 48.4% of properties accommodate 6+ guests, serving the market segment for larger families or group travel in Teyran.
- On average, properties in Teyran are equipped to host 5.2 guests.
Teyran Airbnb Booking Patterns (2025): Available vs. Booked Days
Available Days Distribution
Booked Days Distribution
Booking Pattern Insights for Teyran
- The most common availability pattern in Teyran falls within the 271-366 days range, representing 51.6% of listings. This suggests many properties have significant open periods on their calendars.
- Approximately 80.6% of listings show high availability (181+ days open annually), indicating potential for increased bookings or specific owner usage patterns.
- For booked days, the 31-90 days range is most frequent in Teyran (32.3%), reflecting common guest stay durations or potential owner blocking patterns.
- A notable 25.8% of properties secure long booking periods (181+ days booked per year), highlighting successful long-term rental strategies or significant owner usage.
Teyran Airbnb Minimum Stay Requirements Analysis
Distribution of Listings by Minimum Night Requirement
1 Night
2 listings
7.1% of total
2 Nights
13 listings
46.4% of total
3 Nights
3 listings
10.7% of total
4-6 Nights
5 listings
17.9% of total
7-29 Nights
3 listings
10.7% of total
30+ Nights
2 listings
7.1% of total
Key Insights
- The most prevalent minimum stay requirement in Teyran is 2 Nights, adopted by 46.4% of listings. This highlights the market's preference for shorter, flexible bookings.
Recommendations
- Align with the market by considering a 2 Nights minimum stay, as 46.4% of Teyran hosts use this setting.
- If feasible, allowing 1-night stays, especially midweek or during low season, could capture last-minute bookings, as only 7.1% currently do.
- A 2-night minimum appears standard (46.4%). Consider this for weekends or peak periods.
- Explore offering discounts for stays of 30+ nights to attract the 7.1% of the market seeking extended stays.
- Adjust minimum nights based on seasonality – potentially shorter during low season and longer during peak demand periods in Teyran.
Teyran Airbnb Cancellation Policy Trends Analysis (2025)
Flexible
6 listings
27.3% of total
Moderate
6 listings
27.3% of total
Firm
5 listings
22.7% of total
Strict
5 listings
22.7% of total
Cancellation Policy Insights for Teyran
- The prevailing Airbnb cancellation policy trend in Teyran is Flexible, used by 27.3% of listings.
- There's a relatively balanced mix between guest-friendly (54.6%) and stricter (45.4%) policies, offering choices for different guest needs.
Recommendations for Hosts
- Consider adopting a Flexible policy to align with the 27.3% market standard in Teyran.
- Regularly review your cancellation policy against competitors and market demand shifts in Teyran.
Teyran STR Booking Lead Time Analysis (2025)
Average Booking Lead Time by Month
Booking Lead Time Insights for Teyran
- The overall average booking lead time for vacation rentals in Teyran is 40 days.
- Guests book furthest in advance for stays during July (average 82 days), likely coinciding with peak travel demand or local events.
- The shortest booking windows occur for stays in March (average 15 days), indicating more last-minute travel plans during this time.
- Seasonally, Summer (67 days avg.) sees the longest lead times, while Winter (23 days avg.) has the shortest, reflecting typical travel planning cycles.
Recommendations for Hosts
- Use the overall average lead time (40 days) as a baseline for your pricing and availability strategy in Teyran.
- For July stays, consider implementing length-of-stay discounts or slightly higher rates for bookings made less than 82 days out to capitalize on advance planning.
- Target marketing efforts for the Summer season well in advance (at least 67 days) to capture early planners.
- Monitor your own booking lead times against these Teyran averages to identify opportunities for dynamic pricing adjustments.
Popular & Essential Airbnb Amenities in Teyran (2025)
Amenity Prevalence
Amenity Insights for Teyran
- Essential amenities in Teyran that guests expect include: Hot water, Free parking on premises, Coffee maker, Heating, Wifi. Lacking these (any) could significantly impact bookings.
- Popular amenities like Microwave, Refrigerator, Kitchen are common but not universal. Offering these can provide a competitive edge.
Recommendations for Hosts
- Ensure your listing includes all essential amenities for Teyran: Hot water, Free parking on premises, Coffee maker, Heating, Wifi.
- Prioritize adding missing essentials: Free parking on premises, Coffee maker, Heating, Wifi.
- Consider adding popular differentiators like Microwave or Refrigerator to increase appeal.
- Highlight unique or less common amenities you offer (e.g., hot tub, dedicated workspace, EV charger) in your listing description and photos.
- Regularly check competitor amenities in Teyran to stay competitive.
Teyran Airbnb Guest Demographics & Profile Analysis (2025)
Guest Profile Summary for Teyran
- The typical guest profile for Airbnb in Teyran consists of primarily domestic travelers (87%), often arriving from nearby Toulouse, typically belonging to the Post-2000s (Gen Z/Alpha) group (50%), primarily speaking French or English.
- Domestic travelers account for 86.7% of guests.
- Key international markets include France (86.7%) and United Kingdom (2.2%).
- Top languages spoken are French (49.4%) followed by English (32.1%).
- A significant demographic segment is the Post-2000s (Gen Z/Alpha) group, representing 50% of guests.
Recommendations for Hosts
- Target domestic marketing efforts towards travelers from Toulouse and Paris.
- Tailor amenities and listing descriptions to appeal to the dominant Post-2000s (Gen Z/Alpha) demographic (e.g., highlight fast WiFi, smart home features, local guides).
- Highlight unique local experiences or amenities relevant to the primary guest profile.
- Consider seasonal promotions aligned with peak travel times for key origin markets.
Nearby Short-Term Rental Market Comparison
How does the Teyran Airbnb market stack up against its neighbors? Compare key performance metrics like average monthly revenue, ADR, and occupancy rates in surrounding areas to understand the broader regional STR landscape.
| Market | Active Properties | Monthly Revenue | Daily Rate | Avg. Occupancy |
|---|---|---|---|---|
| Cornellà del Terri | 17 | $4,960 | $460.96 | 41% |
| Amer | 10 | $4,848 | $397.58 | 40% |
| Porqueres | 12 | $4,714 | $469.05 | 36% |
| Villeneuvette | 13 | $4,150 | $337.56 | 44% |
| Divajeu | 19 | $3,941 | $410.65 | 42% |
| Bordils | 11 | $3,557 | $525.15 | 36% |
| Vilademuls | 20 | $3,489 | $328.54 | 36% |
| Vilanant | 10 | $3,424 | $343.93 | 34% |
| Bàscara | 13 | $3,317 | $437.52 | 39% |
| Castelnou | 12 | $3,274 | $302.12 | 31% |