Tarbes Airbnb Market Analysis 2025: Short Term Rental Data & Vacation Rental Statistics in Occitania, France
Is Airbnb profitable in Tarbes in 2025? Explore comprehensive Airbnb analytics for Tarbes, Occitania, France to uncover income potential. This 2025 STR market report for Tarbes, based on AirROI data from April 2024 to March 2025, reveals key trends in the market of 298 active listings.
Whether you're considering an Airbnb investment in Tarbes, optimizing your existing vacation rental, or exploring rental arbitrage opportunities, understanding the Tarbes Airbnb data is crucial. Leveraging the low regulation environment is key to maximizing your short term rental income potential. Let's dive into the specifics.
Key Tarbes Airbnb Performance Metrics Overview
Monthly Airbnb Revenue Variations & Income Potential in Tarbes (2025)
Understanding the monthly revenue variations for Airbnb listings in Tarbes is key to maximizing your short term rental income potential. Seasonality significantly impacts earnings. Our analysis, based on data from the past 12 months, shows that the peak revenue month for STRs in Tarbes is typically August, while February often presents the lowest earnings, highlighting opportunities for strategic pricing adjustments during shoulder and low seasons. Explore the typical Airbnb income in Tarbes across different performance tiers:
- Best-in-class properties (Top 10%) achieve $1,788+ monthly, often utilizing dynamic pricing and superior guest experiences.
- Strong performing properties (Top 25%) earn $1,252 or more, indicating effective management and desirable locations/amenities.
- Typical properties (Median) generate around $733 per month, representing the average market performance.
- Entry-level properties (Bottom 25%) see earnings around $341, often with potential for optimization.
Average Monthly Airbnb Earnings Trend in Tarbes
Tarbes Airbnb Occupancy Rate Trends (2025)
Maximize your bookings by understanding the Tarbes STR occupancy trends. Seasonal demand shifts significantly influence how often properties are booked. Typically, Augustsees the highest demand (peak season occupancy), while April experiences the lowest (low season). Effective strategies, like adjusting minimum stays or offering promotions, can boost occupancy during slower periods. Here's how different property tiers perform in Tarbes:
- Best-in-class properties (Top 10%) achieve 82%+ occupancy, indicating high desirability and potentially optimized availability.
- Strong performing properties (Top 25%) maintain 65% or higher occupancy, suggesting good market fit and guest satisfaction.
- Typical properties (Median) have an occupancy rate around 39%.
- Entry-level properties (Bottom 25%) average 19% occupancy, potentially facing higher vacancy.
Average Monthly Occupancy Rate Trend in Tarbes
Average Daily Rate (ADR) Airbnb Trends in Tarbes (2025)
Effective short term rental pricing strategy in Tarbes involves understanding monthly ADR fluctuations. The Average Daily Rate (ADR) for Airbnb in Tarbes typically peaks in August and dips lowest during February. Leveraging Airbnb dynamic pricing tools or strategies based on this seasonality can significantly boost revenue. Here's a look at the typical nightly rates achieved:
- Best-in-class properties (Top 10%) command rates of $98+ per night, often due to premium features or locations.
- Strong performing properties (Top 25%) achieve nightly rates of $70 or more.
- Typical properties (Median) charge around $53 per night.
- Entry-level properties (Bottom 25%) earn around $38 per night.
Average Daily Rate (ADR) Trend by Month in Tarbes
Get Live Tarbes Market Intelligence 👇

Explore Real-time Analytics
Airbnb Seasonality Analysis & Trends in Tarbes (2025)
Peak Season (August, June, May)
- Revenue averages $1,132 per month
- Occupancy rates average 43.5%
- Daily rates average $62
Shoulder Season
- Revenue averages $864 per month
- Occupancy maintains around 43.3%
- Daily rates hold near $61
Low Season (February, March, November)
- Revenue drops to average $688 per month
- Occupancy decreases to average 40.1%
- Daily rates adjust to average $60
Seasonality Insights for Tarbes
- The Airbnb seasonality in Tarbes shows moderate seasonality with distinct peak and low periods. While the sections above show seasonal averages, it's also insightful to look at the extremes:
- During the high season, the absolute peak month showcases Tarbes's highest earning potential, with monthly revenues capable of climbing to $1,153, occupancy reaching a high of 55.5%, and ADRs peaking at $63.
- Conversely, the slowest single month of the year, typically falling within the low season, marks the market's lowest point. In this month, revenue might dip to $670, occupancy could drop to 34.1%, and ADRs may adjust down to $60.
- Understanding both the seasonal averages and these monthly peaks and troughs in revenue, occupancy, and ADR is crucial for maximizing your Airbnb profit potential in Tarbes.
Seasonal Strategies for Maximizing Profit
- Peak Season: Maximize revenue through premium pricing and potentially longer minimum stays. Ensure high availability.
- Low Season: Offer competitive pricing, special promotions (e.g., extended stay discounts), and flexible cancellation policies. Target off-season travelers like remote workers or budget-conscious guests.
- Shoulder Seasons: Implement dynamic pricing that balances peak and low rates. Target weekend travelers or specific events. Offer slightly more flexible terms than peak season.
- Regularly analyze your own performance against these Tarbes seasonality benchmarks and adjust your pricing and availability strategy accordingly.
Best Areas for Airbnb Investment in Tarbes (2025)
Exploring the top neighborhoods for short-term rentals in Tarbes? This section highlights key areas, outlining why they are attractive for hosts and guests, along with notable local attractions. Consider these locations based on your target guest profile and investment strategy.
| Neighborhood / Area | Why Host Here? (Target Guests & Appeal) | Key Attractions & Landmarks |
|---|---|---|
| Centre-ville de Tarbes | The heart of Tarbes with a mix of historical architecture and modern amenities. Attracts tourists interested in local culture and conveniences, making it ideal for short-term rentals. | Place de Verdun, Tarbes Cathedral, Jardin Massey, The Haras, Musee Massey, Les Halles de Tarbes |
| Quartier de la Gespe | A residential area close to parks and recreational spaces, popular for families and outdoor enthusiasts. Great for hosting stays that offer a quieter environment while still being near the city center. | Parc de la Gespe, Cycling paths, Local markets, Access to the Adour river, Nearby hiking trails |
| Stade de Tarbes | Home to the local rugby team, this area attracts sports fans and visitors during major events. Investments in this area can be lucrative during the sports season. | Stade Maurice-Trélut, Rugby matches, Local sports events, Nearby eateries, Community events |
| Lannemezan | A charming town near Tarbes known for its scenic views and outdoor activities. Great for Airbnb hosting for those seeking a getaway closer to nature. | Pic du Midi, Hiking trails, Local festivals, Château de Lannemezan |
| Barbazan | A picturesque village about 30 minutes from Tarbes, known for its historical sites and beautiful landscapes, perfect for quiet retreats. | Saint-Jean-Baptiste Church, Historical buildings, Village markets, Access to the Pyrenees |
| Orleix | A suburban area with easy access to Tarbes and surrounding nature, it offers a friendly environment for families and tourists looking for comfort. | Local parks, Community events, Market days, Cycling routes |
| Bagnères-de-Bigorre | A popular spa town located near Tarbes, renowned for its thermal baths and proximity to the ski resorts of the Pyrenees, a year-round destination for tourists. | Thermal baths, Ski resorts, Local festivals, Historical attractions |
| Vic-en-Bigorre | A quaint and charming town with rich history, attracting visitors looking for local culture and hospitality, making it suitable for Airbnb experiences. | Historical architecture, Local artisan shops, Cultural events, Festivals and fairs |
Understanding Airbnb License Requirements & STR Laws in Tarbes (2025)
While Tarbes, Occitania, France currently shows low STR regulations, specific Airbnb license requirements might still exist or change. Always verify the latest short term rental regulations and Airbnb license requirements directly with local government authorities for Tarbes to ensure full compliance before hosting.
(Source: AirROI data, 2025, based on 3% licensed listings)
Top Performing Airbnb Properties in Tarbes (2025)
Benchmark your potential! Explore examples of top-performing Airbnb properties in Tarbesbased on Trailing Twelve Month (TTM) revenue. Analyze their characteristics, revenue, occupancy rate, and ADR to understand what drives success in this market.
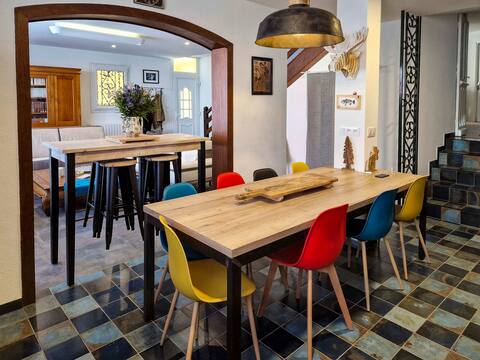
Townhouse 3* 6 bedrooms and 4 bathrooms
Entire Place • 6 bedrooms
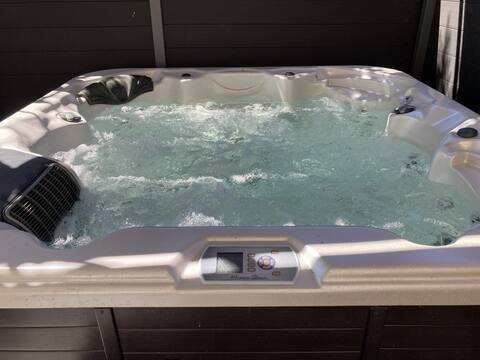
La Pépite: spa and terrace (6 to 12 people)
Entire Place • 2 bedrooms
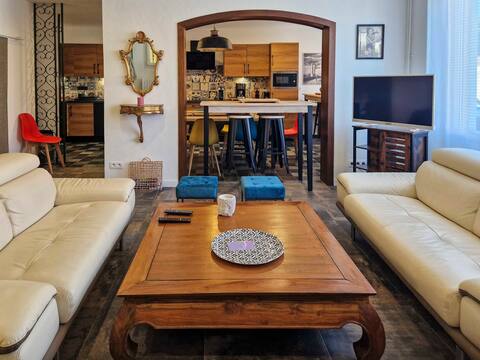
In the city Renovated house 7 bedrooms 5 bathrooms
Entire Place • 7 bedrooms
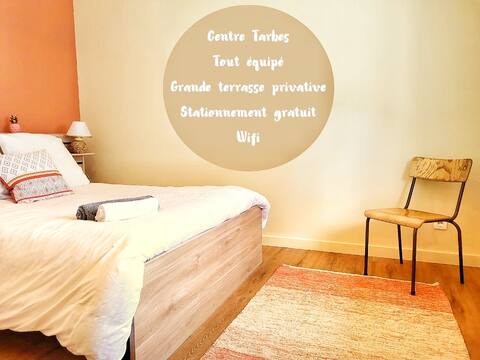
Le Tarbais, Cozy Terrace, Centre, Free Parking
Entire Place • 1 bedroom
Down Town Tarbes ★ Elegant flat ★ 4 bedrooms 8 p
Entire Place • 4 bedrooms
90m2 apt, on the 1st floor of a house
Entire Place • 2 bedrooms
Note: Performance varies based on location, size, amenities, seasonality, and management quality. Data reflects the past 12 months.
Top Performing Airbnb Hosts in Tarbes (2025)
Learn from the best! This table showcases top-performing Airbnb hosts in Tarbes based on the number of properties managed and estimated total revenue over the past year. Analyze their scale and performance metrics.
| Host Name | Properties | Grossing Revenue | Stay Reviews | Avg Rating |
|---|---|---|---|---|
| Camille | 17 | $205,482 | 494 | 4.37/5.0 |
| Eric | 6 | $74,088 | 232 | 4.63/5.0 |
| Patrick | 2 | $54,638 | 26 | 5.00/5.0 |
| Ben | 4 | $44,702 | 597 | 4.76/5.0 |
| Aurelia | 3 | $38,863 | 64 | 4.70/5.0 |
| Camille | 2 | $36,039 | 185 | 4.87/5.0 |
| Dylan | 3 | $35,519 | 38 | 4.73/5.0 |
| Yves | 7 | $35,411 | 42 | 4.68/5.0 |
| Eric | 2 | $31,952 | 133 | 4.78/5.0 |
| Valentine | 2 | $31,128 | 137 | 4.97/5.0 |
Analyzing the strategies of top hosts, such as their property selection, pricing, and guest communication, can offer valuable lessons for optimizing your own Airbnb operations in Tarbes.
Dive Deeper: Advanced Tarbes STR Market Data (2025)
Ready to unlock more insights? AirROI provides access to advanced metrics and comprehensive Airbnb data for Tarbes. Explore detailed analytics beyond this report to refine your investment strategy, optimize pricing, and maximize your vacation rental profits.
Explore Advanced MetricsTarbes Short-Term Rental Market Composition (2025): Property & Room Types
Room Type Distribution
Property Type Distribution
Market Composition Insights for Tarbes
- The Tarbes Airbnb market composition is heavily skewed towards Entire Home/Apt listings, which make up 80.9% of the 298 active rentals. This indicates strong guest preference for privacy and space.
- Looking at the property type distribution in Tarbes, Apartment/Condo properties are the most common (77.5%), reflecting the local real estate landscape.
- Houses represent a significant 17.4% portion, catering likely to families or larger groups.
- Smaller segments like hotel/boutique, others (combined 5.0%) offer potential for unique stay experiences.
Tarbes Airbnb Room Capacity Analysis (2025): Bedroom Distribution
Distribution of Listings by Number of Bedrooms
Room Capacity Insights for Tarbes
- The dominant room capacity in Tarbes is 1 bedroom listings, making up 45.6% of the market. This suggests a strong demand for properties suitable for couples or solo travelers.
- Together, 1 bedroom and 2 bedrooms properties represent 69.4% of the active Airbnb listings in Tarbes, indicating a high concentration in these sizes.
Tarbes Vacation Rental Guest Capacity Trends (2025)
Distribution of Listings by Guest Capacity
Guest Capacity Insights for Tarbes
- The most common guest capacity trend in Tarbes vacation rentals is listings accommodating 2 guests (32.6%). This suggests the primary traveler segment is likely couples or solo travelers.
- Properties designed for 2 guests and 4 guests dominate the Tarbes STR market, accounting for 61.5% of listings.
- 14.1% of properties accommodate 6+ guests, serving the market segment for larger families or group travel in Tarbes.
- On average, properties in Tarbes are equipped to host 3.0 guests.
Tarbes Airbnb Booking Patterns (2025): Available vs. Booked Days
Available Days Distribution
Booked Days Distribution
Booking Pattern Insights for Tarbes
- The most common availability pattern in Tarbes falls within the 271-366 days range, representing 48.7% of listings. This suggests many properties have significant open periods on their calendars.
- Approximately 75.2% of listings show high availability (181+ days open annually), indicating potential for increased bookings or specific owner usage patterns.
- For booked days, the 91-180 days range is most frequent in Tarbes (28.5%), reflecting common guest stay durations or potential owner blocking patterns.
- A notable 24.8% of properties secure long booking periods (181+ days booked per year), highlighting successful long-term rental strategies or significant owner usage.
Tarbes Airbnb Minimum Stay Requirements Analysis
Distribution of Listings by Minimum Night Requirement
1 Night
92 listings
37.6% of total
2 Nights
91 listings
37.1% of total
3 Nights
22 listings
9% of total
4-6 Nights
18 listings
7.3% of total
7-29 Nights
2 listings
0.8% of total
30+ Nights
20 listings
8.2% of total
Key Insights
- The most prevalent minimum stay requirement in Tarbes is 1 Night, adopted by 37.6% of listings. This highlights the market's preference for shorter, flexible bookings.
- A strong majority (74.7%) of the Tarbes Airbnb data shows acceptance of very short stays (1-2 nights), indicating a dynamic, high-turnover market.
Recommendations
- Align with the market by considering a 1 Night minimum stay, as 37.6% of Tarbes hosts use this setting.
- Explore offering discounts for stays of 30+ nights to attract the 8.2% of the market seeking extended stays.
- Adjust minimum nights based on seasonality – potentially shorter during low season and longer during peak demand periods in Tarbes.
Tarbes Airbnb Cancellation Policy Trends Analysis (2025)
Non-refundable
2 listings
0.8% of total
Refundable
4 listings
1.7% of total
Flexible
111 listings
46.8% of total
Moderate
64 listings
27% of total
Firm
28 listings
11.8% of total
Strict
28 listings
11.8% of total
Cancellation Policy Insights for Tarbes
- The prevailing Airbnb cancellation policy trend in Tarbes is Flexible, used by 46.8% of listings.
- The market strongly favors guest-friendly terms, with 73.8% of listings offering Flexible or Moderate policies. This suggests guests in Tarbes may expect booking flexibility.
Recommendations for Hosts
- Consider adopting a Flexible policy to align with the 46.8% market standard in Tarbes.
- Using a Strict policy might deter some guests, as only 11.8% of listings use it. Evaluate if potential revenue protection outweighs possible lower booking rates.
- Regularly review your cancellation policy against competitors and market demand shifts in Tarbes.
Tarbes STR Booking Lead Time Analysis (2025)
Average Booking Lead Time by Month
Booking Lead Time Insights for Tarbes
- The overall average booking lead time for vacation rentals in Tarbes is 36 days.
- Guests book furthest in advance for stays during August (average 72 days), likely coinciding with peak travel demand or local events.
- The shortest booking windows occur for stays in February (average 25 days), indicating more last-minute travel plans during this time.
- Seasonally, Summer (52 days avg.) sees the longest lead times, while Winter (29 days avg.) has the shortest, reflecting typical travel planning cycles.
Recommendations for Hosts
- Use the overall average lead time (36 days) as a baseline for your pricing and availability strategy in Tarbes.
- For August stays, consider implementing length-of-stay discounts or slightly higher rates for bookings made less than 72 days out to capitalize on advance planning.
- Target marketing efforts for the Summer season well in advance (at least 52 days) to capture early planners.
- Monitor your own booking lead times against these Tarbes averages to identify opportunities for dynamic pricing adjustments.
Popular & Essential Airbnb Amenities in Tarbes (2025)
Amenity Prevalence
Amenity Insights for Tarbes
- Essential amenities in Tarbes that guests expect include: Heating. Lacking these (this) could significantly impact bookings.
- Popular amenities like Wifi, Hot water, TV are common but not universal. Offering these can provide a competitive edge.
- Warning: Wifi is not universally provided but is considered essential globally. Ensure reliable Wifi is offered.
Recommendations for Hosts
- Ensure your listing includes all essential amenities for Tarbes: Heating.
- Prioritize adding missing essentials: Heating.
- Consider adding popular differentiators like Wifi or Hot water to increase appeal.
- Highlight unique or less common amenities you offer (e.g., hot tub, dedicated workspace, EV charger) in your listing description and photos.
- Regularly check competitor amenities in Tarbes to stay competitive.
Tarbes Airbnb Guest Demographics & Profile Analysis (2025)
Guest Profile Summary for Tarbes
- The typical guest profile for Airbnb in Tarbes consists of primarily domestic travelers (85%), often arriving from nearby Toulouse, typically belonging to the Post-2000s (Gen Z/Alpha) group (50%), primarily speaking French or English.
- Domestic travelers account for 84.8% of guests.
- Key international markets include France (84.8%) and Spain (5.1%).
- Top languages spoken are French (44.1%) followed by English (29.3%).
- A significant demographic segment is the Post-2000s (Gen Z/Alpha) group, representing 50% of guests.
Recommendations for Hosts
- Target domestic marketing efforts towards travelers from Toulouse and Paris.
- Tailor amenities and listing descriptions to appeal to the dominant Post-2000s (Gen Z/Alpha) demographic (e.g., highlight fast WiFi, smart home features, local guides).
- Highlight unique local experiences or amenities relevant to the primary guest profile.
- Consider seasonal promotions aligned with peak travel times for key origin markets.
Nearby Short-Term Rental Market Comparison
How does the Tarbes Airbnb market stack up against its neighbors? Compare key performance metrics like average monthly revenue, ADR, and occupancy rates in surrounding areas to understand the broader regional STR landscape.
| Market | Active Properties | Monthly Revenue | Daily Rate | Avg. Occupancy |
|---|---|---|---|---|
| la Baronia de Rialb | 14 | $4,296 | $393.88 | 43% |
| Saint-Laurent-des-Combes | 11 | $3,526 | $706.18 | 23% |
| Astaffort | 10 | $3,393 | $314.20 | 35% |
| Coll de Nargó | 14 | $2,843 | $254.89 | 37% |
| les Escaldes | 30 | $2,832 | $230.13 | 43% |
| Andorra la Vella | 43 | $2,776 | $189.18 | 43% |
| Cénac | 18 | $2,773 | $268.58 | 53% |
| Cérons | 11 | $2,635 | $196.16 | 39% |
| Galgon | 12 | $2,599 | $210.34 | 48% |
| Eynesse | 14 | $2,564 | $282.87 | 36% |