Saint-Nazaire Airbnb Market Analysis 2025: Short Term Rental Data & Vacation Rental Statistics in Occitania, France
Is Airbnb profitable in Saint-Nazaire in 2025? Explore comprehensive Airbnb analytics for Saint-Nazaire, Occitania, France to uncover income potential. This 2025 STR market report for Saint-Nazaire, based on AirROI data from April 2024 to March 2025, reveals key trends in the niche market of 53 active listings.
Whether you're considering an Airbnb investment in Saint-Nazaire, optimizing your existing vacation rental, or exploring rental arbitrage opportunities, understanding the Saint-Nazaire Airbnb data is crucial. Understanding the local regulations is key to maximizing your short term rental income potential. Let's dive into the specifics.
Key Saint-Nazaire Airbnb Performance Metrics Overview
Monthly Airbnb Revenue Variations & Income Potential in Saint-Nazaire (2025)
Understanding the monthly revenue variations for Airbnb listings in Saint-Nazaire is key to maximizing your short term rental income potential. Seasonality significantly impacts earnings. Our analysis, based on data from the past 12 months, shows that the peak revenue month for STRs in Saint-Nazaire is typically August, while January often presents the lowest earnings, highlighting opportunities for strategic pricing adjustments during shoulder and low seasons. Explore the typical Airbnb income in Saint-Nazaire across different performance tiers:
- Best-in-class properties (Top 10%) achieve $3,359+ monthly, often utilizing dynamic pricing and superior guest experiences.
- Strong performing properties (Top 25%) earn $1,750 or more, indicating effective management and desirable locations/amenities.
- Typical properties (Median) generate around $904 per month, representing the average market performance.
- Entry-level properties (Bottom 25%) see earnings around $565, often with potential for optimization.
Average Monthly Airbnb Earnings Trend in Saint-Nazaire
Saint-Nazaire Airbnb Occupancy Rate Trends (2025)
Maximize your bookings by understanding the Saint-Nazaire STR occupancy trends. Seasonal demand shifts significantly influence how often properties are booked. Typically, Augustsees the highest demand (peak season occupancy), while January experiences the lowest (low season). Effective strategies, like adjusting minimum stays or offering promotions, can boost occupancy during slower periods. Here's how different property tiers perform in Saint-Nazaire:
- Best-in-class properties (Top 10%) achieve 65%+ occupancy, indicating high desirability and potentially optimized availability.
- Strong performing properties (Top 25%) maintain 46% or higher occupancy, suggesting good market fit and guest satisfaction.
- Typical properties (Median) have an occupancy rate around 29%.
- Entry-level properties (Bottom 25%) average 15% occupancy, potentially facing higher vacancy.
Average Monthly Occupancy Rate Trend in Saint-Nazaire
Average Daily Rate (ADR) Airbnb Trends in Saint-Nazaire (2025)
Effective short term rental pricing strategy in Saint-Nazaire involves understanding monthly ADR fluctuations. The Average Daily Rate (ADR) for Airbnb in Saint-Nazaire typically peaks in August and dips lowest during October. Leveraging Airbnb dynamic pricing tools or strategies based on this seasonality can significantly boost revenue. Here's a look at the typical nightly rates achieved:
- Best-in-class properties (Top 10%) command rates of $225+ per night, often due to premium features or locations.
- Strong performing properties (Top 25%) achieve nightly rates of $155 or more.
- Typical properties (Median) charge around $105 per night.
- Entry-level properties (Bottom 25%) earn around $66 per night.
Average Daily Rate (ADR) Trend by Month in Saint-Nazaire
Get Live Saint-Nazaire Market Intelligence 👇

Explore Real-time Analytics
Airbnb Seasonality Analysis & Trends in Saint-Nazaire (2025)
Peak Season (August, July, May)
- Revenue averages $2,635 per month
- Occupancy rates average 52.5%
- Daily rates average $133
Shoulder Season
- Revenue averages $1,237 per month
- Occupancy maintains around 28.7%
- Daily rates hold near $129
Low Season (January, March, November)
- Revenue drops to average $749 per month
- Occupancy decreases to average 23.3%
- Daily rates adjust to average $131
Seasonality Insights for Saint-Nazaire
- The Airbnb seasonality in Saint-Nazaire shows highly seasonal trends requiring careful strategy. While the sections above show seasonal averages, it's also insightful to look at the extremes:
- During the high season, the absolute peak month showcases Saint-Nazaire's highest earning potential, with monthly revenues capable of climbing to $3,402, occupancy reaching a high of 77.8%, and ADRs peaking at $136.
- Conversely, the slowest single month of the year, typically falling within the low season, marks the market's lowest point. In this month, revenue might dip to $705, occupancy could drop to 20.5%, and ADRs may adjust down to $128.
- Understanding both the seasonal averages and these monthly peaks and troughs in revenue, occupancy, and ADR is crucial for maximizing your Airbnb profit potential in Saint-Nazaire.
Seasonal Strategies for Maximizing Profit
- Peak Season: Maximize revenue through premium pricing and potentially longer minimum stays. Ensure high availability.
- Low Season: Offer competitive pricing, special promotions (e.g., extended stay discounts), and flexible cancellation policies. Target off-season travelers like remote workers or budget-conscious guests.
- Shoulder Seasons: Implement dynamic pricing that balances peak and low rates. Target weekend travelers or specific events. Offer slightly more flexible terms than peak season.
- Regularly analyze your own performance against these Saint-Nazaire seasonality benchmarks and adjust your pricing and availability strategy accordingly.
Best Areas for Airbnb Investment in Saint-Nazaire (2025)
Exploring the top neighborhoods for short-term rentals in Saint-Nazaire? This section highlights key areas, outlining why they are attractive for hosts and guests, along with notable local attractions. Consider these locations based on your target guest profile and investment strategy.
| Neighborhood / Area | Why Host Here? (Target Guests & Appeal) | Key Attractions & Landmarks |
|---|---|---|
| La Baule | Popular seaside resort known for its stunning beach and vibrant atmosphere. A prime location for tourists looking for beach activities and relaxation. | La Baule Beach, Casino de La Baule, Thalassotherapy centers, La Baule-Escoublac, Pine forest of La Baule |
| Saint-Nazaire City Center | The cultural heart of Saint-Nazaire with shops, restaurants, and historical sites. Attracts visitors seeking urban experiences and local culture. | Escal'Atlantic, The U Boat Pens, Saint-Nazaire Maritime Museum, Les Chantiers de l'Atlantique, Saint-Nazaire Cathedral |
| Pornichet | Charming coastal town adjacent to Saint-Nazaire, known for its beautiful beaches and relaxed atmosphere. Great for families and beach lovers. | Pornichet Beach, Casino de Pornichet, Thalasso resort, Sentier des Douaniers, Port de Pornichet |
| Saint-Brévin-les-Pins | Family-friendly destination with sandy beaches and a laid-back vibe. Ideal for vacationers looking for a peaceful seaside retreat. | Saint-Brévin Beach, La Brière Regional Natural Park, Turtle Nature Reserve, Les Marais de la Roche |
| La Turballe | Known for its fishing port and fresh seafood, this area is perfect for those seeking an authentic coastal experience away from the crowds. | La Turballe Beach, Port de La Turballe, Les Viviers de La Turballe, Historic fishing village |
| Le Pouliguen | Quaint harbor town with scenic views and various water sports. Attracts tourists looking for outdoor activities and natural beauty. | Plage du Nau, Le Pouliguen Harbour, Water sports centers, Nature trails |
| Guérande | Historic medieval town famous for its salt marshes and beautiful architecture. Ideal for tourists interested in history and local culture. | Guérande Salt Marshes, Medieval City of Guérande, Chapelle Notre-Dame-la-Blanche, Église Saint-Aubin |
| Batz-sur-Mer | Island feel with stunning coastal scenery and rich natural resources. Popular with those seeking outdoor adventures and tranquility. | Batz-sur-Mer Beaches, Salt Marshes, The Wild Coast, Historic sites and lighthouses |
Understanding Airbnb License Requirements & STR Laws in Saint-Nazaire (2025)
With 15% of listings showing registration in 2025, understanding potential Airbnb license requirements is crucial in Saint-Nazaire. Always verify the latest short term rental regulations and Airbnb license requirements directly with local government authorities for Saint-Nazaire to ensure full compliance before hosting.
(Source: AirROI data, 2025, based on 15% licensed listings)
Top Performing Airbnb Properties in Saint-Nazaire (2025)
Benchmark your potential! Explore examples of top-performing Airbnb properties in Saint-Nazairebased on Trailing Twelve Month (TTM) revenue. Analyze their characteristics, revenue, occupancy rate, and ADR to understand what drives success in this market.

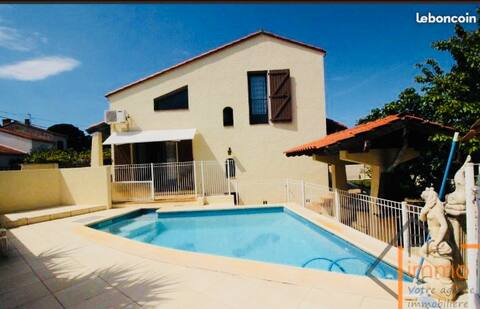
Luxury villa with pool - spa - panoramic view
Entire Place • 4 bedrooms
Big Warm House for Winter with Parking
Entire Place • 4 bedrooms
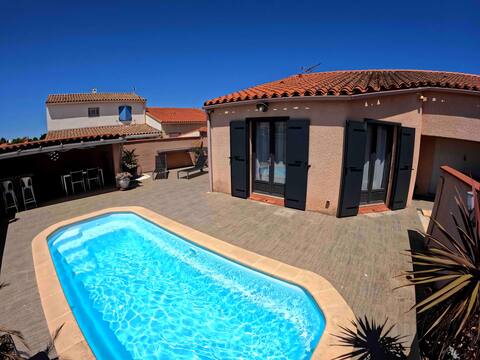
Single storey family home with a pool
Entire Place • 3 bedrooms

Architect village house in Saint Nazaire
Entire Place • 3 bedrooms

Charming 150 m2 Provencal farmhouse with pool
Entire Place • 3 bedrooms
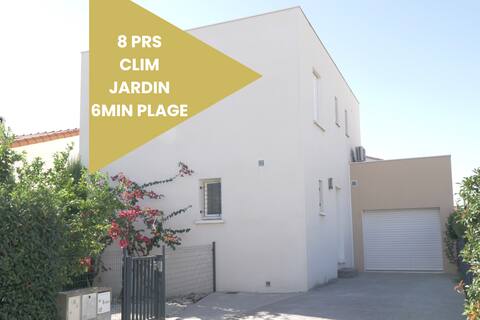
Pleasant house 10km from the beaches (14 pers.)
Entire Place • 5 bedrooms
Note: Performance varies based on location, size, amenities, seasonality, and management quality. Data reflects the past 12 months.
Top Performing Airbnb Hosts in Saint-Nazaire (2025)
Learn from the best! This table showcases top-performing Airbnb hosts in Saint-Nazaire based on the number of properties managed and estimated total revenue over the past year. Analyze their scale and performance metrics.
| Host Name | Properties | Grossing Revenue | Stay Reviews | Avg Rating |
|---|---|---|---|---|
| Mickael | 1 | $94,827 | 6 | 4.83/5.0 |
| Géraud | 6 | $51,870 | 53 | 4.31/5.0 |
| Pascal | 1 | $30,811 | 10 | 4.70/5.0 |
| Anthony | 1 | $28,273 | 12 | 4.92/5.0 |
| Pauline | 2 | $26,899 | 63 | 4.79/5.0 |
| Emmanuel | 3 | $26,737 | 170 | 4.85/5.0 |
| Manon | 1 | $25,317 | 42 | 4.71/5.0 |
| Sophie | 1 | $25,090 | 25 | 4.80/5.0 |
| Nicolas | 1 | $21,108 | 12 | 4.75/5.0 |
| Céline Et Frédéric | 1 | $18,256 | 37 | 4.84/5.0 |
Analyzing the strategies of top hosts, such as their property selection, pricing, and guest communication, can offer valuable lessons for optimizing your own Airbnb operations in Saint-Nazaire.
Dive Deeper: Advanced Saint-Nazaire STR Market Data (2025)
Ready to unlock more insights? AirROI provides access to advanced metrics and comprehensive Airbnb data for Saint-Nazaire. Explore detailed analytics beyond this report to refine your investment strategy, optimize pricing, and maximize your vacation rental profits.
Explore Advanced MetricsSaint-Nazaire Short-Term Rental Market Composition (2025): Property & Room Types
Room Type Distribution
Property Type Distribution
Market Composition Insights for Saint-Nazaire
- The Saint-Nazaire Airbnb market composition is heavily skewed towards Entire Home/Apt listings, which make up 88.7% of the 53 active rentals. This indicates strong guest preference for privacy and space.
- Looking at the property type distribution in Saint-Nazaire, House properties are the most common (67.9%), reflecting the local real estate landscape.
- Houses represent a significant 67.9% portion, catering likely to families or larger groups.
- The presence of 9.4% Hotel/Boutique listings indicates integration with traditional hospitality.
- Smaller segments like outdoor/unique, others (combined 5.7%) offer potential for unique stay experiences.
Saint-Nazaire Airbnb Room Capacity Analysis (2025): Bedroom Distribution
Distribution of Listings by Number of Bedrooms
Room Capacity Insights for Saint-Nazaire
- The dominant room capacity in Saint-Nazaire is 2 bedrooms listings, making up 30.2% of the market. This suggests a strong demand for properties suitable for couples or solo travelers.
- Together, 2 bedrooms and 1 bedroom properties represent 56.6% of the active Airbnb listings in Saint-Nazaire, indicating a high concentration in these sizes.
- A significant 35.9% of listings offer 3+ bedrooms, catering to larger groups and families seeking more space in Saint-Nazaire.
Saint-Nazaire Vacation Rental Guest Capacity Trends (2025)
Distribution of Listings by Guest Capacity
Guest Capacity Insights for Saint-Nazaire
- The most common guest capacity trend in Saint-Nazaire vacation rentals is listings accommodating 4 guests (24.5%). This suggests the primary traveler segment is likely small families or groups.
- Properties designed for 4 guests and 6 guests dominate the Saint-Nazaire STR market, accounting for 43.4% of listings.
- 35.9% of properties accommodate 6+ guests, serving the market segment for larger families or group travel in Saint-Nazaire.
- On average, properties in Saint-Nazaire are equipped to host 4.6 guests.
Saint-Nazaire Airbnb Booking Patterns (2025): Available vs. Booked Days
Available Days Distribution
Booked Days Distribution
Booking Pattern Insights for Saint-Nazaire
- The most common availability pattern in Saint-Nazaire falls within the 271-366 days range, representing 56.6% of listings. This suggests many properties have significant open periods on their calendars.
- Approximately 94.3% of listings show high availability (181+ days open annually), indicating potential for increased bookings or specific owner usage patterns.
- For booked days, the 91-180 days range is most frequent in Saint-Nazaire (39.6%), reflecting common guest stay durations or potential owner blocking patterns.
- A notable 5.7% of properties secure long booking periods (181+ days booked per year), highlighting successful long-term rental strategies or significant owner usage.
Saint-Nazaire Airbnb Minimum Stay Requirements Analysis
Distribution of Listings by Minimum Night Requirement
1 Night
14 listings
27.5% of total
2 Nights
13 listings
25.5% of total
3 Nights
4 listings
7.8% of total
4-6 Nights
7 listings
13.7% of total
7-29 Nights
10 listings
19.6% of total
30+ Nights
3 listings
5.9% of total
Key Insights
- The most prevalent minimum stay requirement in Saint-Nazaire is 1 Night, adopted by 27.5% of listings. This highlights the market's preference for shorter, flexible bookings.
Recommendations
- Align with the market by considering a 1 Night minimum stay, as 27.5% of Saint-Nazaire hosts use this setting.
- If feasible, allowing 1-night stays, especially midweek or during low season, could capture last-minute bookings, as only 27.5% currently do.
- Explore offering discounts for stays of 30+ nights to attract the 5.9% of the market seeking extended stays.
- Adjust minimum nights based on seasonality – potentially shorter during low season and longer during peak demand periods in Saint-Nazaire.
Saint-Nazaire Airbnb Cancellation Policy Trends Analysis (2025)
Super Strict 30 Days
6 listings
12.2% of total
Flexible
11 listings
22.4% of total
Moderate
11 listings
22.4% of total
Firm
10 listings
20.4% of total
Strict
11 listings
22.4% of total
Cancellation Policy Insights for Saint-Nazaire
- The prevailing Airbnb cancellation policy trend in Saint-Nazaire is Flexible, used by 22.4% of listings.
- There's a relatively balanced mix between guest-friendly (44.8%) and stricter (42.8%) policies, offering choices for different guest needs.
Recommendations for Hosts
- Consider adopting a Flexible policy to align with the 22.4% market standard in Saint-Nazaire.
- Regularly review your cancellation policy against competitors and market demand shifts in Saint-Nazaire.
Saint-Nazaire STR Booking Lead Time Analysis (2025)
Average Booking Lead Time by Month
Booking Lead Time Insights for Saint-Nazaire
- The overall average booking lead time for vacation rentals in Saint-Nazaire is 74 days.
- Guests book furthest in advance for stays during June (average 130 days), likely coinciding with peak travel demand or local events.
- The shortest booking windows occur for stays in December (average 25 days), indicating more last-minute travel plans during this time.
- Seasonally, Summer (98 days avg.) sees the longest lead times, while Winter (36 days avg.) has the shortest, reflecting typical travel planning cycles.
Recommendations for Hosts
- Use the overall average lead time (74 days) as a baseline for your pricing and availability strategy in Saint-Nazaire.
- For June stays, consider implementing length-of-stay discounts or slightly higher rates for bookings made less than 130 days out to capitalize on advance planning.
- Target marketing efforts for the Summer season well in advance (at least 98 days) to capture early planners.
- Monitor your own booking lead times against these Saint-Nazaire averages to identify opportunities for dynamic pricing adjustments.
Popular & Essential Airbnb Amenities in Saint-Nazaire (2025)
Amenity Prevalence
Amenity Insights for Saint-Nazaire
- Essential amenities in Saint-Nazaire that guests expect include: Free parking on premises. Lacking these (this) could significantly impact bookings.
- Popular amenities like Hot water, Heating, Kitchen are common but not universal. Offering these can provide a competitive edge.
- Warning: Wifi is not universally provided but is considered essential globally. Ensure reliable Wifi is offered.
Recommendations for Hosts
- Ensure your listing includes all essential amenities for Saint-Nazaire: Free parking on premises.
- Prioritize adding missing essentials: Free parking on premises.
- Consider adding popular differentiators like Hot water or Heating to increase appeal.
- Highlight unique or less common amenities you offer (e.g., hot tub, dedicated workspace, EV charger) in your listing description and photos.
- Regularly check competitor amenities in Saint-Nazaire to stay competitive.
Saint-Nazaire Airbnb Guest Demographics & Profile Analysis (2025)
Guest Profile Summary for Saint-Nazaire
- The typical guest profile for Airbnb in Saint-Nazaire consists of primarily domestic travelers (73%), often arriving from nearby Toulouse, typically belonging to the Post-2000s (Gen Z/Alpha) group (50%), primarily speaking French or English.
- Domestic travelers account for 73.1% of guests.
- Key international markets include France (73.1%) and Spain (7.6%).
- Top languages spoken are French (38.2%) followed by English (28%).
- A significant demographic segment is the Post-2000s (Gen Z/Alpha) group, representing 50% of guests.
Recommendations for Hosts
- Target domestic marketing efforts towards travelers from Toulouse and Barcelona.
- Tailor amenities and listing descriptions to appeal to the dominant Post-2000s (Gen Z/Alpha) demographic (e.g., highlight fast WiFi, smart home features, local guides).
- Highlight unique local experiences or amenities relevant to the primary guest profile.
- Consider seasonal promotions aligned with peak travel times for key origin markets.
Nearby Short-Term Rental Market Comparison
How does the Saint-Nazaire Airbnb market stack up against its neighbors? Compare key performance metrics like average monthly revenue, ADR, and occupancy rates in surrounding areas to understand the broader regional STR landscape.
| Market | Active Properties | Monthly Revenue | Daily Rate | Avg. Occupancy |
|---|---|---|---|---|
| Cornellà del Terri | 17 | $4,960 | $460.96 | 41% |
| Amer | 10 | $4,848 | $397.58 | 40% |
| Porqueres | 12 | $4,714 | $469.05 | 36% |
| Villeneuvette | 13 | $4,150 | $337.56 | 44% |
| Divajeu | 19 | $3,941 | $410.65 | 42% |
| Bordils | 11 | $3,557 | $525.15 | 36% |
| Vilademuls | 20 | $3,489 | $328.54 | 36% |
| Vilanant | 10 | $3,424 | $343.93 | 34% |
| Bàscara | 13 | $3,317 | $437.52 | 39% |
| Castelnou | 12 | $3,274 | $302.12 | 31% |