Saint-Jean-du-Gard Airbnb Market Analysis 2025: Short Term Rental Data & Vacation Rental Statistics in Occitania, France
Is Airbnb profitable in Saint-Jean-du-Gard in 2025? Explore comprehensive Airbnb analytics for Saint-Jean-du-Gard, Occitania, France to uncover income potential. This 2025 STR market report for Saint-Jean-du-Gard, based on AirROI data from April 2024 to March 2025, reveals key trends in the niche market of 74 active listings.
Whether you're considering an Airbnb investment in Saint-Jean-du-Gard, optimizing your existing vacation rental, or exploring rental arbitrage opportunities, understanding the Saint-Jean-du-Gard Airbnb data is crucial. Leveraging the low regulation environment is key to maximizing your short term rental income potential. Let's dive into the specifics.
Key Saint-Jean-du-Gard Airbnb Performance Metrics Overview
Monthly Airbnb Revenue Variations & Income Potential in Saint-Jean-du-Gard (2025)
Understanding the monthly revenue variations for Airbnb listings in Saint-Jean-du-Gard is key to maximizing your short term rental income potential. Seasonality significantly impacts earnings. Our analysis, based on data from the past 12 months, shows that the peak revenue month for STRs in Saint-Jean-du-Gard is typically August, while March often presents the lowest earnings, highlighting opportunities for strategic pricing adjustments during shoulder and low seasons. Explore the typical Airbnb income in Saint-Jean-du-Gard across different performance tiers:
- Best-in-class properties (Top 10%) achieve $3,468+ monthly, often utilizing dynamic pricing and superior guest experiences.
- Strong performing properties (Top 25%) earn $1,993 or more, indicating effective management and desirable locations/amenities.
- Typical properties (Median) generate around $1,039 per month, representing the average market performance.
- Entry-level properties (Bottom 25%) see earnings around $588, often with potential for optimization.
Average Monthly Airbnb Earnings Trend in Saint-Jean-du-Gard
Saint-Jean-du-Gard Airbnb Occupancy Rate Trends (2025)
Maximize your bookings by understanding the Saint-Jean-du-Gard STR occupancy trends. Seasonal demand shifts significantly influence how often properties are booked. Typically, Augustsees the highest demand (peak season occupancy), while January experiences the lowest (low season). Effective strategies, like adjusting minimum stays or offering promotions, can boost occupancy during slower periods. Here's how different property tiers perform in Saint-Jean-du-Gard:
- Best-in-class properties (Top 10%) achieve 66%+ occupancy, indicating high desirability and potentially optimized availability.
- Strong performing properties (Top 25%) maintain 47% or higher occupancy, suggesting good market fit and guest satisfaction.
- Typical properties (Median) have an occupancy rate around 31%.
- Entry-level properties (Bottom 25%) average 17% occupancy, potentially facing higher vacancy.
Average Monthly Occupancy Rate Trend in Saint-Jean-du-Gard
Average Daily Rate (ADR) Airbnb Trends in Saint-Jean-du-Gard (2025)
Effective short term rental pricing strategy in Saint-Jean-du-Gard involves understanding monthly ADR fluctuations. The Average Daily Rate (ADR) for Airbnb in Saint-Jean-du-Gard typically peaks in July and dips lowest during March. Leveraging Airbnb dynamic pricing tools or strategies based on this seasonality can significantly boost revenue. Here's a look at the typical nightly rates achieved:
- Best-in-class properties (Top 10%) command rates of $391+ per night, often due to premium features or locations.
- Strong performing properties (Top 25%) achieve nightly rates of $169 or more.
- Typical properties (Median) charge around $101 per night.
- Entry-level properties (Bottom 25%) earn around $77 per night.
Average Daily Rate (ADR) Trend by Month in Saint-Jean-du-Gard
Get Live Saint-Jean-du-Gard Market Intelligence 👇

Explore Real-time Analytics
Airbnb Seasonality Analysis & Trends in Saint-Jean-du-Gard (2025)
Peak Season (August, July, June)
- Revenue averages $2,726 per month
- Occupancy rates average 50.2%
- Daily rates average $174
Shoulder Season
- Revenue averages $1,423 per month
- Occupancy maintains around 31.3%
- Daily rates hold near $162
Low Season (January, March, December)
- Revenue drops to average $731 per month
- Occupancy decreases to average 21.2%
- Daily rates adjust to average $156
Seasonality Insights for Saint-Jean-du-Gard
- The Airbnb seasonality in Saint-Jean-du-Gard shows highly seasonal trends requiring careful strategy. While the sections above show seasonal averages, it's also insightful to look at the extremes:
- During the high season, the absolute peak month showcases Saint-Jean-du-Gard's highest earning potential, with monthly revenues capable of climbing to $3,282, occupancy reaching a high of 66.0%, and ADRs peaking at $178.
- Conversely, the slowest single month of the year, typically falling within the low season, marks the market's lowest point. In this month, revenue might dip to $575, occupancy could drop to 18.7%, and ADRs may adjust down to $151.
- Understanding both the seasonal averages and these monthly peaks and troughs in revenue, occupancy, and ADR is crucial for maximizing your Airbnb profit potential in Saint-Jean-du-Gard.
Seasonal Strategies for Maximizing Profit
- Peak Season: Maximize revenue through premium pricing and potentially longer minimum stays. Ensure high availability.
- Low Season: Offer competitive pricing, special promotions (e.g., extended stay discounts), and flexible cancellation policies. Target off-season travelers like remote workers or budget-conscious guests.
- Shoulder Seasons: Implement dynamic pricing that balances peak and low rates. Target weekend travelers or specific events. Offer slightly more flexible terms than peak season.
- Regularly analyze your own performance against these Saint-Jean-du-Gard seasonality benchmarks and adjust your pricing and availability strategy accordingly.
Best Areas for Airbnb Investment in Saint-Jean-du-Gard (2025)
Exploring the top neighborhoods for short-term rentals in Saint-Jean-du-Gard? This section highlights key areas, outlining why they are attractive for hosts and guests, along with notable local attractions. Consider these locations based on your target guest profile and investment strategy.
| Neighborhood / Area | Why Host Here? (Target Guests & Appeal) | Key Attractions & Landmarks |
|---|---|---|
| Saint-Jean-du-Gard Old Town | Charming historic center with medieval architecture, attracting tourists interested in history and culture. Close to cafes, shops, and traditional markets. | Saint-Jean-du-Gard Train Station, Eglise Saint-Jean-Baptiste, Musee du Mont Lozere, Market Square, local artisan shops |
| Mont Lozère | Beautiful mountainous area perfect for outdoor enthusiasts. Offers hiking, mountain biking, and nature experiences attracting tourists and adventure seekers. | Mont Lozère, Cevennes National Park, hiking trails, scenic viewpoints, local wildlife |
| Cévennes National Park | Protected natural area with stunning landscapes and rich biodiversity. Ideal for eco-tourism and attracting nature lovers and outdoor adventurers. | Cévennes mountains, fishing spots, local flora and fauna, camping sites, hiking routes |
| Bédouès-Cocurès | Quaint village near Saint-Jean-du-Gard, surrounded by scenic views and nature. Appeals to visitors seeking tranquility and local culture. | Village center, scenic walking paths, local markets, traditional restaurants, artisan workshops |
| Anduze | Nearby town known for its bamboo garden and beautiful architecture. Attracts families and tourists interested in gardening and historic sites. | Bamboo Garden, Anduze train station, Eglise Saint-Étienne, local boutiques, historical buildings |
| Val de Fabras | Quiet area known for its natural beauty and local farms. Ideal for those seeking a peaceful retreat and a touch of rural life. | Local farms, nature paths, hiking trails, scenic viewpoints, peaceful atmosphere |
| Florac | Small town that acts as a gateway to the Cévennes National Park, attracting hikers and nature lovers. | Cévennes National Park entrance, Florac Castle, historical architecture, local shops, café culture |
| Gorges du Tarn | Spectacular natural gorge providing breathtaking views and adventure activities such as kayaking and rock climbing. | Gorges du Tarn, kayaking spots, hiking routes, camping areas, scenic viewpoints |
Understanding Airbnb License Requirements & STR Laws in Saint-Jean-du-Gard (2025)
While Saint-Jean-du-Gard, Occitania, France currently shows low STR regulations, specific Airbnb license requirements might still exist or change. Always verify the latest short term rental regulations and Airbnb license requirements directly with local government authorities for Saint-Jean-du-Gard to ensure full compliance before hosting.
(Source: AirROI data, 2025, based on 5% licensed listings)
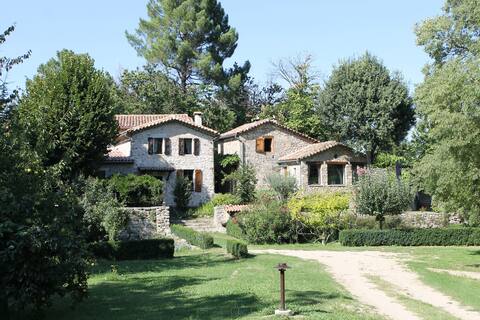
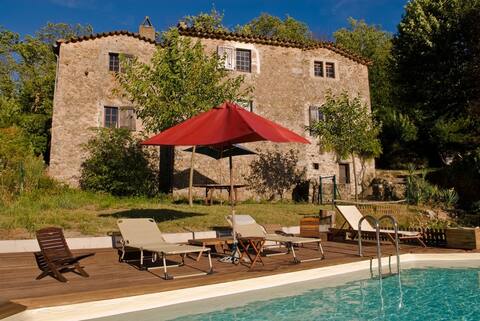
Top Performing Airbnb Properties in Saint-Jean-du-Gard (2025)
Benchmark your potential! Explore examples of top-performing Airbnb properties in Saint-Jean-du-Gardbased on Trailing Twelve Month (TTM) revenue. Analyze their characteristics, revenue, occupancy rate, and ADR to understand what drives success in this market.

EcoVacation at The Farm Le Pouget
Entire Place • 6 bedrooms

Villa Pavloff - South of France
Entire Place • 5 bedrooms
Family farmhouse with pool
Entire Place • 5 bedrooms

Ecovacation - Le Mas du Pouget
Entire Place • 5 bedrooms

Small hamlet - Stunning Cévennes view - Quiet
Entire Place • 7 bedrooms
Mas Cévenol 18th
Entire Place • 5 bedrooms
Note: Performance varies based on location, size, amenities, seasonality, and management quality. Data reflects the past 12 months.
Top Performing Airbnb Hosts in Saint-Jean-du-Gard (2025)
Learn from the best! This table showcases top-performing Airbnb hosts in Saint-Jean-du-Gard based on the number of properties managed and estimated total revenue over the past year. Analyze their scale and performance metrics.
| Host Name | Properties | Grossing Revenue | Stay Reviews | Avg Rating |
|---|---|---|---|---|
| Elaine | 5 | $137,434 | 77 | 3.91/5.0 |
| Annick | 1 | $59,333 | 72 | 4.72/5.0 |
| La Loge Des Cevennes | 3 | $53,941 | 103 | 3.32/5.0 |
| Emeline | 4 | $49,574 | 155 | 4.89/5.0 |
| Kees En Renée | 2 | $49,401 | 166 | 5.00/5.0 |
| Lucien | 2 | $37,141 | 63 | 4.83/5.0 |
| ColetteetBernard | 1 | $34,186 | 3 | 5.00/5.0 |
| Victoire | 1 | $33,730 | 12 | 5.00/5.0 |
| Christine | 3 | $33,615 | 70 | 4.89/5.0 |
| Emery | 1 | $31,399 | 21 | 4.95/5.0 |
Analyzing the strategies of top hosts, such as their property selection, pricing, and guest communication, can offer valuable lessons for optimizing your own Airbnb operations in Saint-Jean-du-Gard.
Dive Deeper: Advanced Saint-Jean-du-Gard STR Market Data (2025)
Ready to unlock more insights? AirROI provides access to advanced metrics and comprehensive Airbnb data for Saint-Jean-du-Gard. Explore detailed analytics beyond this report to refine your investment strategy, optimize pricing, and maximize your vacation rental profits.
Explore Advanced MetricsSaint-Jean-du-Gard Short-Term Rental Market Composition (2025): Property & Room Types
Room Type Distribution
Property Type Distribution
Market Composition Insights for Saint-Jean-du-Gard
- The Saint-Jean-du-Gard Airbnb market composition is heavily skewed towards Entire Home/Apt listings, which make up 87.8% of the 74 active rentals. This indicates strong guest preference for privacy and space.
- Looking at the property type distribution in Saint-Jean-du-Gard, House properties are the most common (47.3%), reflecting the local real estate landscape.
- Houses represent a significant 47.3% portion, catering likely to families or larger groups.
- The presence of 6.8% Hotel/Boutique listings indicates integration with traditional hospitality.
- Smaller segments like unique stays, others (combined 5.4%) offer potential for unique stay experiences.
Saint-Jean-du-Gard Airbnb Room Capacity Analysis (2025): Bedroom Distribution
Distribution of Listings by Number of Bedrooms
Room Capacity Insights for Saint-Jean-du-Gard
- The dominant room capacity in Saint-Jean-du-Gard is 1 bedroom listings, making up 29.7% of the market. This suggests a strong demand for properties suitable for couples or solo travelers.
- Together, 1 bedroom and 2 bedrooms properties represent 58.1% of the active Airbnb listings in Saint-Jean-du-Gard, indicating a high concentration in these sizes.
- A significant 32.5% of listings offer 3+ bedrooms, catering to larger groups and families seeking more space in Saint-Jean-du-Gard.
Saint-Jean-du-Gard Vacation Rental Guest Capacity Trends (2025)
Distribution of Listings by Guest Capacity
Guest Capacity Insights for Saint-Jean-du-Gard
- The most common guest capacity trend in Saint-Jean-du-Gard vacation rentals is listings accommodating 4 guests (24.3%). This suggests the primary traveler segment is likely small families or groups.
- Properties designed for 4 guests and 8+ guests dominate the Saint-Jean-du-Gard STR market, accounting for 45.9% of listings.
- 40.6% of properties accommodate 6+ guests, serving the market segment for larger families or group travel in Saint-Jean-du-Gard.
- On average, properties in Saint-Jean-du-Gard are equipped to host 4.5 guests.
Saint-Jean-du-Gard Airbnb Booking Patterns (2025): Available vs. Booked Days
Available Days Distribution
Booked Days Distribution
Booking Pattern Insights for Saint-Jean-du-Gard
- The most common availability pattern in Saint-Jean-du-Gard falls within the 271-366 days range, representing 59.5% of listings. This suggests many properties have significant open periods on their calendars.
- Approximately 93.3% of listings show high availability (181+ days open annually), indicating potential for increased bookings or specific owner usage patterns.
- For booked days, the 31-90 days range is most frequent in Saint-Jean-du-Gard (47.3%), reflecting common guest stay durations or potential owner blocking patterns.
- A notable 9.5% of properties secure long booking periods (181+ days booked per year), highlighting successful long-term rental strategies or significant owner usage.
Saint-Jean-du-Gard Airbnb Minimum Stay Requirements Analysis
Distribution of Listings by Minimum Night Requirement
1 Night
17 listings
26.6% of total
2 Nights
21 listings
32.8% of total
3 Nights
10 listings
15.6% of total
4-6 Nights
5 listings
7.8% of total
7-29 Nights
7 listings
10.9% of total
30+ Nights
4 listings
6.3% of total
Key Insights
- The most prevalent minimum stay requirement in Saint-Jean-du-Gard is 2 Nights, adopted by 32.8% of listings. This highlights the market's preference for shorter, flexible bookings.
Recommendations
- Align with the market by considering a 2 Nights minimum stay, as 32.8% of Saint-Jean-du-Gard hosts use this setting.
- If feasible, allowing 1-night stays, especially midweek or during low season, could capture last-minute bookings, as only 26.6% currently do.
- Explore offering discounts for stays of 30+ nights to attract the 6.3% of the market seeking extended stays.
- Adjust minimum nights based on seasonality – potentially shorter during low season and longer during peak demand periods in Saint-Jean-du-Gard.
Saint-Jean-du-Gard Airbnb Cancellation Policy Trends Analysis (2025)
Super Strict 60 Days
1 listings
1.6% of total
Flexible
14 listings
22.2% of total
Moderate
9 listings
14.3% of total
Firm
12 listings
19% of total
Strict
27 listings
42.9% of total
Cancellation Policy Insights for Saint-Jean-du-Gard
- The prevailing Airbnb cancellation policy trend in Saint-Jean-du-Gard is Strict, used by 42.9% of listings.
- A majority (61.9%) of hosts in Saint-Jean-du-Gard utilize Firm or Strict policies, indicating a market where hosts prioritize booking security.
Recommendations for Hosts
- Consider adopting a Strict policy to align with the 42.9% market standard in Saint-Jean-du-Gard.
- With 42.9% using Strict terms, this is a viable option in Saint-Jean-du-Gard, particularly for high-value properties or during peak demand periods.
- Regularly review your cancellation policy against competitors and market demand shifts in Saint-Jean-du-Gard.
Saint-Jean-du-Gard STR Booking Lead Time Analysis (2025)
Average Booking Lead Time by Month
Booking Lead Time Insights for Saint-Jean-du-Gard
- The overall average booking lead time for vacation rentals in Saint-Jean-du-Gard is 62 days.
- Guests book furthest in advance for stays during July (average 109 days), likely coinciding with peak travel demand or local events.
- The shortest booking windows occur for stays in November (average 17 days), indicating more last-minute travel plans during this time.
- Seasonally, Summer (87 days avg.) sees the longest lead times, while Fall (38 days avg.) has the shortest, reflecting typical travel planning cycles.
Recommendations for Hosts
- Use the overall average lead time (62 days) as a baseline for your pricing and availability strategy in Saint-Jean-du-Gard.
- For July stays, consider implementing length-of-stay discounts or slightly higher rates for bookings made less than 109 days out to capitalize on advance planning.
- Target marketing efforts for the Summer season well in advance (at least 87 days) to capture early planners.
- Monitor your own booking lead times against these Saint-Jean-du-Gard averages to identify opportunities for dynamic pricing adjustments.
Popular & Essential Airbnb Amenities in Saint-Jean-du-Gard (2025)
Amenity Prevalence
Amenity Insights for Saint-Jean-du-Gard
- Popular amenities like Dishes and silverware, Hot water, Kitchen are common but not universal. Offering these can provide a competitive edge.
Recommendations for Hosts
- Consider adding popular differentiators like Dishes and silverware or Hot water to increase appeal.
- Highlight unique or less common amenities you offer (e.g., hot tub, dedicated workspace, EV charger) in your listing description and photos.
- Regularly check competitor amenities in Saint-Jean-du-Gard to stay competitive.
Saint-Jean-du-Gard Airbnb Guest Demographics & Profile Analysis (2025)
Guest Profile Summary for Saint-Jean-du-Gard
- The typical guest profile for Airbnb in Saint-Jean-du-Gard consists of primarily domestic travelers (86%), often arriving from nearby Paris, typically belonging to the Post-2000s (Gen Z/Alpha) group (50%), primarily speaking French or English.
- Domestic travelers account for 85.7% of guests.
- Key international markets include France (85.7%) and United Kingdom (3.1%).
- Top languages spoken are French (46.2%) followed by English (33.5%).
- A significant demographic segment is the Post-2000s (Gen Z/Alpha) group, representing 50% of guests.
Recommendations for Hosts
- Target domestic marketing efforts towards travelers from Paris and Montpellier.
- Tailor amenities and listing descriptions to appeal to the dominant Post-2000s (Gen Z/Alpha) demographic (e.g., highlight fast WiFi, smart home features, local guides).
- Highlight unique local experiences or amenities relevant to the primary guest profile.
- Consider seasonal promotions aligned with peak travel times for key origin markets.
Nearby Short-Term Rental Market Comparison
How does the Saint-Jean-du-Gard Airbnb market stack up against its neighbors? Compare key performance metrics like average monthly revenue, ADR, and occupancy rates in surrounding areas to understand the broader regional STR landscape.
| Market | Active Properties | Monthly Revenue | Daily Rate | Avg. Occupancy |
|---|---|---|---|---|
| Villeneuvette | 13 | $4,150 | $337.56 | 44% |
| Divajeu | 19 | $3,941 | $410.65 | 42% |
| Saint-Germain-au-Mont-d'Or | 10 | $3,928 | $316.02 | 40% |
| Dommartin | 11 | $3,905 | $327.00 | 36% |
| Courzieu | 11 | $3,267 | $287.83 | 52% |
| Vanosc | 13 | $3,072 | $224.52 | 44% |
| Redessan | 19 | $2,834 | $334.82 | 34% |
| Fontarèches | 11 | $2,802 | $525.31 | 34% |
| La Bruguière | 14 | $2,732 | $277.64 | 50% |
| Verquières | 13 | $2,688 | $424.97 | 49% |