Saint-Géry-Vers Airbnb Market Analysis 2025: Short Term Rental Data & Vacation Rental Statistics in Occitania, France
Is Airbnb profitable in Saint-Géry-Vers in 2025? Explore comprehensive Airbnb analytics for Saint-Géry-Vers, Occitania, France to uncover income potential. This 2025 STR market report for Saint-Géry-Vers, based on AirROI data from April 2024 to March 2025, reveals key trends in the niche market of 19 active listings.
Whether you're considering an Airbnb investment in Saint-Géry-Vers, optimizing your existing vacation rental, or exploring rental arbitrage opportunities, understanding the Saint-Géry-Vers Airbnb data is crucial. Leveraging the low regulation environment is key to maximizing your short term rental income potential. Let's dive into the specifics.
Key Saint-Géry-Vers Airbnb Performance Metrics Overview
Monthly Airbnb Revenue Variations & Income Potential in Saint-Géry-Vers (2025)
Understanding the monthly revenue variations for Airbnb listings in Saint-Géry-Vers is key to maximizing your short term rental income potential. Seasonality significantly impacts earnings. Our analysis, based on data from the past 12 months, shows that the peak revenue month for STRs in Saint-Géry-Vers is typically August, while February often presents the lowest earnings, highlighting opportunities for strategic pricing adjustments during shoulder and low seasons. Explore the typical Airbnb income in Saint-Géry-Vers across different performance tiers:
- Best-in-class properties (Top 10%) achieve $4,151+ monthly, often utilizing dynamic pricing and superior guest experiences.
- Strong performing properties (Top 25%) earn $2,280 or more, indicating effective management and desirable locations/amenities.
- Typical properties (Median) generate around $1,255 per month, representing the average market performance.
- Entry-level properties (Bottom 25%) see earnings around $704, often with potential for optimization.
Average Monthly Airbnb Earnings Trend in Saint-Géry-Vers
Saint-Géry-Vers Airbnb Occupancy Rate Trends (2025)
Maximize your bookings by understanding the Saint-Géry-Vers STR occupancy trends. Seasonal demand shifts significantly influence how often properties are booked. Typically, Augustsees the highest demand (peak season occupancy), while March experiences the lowest (low season). Effective strategies, like adjusting minimum stays or offering promotions, can boost occupancy during slower periods. Here's how different property tiers perform in Saint-Géry-Vers:
- Best-in-class properties (Top 10%) achieve 67%+ occupancy, indicating high desirability and potentially optimized availability.
- Strong performing properties (Top 25%) maintain 53% or higher occupancy, suggesting good market fit and guest satisfaction.
- Typical properties (Median) have an occupancy rate around 36%.
- Entry-level properties (Bottom 25%) average 22% occupancy, potentially facing higher vacancy.
Average Monthly Occupancy Rate Trend in Saint-Géry-Vers
Average Daily Rate (ADR) Airbnb Trends in Saint-Géry-Vers (2025)
Effective short term rental pricing strategy in Saint-Géry-Vers involves understanding monthly ADR fluctuations. The Average Daily Rate (ADR) for Airbnb in Saint-Géry-Vers typically peaks in July and dips lowest during October. Leveraging Airbnb dynamic pricing tools or strategies based on this seasonality can significantly boost revenue. Here's a look at the typical nightly rates achieved:
- Best-in-class properties (Top 10%) command rates of $494+ per night, often due to premium features or locations.
- Strong performing properties (Top 25%) achieve nightly rates of $207 or more.
- Typical properties (Median) charge around $111 per night.
- Entry-level properties (Bottom 25%) earn around $79 per night.
Average Daily Rate (ADR) Trend by Month in Saint-Géry-Vers
Get Live Saint-Géry-Vers Market Intelligence 👇
Explore Real-time Analytics
Airbnb Seasonality Analysis & Trends in Saint-Géry-Vers (2025)
Peak Season (August, July, October)
- Revenue averages $2,774 per month
- Occupancy rates average 62.7%
- Daily rates average $206
Shoulder Season
- Revenue averages $1,599 per month
- Occupancy maintains around 32.7%
- Daily rates hold near $212
Low Season (February, March, November)
- Revenue drops to average $1,070 per month
- Occupancy decreases to average 27.2%
- Daily rates adjust to average $197
Seasonality Insights for Saint-Géry-Vers
- The Airbnb seasonality in Saint-Géry-Vers shows highly seasonal trends requiring careful strategy. While the sections above show seasonal averages, it's also insightful to look at the extremes:
- During the high season, the absolute peak month showcases Saint-Géry-Vers's highest earning potential, with monthly revenues capable of climbing to $3,080, occupancy reaching a high of 74.9%, and ADRs peaking at $228.
- Conversely, the slowest single month of the year, typically falling within the low season, marks the market's lowest point. In this month, revenue might dip to $899, occupancy could drop to 22.6%, and ADRs may adjust down to $173.
- Understanding both the seasonal averages and these monthly peaks and troughs in revenue, occupancy, and ADR is crucial for maximizing your Airbnb profit potential in Saint-Géry-Vers.
Seasonal Strategies for Maximizing Profit
- Peak Season: Maximize revenue through premium pricing and potentially longer minimum stays. Ensure high availability.
- Low Season: Offer competitive pricing, special promotions (e.g., extended stay discounts), and flexible cancellation policies. Target off-season travelers like remote workers or budget-conscious guests.
- Shoulder Seasons: Implement dynamic pricing that balances peak and low rates. Target weekend travelers or specific events. Offer slightly more flexible terms than peak season.
- Regularly analyze your own performance against these Saint-Géry-Vers seasonality benchmarks and adjust your pricing and availability strategy accordingly.
Best Areas for Airbnb Investment in Saint-Géry-Vers (2025)
Exploring the top neighborhoods for short-term rentals in Saint-Géry-Vers? This section highlights key areas, outlining why they are attractive for hosts and guests, along with notable local attractions. Consider these locations based on your target guest profile and investment strategy.
| Neighborhood / Area | Why Host Here? (Target Guests & Appeal) | Key Attractions & Landmarks |
|---|---|---|
| Saint-Géry-Vers Village | Charming village with medieval architecture, stunning countryside views, and a tranquil atmosphere. Ideal for travelers seeking a peaceful retreat and authentic local culture. | Saint-Géry Church, Medieval streets, Local artisan shops, Crispin Castle, Walking trails in the countryside |
| Vers Pont du Gard | Proximity to the iconic Roman aqueduct, a UNESCO World Heritage site. Perfect for history enthusiasts and tourists looking for an unforgettable experience near ancient ruins. | Pont du Gard, Roman ruins, Ceze River beaches, Walking and biking trails, Local vineyards |
| Cahors | A historic town known for its wine, beautiful medieval architecture, and lively markets. Attracts foodies and culture lovers, making it a great spot for Airbnb hosting. | Cahors Cathedral, Valentre Bridge, Market square, Cahors wine region, Museums and galleries |
| Figeac | Rich in history and the birthplace of Champollion, this town offers beautiful architecture and access to scenic hiking routes. Perfect for cultural tourism and nature lovers. | Champollion Museum, Figeac's old town, Cultural festivals, Lot River views, Hiking trails |
| Rocamadour | Spectacular clifftop village that attracts many pilgrims and tourists. Its breathtaking views and religious significance draw visitors year-round. | Sanctuary of Rocamadour, Clifftop views, Small shops and restaurants, Caves of Rocamadour, Nature trails |
| Gramat | A small town that acts as a gateway to the Parc Animalier de Gramat and offers a quaint countryside experience. Ideal for family vacations and nature escapes. | Parc Animalier de Gramat, Local markets, Walking paths, Nature parks, Historical churches |
| Brive-la-Gaillarde | A regional hub known for its vibrant market and proximity to natural attractions. A good choice for those wanting both city amenities and outdoor adventures. | Brive Market, Historical center, Caves of Lacave, Outdoor cafes, Nearby nature parks |
| Saint-Céré | A lovely town with a rich artistic heritage, hosting theater festivals and charming streets. Attracts cultural tourists looking for experiences off the beaten path. | Chateau de Saint-Céré, Festival of Theatre, Art exhibitions, L'Abbatiale Saint-Pierre, Scenic countryside |
Understanding Airbnb License Requirements & STR Laws in Saint-Géry-Vers (2025)
While Saint-Géry-Vers, Occitania, France currently shows low STR regulations, specific Airbnb license requirements might still exist or change. Always verify the latest short term rental regulations and Airbnb license requirements directly with local government authorities for Saint-Géry-Vers to ensure full compliance before hosting.
(Source: AirROI data, 2025, based on 5% licensed listings)
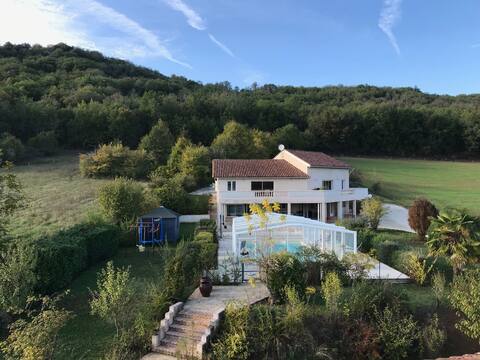
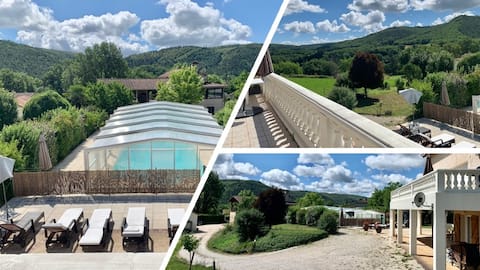
Top Performing Airbnb Properties in Saint-Géry-Vers (2025)
Benchmark your potential! Explore examples of top-performing Airbnb properties in Saint-Géry-Versbased on Trailing Twelve Month (TTM) revenue. Analyze their characteristics, revenue, occupancy rate, and ADR to understand what drives success in this market.
Nest d 'Etoiles + Dream of Butterfly, internal staircase
Entire Place • 7 bedrooms
Under the Stars sleeps 26 & beautiful view
Entire Place • 10 bedrooms

Butterfly Dream, Large and Pool Ground Floor
Entire Place • 4 bedrooms
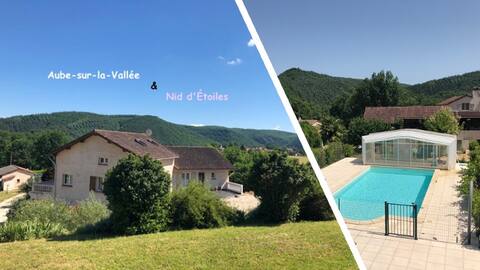
Aube-sur-la-Vallée + Nest d 'Etoiles, beautiful view
Entire Place • 8 bedrooms
Villa d'Olt
Entire Place • 4 bedrooms

2 large equipped cottages, beautiful view 4 bathrooms
Entire Place • 9 bedrooms
Note: Performance varies based on location, size, amenities, seasonality, and management quality. Data reflects the past 12 months.
Top Performing Airbnb Hosts in Saint-Géry-Vers (2025)
Learn from the best! This table showcases top-performing Airbnb hosts in Saint-Géry-Vers based on the number of properties managed and estimated total revenue over the past year. Analyze their scale and performance metrics.
| Host Name | Properties | Grossing Revenue | Stay Reviews | Avg Rating |
|---|---|---|---|---|
| Jeannot | 8 | $189,145 | 228 | 4.73/5.0 |
| Sam | 1 | $22,027 | 16 | 4.88/5.0 |
| Christiane | 1 | $17,528 | 67 | 4.90/5.0 |
| Celine | 1 | $13,912 | 36 | 4.92/5.0 |
| Benoit | 2 | $8,284 | 17 | 4.86/5.0 |
| Pascale & François | 1 | $7,951 | 26 | 4.92/5.0 |
| Sabrina | 1 | $7,902 | 27 | 4.93/5.0 |
| Annie-France | 1 | $6,466 | 125 | 4.88/5.0 |
| Michele | 1 | $4,093 | 19 | 4.42/5.0 |
| Jean Patrick | 1 | $3,731 | 161 | 4.84/5.0 |
Analyzing the strategies of top hosts, such as their property selection, pricing, and guest communication, can offer valuable lessons for optimizing your own Airbnb operations in Saint-Géry-Vers.
Dive Deeper: Advanced Saint-Géry-Vers STR Market Data (2025)
Ready to unlock more insights? AirROI provides access to advanced metrics and comprehensive Airbnb data for Saint-Géry-Vers. Explore detailed analytics beyond this report to refine your investment strategy, optimize pricing, and maximize your vacation rental profits.
Explore Advanced MetricsSaint-Géry-Vers Short-Term Rental Market Composition (2025): Property & Room Types
Room Type Distribution
Property Type Distribution
Market Composition Insights for Saint-Géry-Vers
- The Saint-Géry-Vers Airbnb market composition is heavily skewed towards Entire Home/Apt listings, which make up 78.9% of the 19 active rentals. This indicates strong guest preference for privacy and space.
- Looking at the property type distribution in Saint-Géry-Vers, House properties are the most common (57.9%), reflecting the local real estate landscape.
- Houses represent a significant 57.9% portion, catering likely to families or larger groups.
- The presence of 15.8% Hotel/Boutique listings indicates integration with traditional hospitality.
Saint-Géry-Vers Airbnb Room Capacity Analysis (2025): Bedroom Distribution
Distribution of Listings by Number of Bedrooms
Room Capacity Insights for Saint-Géry-Vers
- The dominant room capacity in Saint-Géry-Vers is 2 bedrooms listings, making up 31.6% of the market. This suggests a strong demand for properties suitable for couples or solo travelers.
- Together, 2 bedrooms and 4 bedrooms properties represent 57.9% of the active Airbnb listings in Saint-Géry-Vers, indicating a high concentration in these sizes.
- A significant 52.7% of listings offer 3+ bedrooms, catering to larger groups and families seeking more space in Saint-Géry-Vers.
Saint-Géry-Vers Vacation Rental Guest Capacity Trends (2025)
Distribution of Listings by Guest Capacity
Guest Capacity Insights for Saint-Géry-Vers
- The most common guest capacity trend in Saint-Géry-Vers vacation rentals is listings accommodating 8+ guests (42.1%). This suggests the primary traveler segment is likely larger groups.
- Properties designed for 8+ guests and 4 guests dominate the Saint-Géry-Vers STR market, accounting for 57.9% of listings.
- 52.7% of properties accommodate 6+ guests, serving the market segment for larger families or group travel in Saint-Géry-Vers.
- On average, properties in Saint-Géry-Vers are equipped to host 5.3 guests.
Saint-Géry-Vers Airbnb Booking Patterns (2025): Available vs. Booked Days
Available Days Distribution
Booked Days Distribution
Booking Pattern Insights for Saint-Géry-Vers
- The most common availability pattern in Saint-Géry-Vers falls within the 181-270 days range, representing 47.4% of listings. This suggests many properties have significant open periods on their calendars.
- Approximately 84.2% of listings show high availability (181+ days open annually), indicating potential for increased bookings or specific owner usage patterns.
- For booked days, the 91-180 days range is most frequent in Saint-Géry-Vers (52.6%), reflecting common guest stay durations or potential owner blocking patterns.
- A notable 15.8% of properties secure long booking periods (181+ days booked per year), highlighting successful long-term rental strategies or significant owner usage.
Saint-Géry-Vers Airbnb Minimum Stay Requirements Analysis
Distribution of Listings by Minimum Night Requirement
1 Night
4 listings
21.1% of total
2 Nights
12 listings
63.2% of total
7-29 Nights
2 listings
10.5% of total
30+ Nights
1 listings
5.3% of total
Key Insights
- The most prevalent minimum stay requirement in Saint-Géry-Vers is 2 Nights, adopted by 63.2% of listings. This highlights the market's preference for shorter, flexible bookings.
- A strong majority (84.3%) of the Saint-Géry-Vers Airbnb data shows acceptance of very short stays (1-2 nights), indicating a dynamic, high-turnover market.
Recommendations
- Align with the market by considering a 2 Nights minimum stay, as 63.2% of Saint-Géry-Vers hosts use this setting.
- If feasible, allowing 1-night stays, especially midweek or during low season, could capture last-minute bookings, as only 21.1% currently do.
- Explore offering discounts for stays of 30+ nights to attract the 5.3% of the market seeking extended stays.
- Adjust minimum nights based on seasonality – potentially shorter during low season and longer during peak demand periods in Saint-Géry-Vers.
Saint-Géry-Vers Airbnb Cancellation Policy Trends Analysis (2025)
Flexible
11 listings
57.9% of total
Moderate
3 listings
15.8% of total
Firm
3 listings
15.8% of total
Strict
2 listings
10.5% of total
Cancellation Policy Insights for Saint-Géry-Vers
- The prevailing Airbnb cancellation policy trend in Saint-Géry-Vers is Flexible, used by 57.9% of listings.
- The market strongly favors guest-friendly terms, with 73.7% of listings offering Flexible or Moderate policies. This suggests guests in Saint-Géry-Vers may expect booking flexibility.
Recommendations for Hosts
- Consider adopting a Flexible policy to align with the 57.9% market standard in Saint-Géry-Vers.
- Given the high prevalence of Flexible policies (57.9%), offering this can enhance booking appeal, especially during shoulder seasons.
- Using a Strict policy might deter some guests, as only 10.5% of listings use it. Evaluate if potential revenue protection outweighs possible lower booking rates.
- Regularly review your cancellation policy against competitors and market demand shifts in Saint-Géry-Vers.
Saint-Géry-Vers STR Booking Lead Time Analysis (2025)
Average Booking Lead Time by Month
Booking Lead Time Insights for Saint-Géry-Vers
- The overall average booking lead time for vacation rentals in Saint-Géry-Vers is 80 days.
- Guests book furthest in advance for stays during July (average 149 days), likely coinciding with peak travel demand or local events.
- The shortest booking windows occur for stays in January (average 34 days), indicating more last-minute travel plans during this time.
- Seasonally, Summer (142 days avg.) sees the longest lead times, while Winter (57 days avg.) has the shortest, reflecting typical travel planning cycles.
Recommendations for Hosts
- Use the overall average lead time (80 days) as a baseline for your pricing and availability strategy in Saint-Géry-Vers.
- For July stays, consider implementing length-of-stay discounts or slightly higher rates for bookings made less than 149 days out to capitalize on advance planning.
- Target marketing efforts for the Summer season well in advance (at least 142 days) to capture early planners.
- Monitor your own booking lead times against these Saint-Géry-Vers averages to identify opportunities for dynamic pricing adjustments.
Popular & Essential Airbnb Amenities in Saint-Géry-Vers (2025)
Amenity Prevalence
Amenity Insights for Saint-Géry-Vers
- Popular amenities like Heating, Free parking on premises, Kitchen are common but not universal. Offering these can provide a competitive edge.
Recommendations for Hosts
- Consider adding popular differentiators like Heating or Free parking on premises to increase appeal.
- Highlight unique or less common amenities you offer (e.g., hot tub, dedicated workspace, EV charger) in your listing description and photos.
- Regularly check competitor amenities in Saint-Géry-Vers to stay competitive.
Saint-Géry-Vers Airbnb Guest Demographics & Profile Analysis (2025)
Guest Profile Summary for Saint-Géry-Vers
- The typical guest profile for Airbnb in Saint-Géry-Vers consists of primarily domestic travelers (87%), often arriving from nearby Toulouse, typically belonging to the Post-2000s (Gen Z/Alpha) group (50%), primarily speaking French or English.
- Domestic travelers account for 87.3% of guests.
- Key international markets include France (87.3%) and United States (3.8%).
- Top languages spoken are French (42.1%) followed by English (36.8%).
- A significant demographic segment is the Post-2000s (Gen Z/Alpha) group, representing 50% of guests.
Recommendations for Hosts
- Target domestic marketing efforts towards travelers from Toulouse and Paris.
- Tailor amenities and listing descriptions to appeal to the dominant Post-2000s (Gen Z/Alpha) demographic (e.g., highlight fast WiFi, smart home features, local guides).
- Highlight unique local experiences or amenities relevant to the primary guest profile.
- Consider seasonal promotions aligned with peak travel times for key origin markets.
Nearby Short-Term Rental Market Comparison
How does the Saint-Géry-Vers Airbnb market stack up against its neighbors? Compare key performance metrics like average monthly revenue, ADR, and occupancy rates in surrounding areas to understand the broader regional STR landscape.
| Market | Active Properties | Monthly Revenue | Daily Rate | Avg. Occupancy |
|---|---|---|---|---|
| Astaffort | 10 | $3,393 | $314.20 | 35% |
| Saint-Pierre-Roche | 11 | $2,627 | $166.21 | 48% |
| Eynesse | 14 | $2,564 | $282.87 | 36% |
| Bourrou | 10 | $2,475 | $247.57 | 36% |
| Saint-Jean-d'Alcapiès | 10 | $2,429 | $169.43 | 43% |
| Jayac | 11 | $2,388 | $202.75 | 40% |
| La Magdelaine-sur-Tarn | 10 | $2,383 | $243.17 | 32% |
| Lanta | 14 | $2,306 | $270.81 | 44% |
| Pont-de-Larn | 17 | $2,254 | $239.90 | 32% |
| Gout-Rossignol | 11 | $2,212 | $251.86 | 38% |