Saint-Brès Airbnb Market Analysis 2025: Short Term Rental Data & Vacation Rental Statistics in Occitania, France
Is Airbnb profitable in Saint-Brès in 2025? Explore comprehensive Airbnb analytics for Saint-Brès, Occitania, France to uncover income potential. This 2025 STR market report for Saint-Brès, based on AirROI data from April 2024 to March 2025, reveals key trends in the niche market of 24 active listings.
Whether you're considering an Airbnb investment in Saint-Brès, optimizing your existing vacation rental, or exploring rental arbitrage opportunities, understanding the Saint-Brès Airbnb data is crucial. Leveraging the low regulation environment is key to maximizing your short term rental income potential. Let's dive into the specifics.
Key Saint-Brès Airbnb Performance Metrics Overview
Monthly Airbnb Revenue Variations & Income Potential in Saint-Brès (2025)
Understanding the monthly revenue variations for Airbnb listings in Saint-Brès is key to maximizing your short term rental income potential. Seasonality significantly impacts earnings. Our analysis, based on data from the past 12 months, shows that the peak revenue month for STRs in Saint-Brès is typically August, while March often presents the lowest earnings, highlighting opportunities for strategic pricing adjustments during shoulder and low seasons. Explore the typical Airbnb income in Saint-Brès across different performance tiers:
- Best-in-class properties (Top 10%) achieve $3,534+ monthly, often utilizing dynamic pricing and superior guest experiences.
- Strong performing properties (Top 25%) earn $1,855 or more, indicating effective management and desirable locations/amenities.
- Typical properties (Median) generate around $900 per month, representing the average market performance.
- Entry-level properties (Bottom 25%) see earnings around $454, often with potential for optimization.
Average Monthly Airbnb Earnings Trend in Saint-Brès
Saint-Brès Airbnb Occupancy Rate Trends (2025)
Maximize your bookings by understanding the Saint-Brès STR occupancy trends. Seasonal demand shifts significantly influence how often properties are booked. Typically, Augustsees the highest demand (peak season occupancy), while January experiences the lowest (low season). Effective strategies, like adjusting minimum stays or offering promotions, can boost occupancy during slower periods. Here's how different property tiers perform in Saint-Brès:
- Best-in-class properties (Top 10%) achieve 69%+ occupancy, indicating high desirability and potentially optimized availability.
- Strong performing properties (Top 25%) maintain 55% or higher occupancy, suggesting good market fit and guest satisfaction.
- Typical properties (Median) have an occupancy rate around 31%.
- Entry-level properties (Bottom 25%) average 13% occupancy, potentially facing higher vacancy.
Average Monthly Occupancy Rate Trend in Saint-Brès
Average Daily Rate (ADR) Airbnb Trends in Saint-Brès (2025)
Effective short term rental pricing strategy in Saint-Brès involves understanding monthly ADR fluctuations. The Average Daily Rate (ADR) for Airbnb in Saint-Brès typically peaks in November and dips lowest during September. Leveraging Airbnb dynamic pricing tools or strategies based on this seasonality can significantly boost revenue. Here's a look at the typical nightly rates achieved:
- Best-in-class properties (Top 10%) command rates of $226+ per night, often due to premium features or locations.
- Strong performing properties (Top 25%) achieve nightly rates of $147 or more.
- Typical properties (Median) charge around $94 per night.
- Entry-level properties (Bottom 25%) earn around $63 per night.
Average Daily Rate (ADR) Trend by Month in Saint-Brès
Get Live Saint-Brès Market Intelligence 👇

Explore Real-time Analytics
Airbnb Seasonality Analysis & Trends in Saint-Brès (2025)
Peak Season (August, July, September)
- Revenue averages $2,421 per month
- Occupancy rates average 57.8%
- Daily rates average $115
Shoulder Season
- Revenue averages $1,224 per month
- Occupancy maintains around 31.6%
- Daily rates hold near $115
Low Season (February, March, November)
- Revenue drops to average $576 per month
- Occupancy decreases to average 24.3%
- Daily rates adjust to average $115
Seasonality Insights for Saint-Brès
- The Airbnb seasonality in Saint-Brès shows highly seasonal trends requiring careful strategy. While the sections above show seasonal averages, it's also insightful to look at the extremes:
- During the high season, the absolute peak month showcases Saint-Brès's highest earning potential, with monthly revenues capable of climbing to $2,721, occupancy reaching a high of 64.2%, and ADRs peaking at $119.
- Conversely, the slowest single month of the year, typically falling within the low season, marks the market's lowest point. In this month, revenue might dip to $503, occupancy could drop to 19.1%, and ADRs may adjust down to $113.
- Understanding both the seasonal averages and these monthly peaks and troughs in revenue, occupancy, and ADR is crucial for maximizing your Airbnb profit potential in Saint-Brès.
Seasonal Strategies for Maximizing Profit
- Peak Season: Maximize revenue through premium pricing and potentially longer minimum stays. Ensure high availability.
- Low Season: Offer competitive pricing, special promotions (e.g., extended stay discounts), and flexible cancellation policies. Target off-season travelers like remote workers or budget-conscious guests.
- Shoulder Seasons: Implement dynamic pricing that balances peak and low rates. Target weekend travelers or specific events. Offer slightly more flexible terms than peak season.
- Regularly analyze your own performance against these Saint-Brès seasonality benchmarks and adjust your pricing and availability strategy accordingly.
Best Areas for Airbnb Investment in Saint-Brès (2025)
Exploring the top neighborhoods for short-term rentals in Saint-Brès? This section highlights key areas, outlining why they are attractive for hosts and guests, along with notable local attractions. Consider these locations based on your target guest profile and investment strategy.
| Neighborhood / Area | Why Host Here? (Target Guests & Appeal) | Key Attractions & Landmarks |
|---|---|---|
| Les Côtes de Saint-Brès | A peaceful residential area near Montpellier, ideal for families and groups seeking a quiet retreat while being close to the city attractions. | Montpellier Zoo, Parc Zoologique de Lunaret, Stade de la Mosson, Jardin des Plantes, Aquarium Mare Nostrum |
| Saint-Brès Village Center | The heart of Saint-Brès, offering charm and local shops. A quaint location where guests can experience authentic French village life. | Église Saint-Brès, Place de la Mairie, local cafés and bistros, provincial markets |
| Montpellier City Center | Just a short distance from Saint-Brès, Montpellier boasts a vibrant student population, historic architecture, and lively nightlife, making it an attractive spot for young travelers. | Place de la Comédie, Le Corum, Montpellier Cathedral, Musee Fabre, Botanical Gardens |
| Castelnau-le-Lez | A neighboring town that offers easy access to Montpellier. Popular for those who want a more suburban feel while still being close to the city’s amenities. | Mas Negre, Parc Jean Córdier, Cinemas and theaters, Shopping centers |
| Lattes | A charming town located close to the coast, ideal for beach lovers and families alike, with attractions suitable for various ages. | Languedoc-Roussillon beaches, Port de Lattes, local vineyards and grape tours, Parc de la Femme |
| Villeneuve-lès-Maguelone | Renowned for its historical sites and proximity to nature, this area is attractive for guests wanting a mix of history and relaxation. | Maguelone Cathedral, Beaches of Maguelone, Nature reserves, Canal du Rhône à Sète |
| Palavas-les-Flots | Famous for its fun beach atmosphere, perfect for summer vacationers, families, and those seeking water activities and vibrant nightlife. | Palavas beach, Luna Park, Fishing port, Casino, Nautical activities |
| Sète | Known for its picturesque canals and vibrant arts scene, Sète is a popular tourist destination with a unique maritime flair, excellent for cultural experiences. | Canal de Sète, Mont Saint-Clair, Musee International des Arts Modestes, Sète beaches, Seafood restaurants |
Understanding Airbnb License Requirements & STR Laws in Saint-Brès (2025)
While Saint-Brès, Occitania, France currently shows low STR regulations, specific Airbnb license requirements might still exist or change. Always verify the latest short term rental regulations and Airbnb license requirements directly with local government authorities for Saint-Brès to ensure full compliance before hosting.
(Source: AirROI data, 2025, finding no licensed listings among those analyzed)
Top Performing Airbnb Properties in Saint-Brès (2025)
Benchmark your potential! Explore examples of top-performing Airbnb properties in Saint-Brèsbased on Trailing Twelve Month (TTM) revenue. Analyze their characteristics, revenue, occupancy rate, and ADR to understand what drives success in this market.

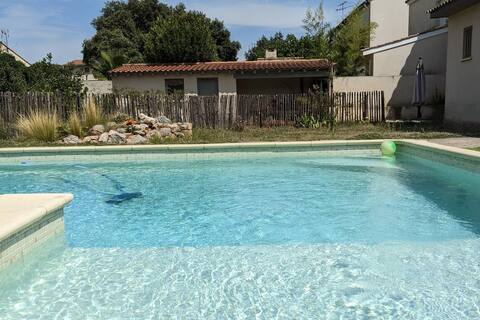
Villa with Pool and Hot Tub
Entire Place • 3 bedrooms
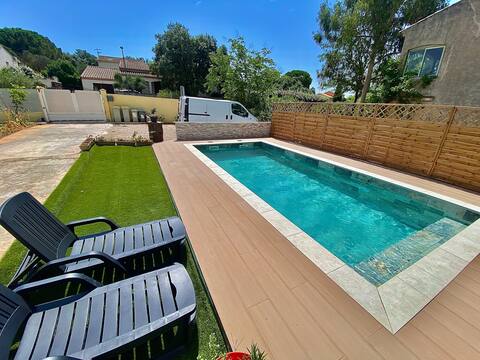
Large bright house with swimming pool
Entire Place • 4 bedrooms
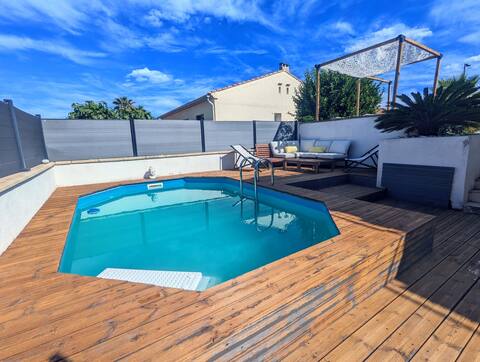
4 rooms with a pool
Entire Place • 2 bedrooms
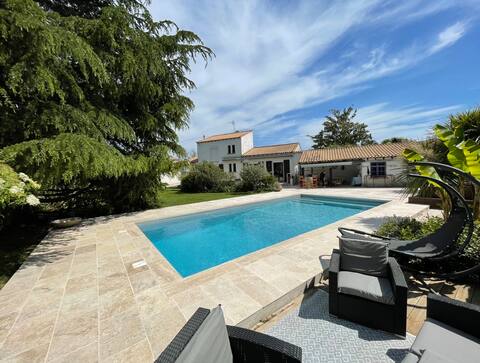
Between Montpellier and Petite Camargue
Entire Place • 2 bedrooms

Le Petit Mas / Gite 7 People
Entire Place • 2 bedrooms
Montpellier, last minute, prix canon 6-13 juillet
Entire Place • 4 bedrooms
Note: Performance varies based on location, size, amenities, seasonality, and management quality. Data reflects the past 12 months.
Top Performing Airbnb Hosts in Saint-Brès (2025)
Learn from the best! This table showcases top-performing Airbnb hosts in Saint-Brès based on the number of properties managed and estimated total revenue over the past year. Analyze their scale and performance metrics.
| Host Name | Properties | Grossing Revenue | Stay Reviews | Avg Rating |
|---|---|---|---|---|
| Celine, Pascal | 2 | $38,528 | 14 | 5.00/5.0 |
| Louison | 1 | $34,701 | 11 | 5.00/5.0 |
| Philippe | 1 | $30,260 | 5 | 5.00/5.0 |
| Kim | 1 | $23,220 | 23 | 5.00/5.0 |
| Marie | 1 | $22,218 | 25 | 5.00/5.0 |
| Host #439044135 | 1 | $21,460 | 0 | 0.00/5.0 |
| Mylene | 1 | $16,028 | 4 | 5.00/5.0 |
| Claude | 1 | $13,634 | 34 | 5.00/5.0 |
| Laura Et Nicolas | 1 | $12,349 | 16 | 4.94/5.0 |
| Pierre | 1 | $11,980 | 219 | 4.80/5.0 |
Analyzing the strategies of top hosts, such as their property selection, pricing, and guest communication, can offer valuable lessons for optimizing your own Airbnb operations in Saint-Brès.
Dive Deeper: Advanced Saint-Brès STR Market Data (2025)
Ready to unlock more insights? AirROI provides access to advanced metrics and comprehensive Airbnb data for Saint-Brès. Explore detailed analytics beyond this report to refine your investment strategy, optimize pricing, and maximize your vacation rental profits.
Explore Advanced MetricsSaint-Brès Short-Term Rental Market Composition (2025): Property & Room Types
Room Type Distribution
Property Type Distribution
Market Composition Insights for Saint-Brès
- The Saint-Brès Airbnb market composition is heavily skewed towards Entire Home/Apt listings, which make up 91.7% of the 24 active rentals. This indicates strong guest preference for privacy and space.
- Looking at the property type distribution in Saint-Brès, House properties are the most common (54.2%), reflecting the local real estate landscape.
- Houses represent a significant 54.2% portion, catering likely to families or larger groups.
- Smaller segments like hotel/boutique (combined 4.2%) offer potential for unique stay experiences.
Saint-Brès Airbnb Room Capacity Analysis (2025): Bedroom Distribution
Distribution of Listings by Number of Bedrooms
Room Capacity Insights for Saint-Brès
- The dominant room capacity in Saint-Brès is 2 bedrooms listings, making up 37.5% of the market. This suggests a strong demand for properties suitable for couples or solo travelers.
- Together, 2 bedrooms and 1 bedroom properties represent 62.5% of the active Airbnb listings in Saint-Brès, indicating a high concentration in these sizes.
- A significant 25.0% of listings offer 3+ bedrooms, catering to larger groups and families seeking more space in Saint-Brès.
Saint-Brès Vacation Rental Guest Capacity Trends (2025)
Distribution of Listings by Guest Capacity
Guest Capacity Insights for Saint-Brès
- The most common guest capacity trend in Saint-Brès vacation rentals is listings accommodating 4 guests (33.3%). This suggests the primary traveler segment is likely small families or groups.
- Properties designed for 4 guests and 8+ guests dominate the Saint-Brès STR market, accounting for 50.0% of listings.
- 33.3% of properties accommodate 6+ guests, serving the market segment for larger families or group travel in Saint-Brès.
- On average, properties in Saint-Brès are equipped to host 4.5 guests.
Saint-Brès Airbnb Booking Patterns (2025): Available vs. Booked Days
Available Days Distribution
Booked Days Distribution
Booking Pattern Insights for Saint-Brès
- The most common availability pattern in Saint-Brès falls within the 271-366 days range, representing 50% of listings. This suggests many properties have significant open periods on their calendars.
- Approximately 83.3% of listings show high availability (181+ days open annually), indicating potential for increased bookings or specific owner usage patterns.
- For booked days, the 91-180 days range is most frequent in Saint-Brès (33.3%), reflecting common guest stay durations or potential owner blocking patterns.
- A notable 16.7% of properties secure long booking periods (181+ days booked per year), highlighting successful long-term rental strategies or significant owner usage.
Saint-Brès Airbnb Minimum Stay Requirements Analysis
Distribution of Listings by Minimum Night Requirement
1 Night
3 listings
13.6% of total
2 Nights
8 listings
36.4% of total
3 Nights
1 listings
4.5% of total
4-6 Nights
5 listings
22.7% of total
7-29 Nights
2 listings
9.1% of total
30+ Nights
3 listings
13.6% of total
Key Insights
- The most prevalent minimum stay requirement in Saint-Brès is 2 Nights, adopted by 36.4% of listings. This highlights the market's preference for shorter, flexible bookings.
- A significant segment (13.6%) caters to monthly stays (30+ nights) in Saint-Brès, pointing to opportunities in the extended-stay market.
Recommendations
- Align with the market by considering a 2 Nights minimum stay, as 36.4% of Saint-Brès hosts use this setting.
- If feasible, allowing 1-night stays, especially midweek or during low season, could capture last-minute bookings, as only 13.6% currently do.
- A 2-night minimum appears standard (36.4%). Consider this for weekends or peak periods.
- Explore offering discounts for stays of 30+ nights to attract the 13.6% of the market seeking extended stays.
- Adjust minimum nights based on seasonality – potentially shorter during low season and longer during peak demand periods in Saint-Brès.
Saint-Brès Airbnb Cancellation Policy Trends Analysis (2025)
Refundable
1 listings
4.8% of total
Flexible
8 listings
38.1% of total
Moderate
4 listings
19% of total
Firm
4 listings
19% of total
Strict
4 listings
19% of total
Cancellation Policy Insights for Saint-Brès
- The prevailing Airbnb cancellation policy trend in Saint-Brès is Flexible, used by 38.1% of listings.
- There's a relatively balanced mix between guest-friendly (57.1%) and stricter (38.0%) policies, offering choices for different guest needs.
Recommendations for Hosts
- Consider adopting a Flexible policy to align with the 38.1% market standard in Saint-Brès.
- Regularly review your cancellation policy against competitors and market demand shifts in Saint-Brès.
Saint-Brès STR Booking Lead Time Analysis (2025)
Average Booking Lead Time by Month
Booking Lead Time Insights for Saint-Brès
- The overall average booking lead time for vacation rentals in Saint-Brès is 33 days.
- Guests book furthest in advance for stays during May (average 81 days), likely coinciding with peak travel demand or local events.
- The shortest booking windows occur for stays in March (average 14 days), indicating more last-minute travel plans during this time.
- Seasonally, Spring (47 days avg.) sees the longest lead times, while Winter (25 days avg.) has the shortest, reflecting typical travel planning cycles.
Recommendations for Hosts
- Use the overall average lead time (33 days) as a baseline for your pricing and availability strategy in Saint-Brès.
- For May stays, consider implementing length-of-stay discounts or slightly higher rates for bookings made less than 81 days out to capitalize on advance planning.
- During March, focus on last-minute booking availability and promotions, as guests book with very short notice (14 days avg.).
- Target marketing efforts for the Spring season well in advance (at least 47 days) to capture early planners.
- Monitor your own booking lead times against these Saint-Brès averages to identify opportunities for dynamic pricing adjustments.
Popular & Essential Airbnb Amenities in Saint-Brès (2025)
Amenity Prevalence
Amenity Insights for Saint-Brès
- Essential amenities in Saint-Brès that guests expect include: Kitchen, Wifi, Heating. Lacking these (any) could significantly impact bookings.
- Popular amenities like TV, Washer, Hangers are common but not universal. Offering these can provide a competitive edge.
Recommendations for Hosts
- Ensure your listing includes all essential amenities for Saint-Brès: Kitchen, Wifi, Heating.
- Prioritize adding missing essentials: Heating.
- Consider adding popular differentiators like TV or Washer to increase appeal.
- Highlight unique or less common amenities you offer (e.g., hot tub, dedicated workspace, EV charger) in your listing description and photos.
- Regularly check competitor amenities in Saint-Brès to stay competitive.
Saint-Brès Airbnb Guest Demographics & Profile Analysis (2025)
Guest Profile Summary for Saint-Brès
- The typical guest profile for Airbnb in Saint-Brès consists of primarily domestic travelers (91%), often arriving from nearby Paris, typically belonging to the Post-2000s (Gen Z/Alpha) group (50%), primarily speaking French or English.
- Domestic travelers account for 90.5% of guests.
- Key international markets include France (90.5%) and Belgium (3.2%).
- Top languages spoken are French (52.5%) followed by English (27.5%).
- A significant demographic segment is the Post-2000s (Gen Z/Alpha) group, representing 50% of guests.
Recommendations for Hosts
- Target domestic marketing efforts towards travelers from Paris and Montpellier.
- Tailor amenities and listing descriptions to appeal to the dominant Post-2000s (Gen Z/Alpha) demographic (e.g., highlight fast WiFi, smart home features, local guides).
- Highlight unique local experiences or amenities relevant to the primary guest profile.
- Consider seasonal promotions aligned with peak travel times for key origin markets.
Nearby Short-Term Rental Market Comparison
How does the Saint-Brès Airbnb market stack up against its neighbors? Compare key performance metrics like average monthly revenue, ADR, and occupancy rates in surrounding areas to understand the broader regional STR landscape.
| Market | Active Properties | Monthly Revenue | Daily Rate | Avg. Occupancy |
|---|---|---|---|---|
| Villeneuvette | 13 | $4,150 | $337.56 | 44% |
| Divajeu | 19 | $3,941 | $410.65 | 42% |
| Chantepérier | 20 | $3,057 | $281.60 | 37% |
| Rupià | 11 | $3,046 | $386.95 | 40% |
| Gordes | 225 | $2,913 | $366.32 | 43% |
| Redessan | 19 | $2,834 | $334.82 | 34% |
| Fontarèches | 11 | $2,802 | $525.31 | 34% |
| Ménerbes | 97 | $2,800 | $453.86 | 41% |
| La Bruguière | 14 | $2,732 | $277.64 | 50% |
| Soyans | 12 | $2,721 | $193.55 | 45% |