Rennes-les-Bains Airbnb Market Analysis 2025: Short Term Rental Data & Vacation Rental Statistics in Occitania, France
Is Airbnb profitable in Rennes-les-Bains in 2025? Explore comprehensive Airbnb analytics for Rennes-les-Bains, Occitania, France to uncover income potential. This 2025 STR market report for Rennes-les-Bains, based on AirROI data from April 2024 to March 2025, reveals key trends in the niche market of 21 active listings.
Whether you're considering an Airbnb investment in Rennes-les-Bains, optimizing your existing vacation rental, or exploring rental arbitrage opportunities, understanding the Rennes-les-Bains Airbnb data is crucial. Leveraging the low regulation environment is key to maximizing your short term rental income potential. Let's dive into the specifics.
Key Rennes-les-Bains Airbnb Performance Metrics Overview
Monthly Airbnb Revenue Variations & Income Potential in Rennes-les-Bains (2025)
Understanding the monthly revenue variations for Airbnb listings in Rennes-les-Bains is key to maximizing your short term rental income potential. Seasonality significantly impacts earnings. Our analysis, based on data from the past 12 months, shows that the peak revenue month for STRs in Rennes-les-Bains is typically May, while February often presents the lowest earnings, highlighting opportunities for strategic pricing adjustments during shoulder and low seasons. Explore the typical Airbnb income in Rennes-les-Bains across different performance tiers:
- Best-in-class properties (Top 10%) achieve $1,500+ monthly, often utilizing dynamic pricing and superior guest experiences.
- Strong performing properties (Top 25%) earn $1,025 or more, indicating effective management and desirable locations/amenities.
- Typical properties (Median) generate around $583 per month, representing the average market performance.
- Entry-level properties (Bottom 25%) see earnings around $289, often with potential for optimization.
Average Monthly Airbnb Earnings Trend in Rennes-les-Bains
Rennes-les-Bains Airbnb Occupancy Rate Trends (2025)
Maximize your bookings by understanding the Rennes-les-Bains STR occupancy trends. Seasonal demand shifts significantly influence how often properties are booked. Typically, Augustsees the highest demand (peak season occupancy), while February experiences the lowest (low season). Effective strategies, like adjusting minimum stays or offering promotions, can boost occupancy during slower periods. Here's how different property tiers perform in Rennes-les-Bains:
- Best-in-class properties (Top 10%) achieve 57%+ occupancy, indicating high desirability and potentially optimized availability.
- Strong performing properties (Top 25%) maintain 43% or higher occupancy, suggesting good market fit and guest satisfaction.
- Typical properties (Median) have an occupancy rate around 26%.
- Entry-level properties (Bottom 25%) average 16% occupancy, potentially facing higher vacancy.
Average Monthly Occupancy Rate Trend in Rennes-les-Bains
Average Daily Rate (ADR) Airbnb Trends in Rennes-les-Bains (2025)
Effective short term rental pricing strategy in Rennes-les-Bains involves understanding monthly ADR fluctuations. The Average Daily Rate (ADR) for Airbnb in Rennes-les-Bains typically peaks in January and dips lowest during May. Leveraging Airbnb dynamic pricing tools or strategies based on this seasonality can significantly boost revenue. Here's a look at the typical nightly rates achieved:
- Best-in-class properties (Top 10%) command rates of $87+ per night, often due to premium features or locations.
- Strong performing properties (Top 25%) achieve nightly rates of $71 or more.
- Typical properties (Median) charge around $55 per night.
- Entry-level properties (Bottom 25%) earn around $42 per night.
Average Daily Rate (ADR) Trend by Month in Rennes-les-Bains
Get Live Rennes-les-Bains Market Intelligence 👇

Explore Real-time Analytics
Airbnb Seasonality Analysis & Trends in Rennes-les-Bains (2025)
Peak Season (May, August, April)
- Revenue averages $1,091 per month
- Occupancy rates average 40.3%
- Daily rates average $57
Shoulder Season
- Revenue averages $718 per month
- Occupancy maintains around 30.5%
- Daily rates hold near $60
Low Season (January, February, December)
- Revenue drops to average $476 per month
- Occupancy decreases to average 19.4%
- Daily rates adjust to average $66
Seasonality Insights for Rennes-les-Bains
- The Airbnb seasonality in Rennes-les-Bains shows highly seasonal trends requiring careful strategy. While the sections above show seasonal averages, it's also insightful to look at the extremes:
- During the high season, the absolute peak month showcases Rennes-les-Bains's highest earning potential, with monthly revenues capable of climbing to $1,219, occupancy reaching a high of 48.6%, and ADRs peaking at $66.
- Conversely, the slowest single month of the year, typically falling within the low season, marks the market's lowest point. In this month, revenue might dip to $403, occupancy could drop to 16.9%, and ADRs may adjust down to $56.
- Understanding both the seasonal averages and these monthly peaks and troughs in revenue, occupancy, and ADR is crucial for maximizing your Airbnb profit potential in Rennes-les-Bains.
Seasonal Strategies for Maximizing Profit
- Peak Season: Maximize revenue through premium pricing and potentially longer minimum stays. Ensure high availability.
- Low Season: Offer competitive pricing, special promotions (e.g., extended stay discounts), and flexible cancellation policies. Target off-season travelers like remote workers or budget-conscious guests.
- Shoulder Seasons: Implement dynamic pricing that balances peak and low rates. Target weekend travelers or specific events. Offer slightly more flexible terms than peak season.
- Regularly analyze your own performance against these Rennes-les-Bains seasonality benchmarks and adjust your pricing and availability strategy accordingly.
Best Areas for Airbnb Investment in Rennes-les-Bains (2025)
Exploring the top neighborhoods for short-term rentals in Rennes-les-Bains? This section highlights key areas, outlining why they are attractive for hosts and guests, along with notable local attractions. Consider these locations based on your target guest profile and investment strategy.
| Neighborhood / Area | Why Host Here? (Target Guests & Appeal) | Key Attractions & Landmarks |
|---|---|---|
| Les Thermes | Renowned for its thermal springs, attracting wellness tourists looking for relaxation and spa experiences. A prime spot for hosting guests seeking health and rejuvenation. | Thermal Baths, Spa Facilities, Natural Hot Springs, Wellness Retreats |
| Centre Ville | The heart of Rennes-les-Bains, featuring charming streets and local shops. Perfect for visitors who want to explore the local culture and vibe. | Local Cafes, Artisan Shops, Cultural Events, Historic Architecture |
| Le Rennes Nature | Nestled in nature, appealing to outdoor enthusiasts. Ideal for hosting guests who enjoy hiking, nature walks, and scenic views. | Hiking Trails, Nature Parks, Scenic Viewpoints, Wildlife Watching |
| La Source | A tranquil area near the river, attracting families and couples looking for peaceful escapes. Ideal for those who enjoy water activities and picnicking. | River Activities, Picnic Areas, Scenic Walks, Fishing Spots |
| Château de Couiza | Located near historical sites, appealing to history buffs and tourists interested in exploring local heritage. Offers a rich cultural experience. | Château de Couiza, Historical Tours, Cultural Heritage Sites |
| Les Lavandes | A picturesque region known for its lavender fields and stunning landscapes. Perfect for travelers looking to enjoy the beauty of Occitania. | Lavender Fields, Photography Spots, Natural Scenery |
| Sentier des Névés | A hiking trail popular among adventure seekers and nature lovers. Attracts those looking for active holidays and exploration. | Hiking Trails, Breathtaking Views, Wildflowers, Picnic Areas |
| Vignobles de l'Aude | Surrounding vineyards offer wine tasting and tours, attractive to wine lovers and gastronomes. Ideal for unique experiences and local cuisine. | Wine Tours, Vineyard Tastings, Local Restaurants, Culinary Events |
Understanding Airbnb License Requirements & STR Laws in Rennes-les-Bains (2025)
While Rennes-les-Bains, Occitania, France currently shows low STR regulations, specific Airbnb license requirements might still exist or change. Always verify the latest short term rental regulations and Airbnb license requirements directly with local government authorities for Rennes-les-Bains to ensure full compliance before hosting.
(Source: AirROI data, 2025, finding no licensed listings among those analyzed)
Top Performing Airbnb Properties in Rennes-les-Bains (2025)
Benchmark your potential! Explore examples of top-performing Airbnb properties in Rennes-les-Bainsbased on Trailing Twelve Month (TTM) revenue. Analyze their characteristics, revenue, occupancy rate, and ADR to understand what drives success in this market.
La Maison Bleue, cozy riverside nest
Entire Place • 3 bedrooms
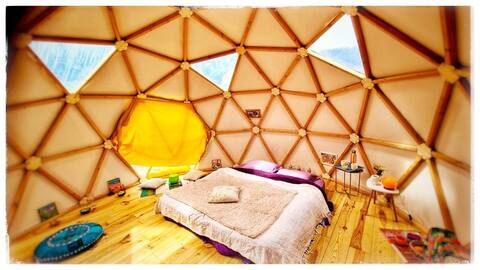
Cosy dome - at sunrise
Private Room • N/A
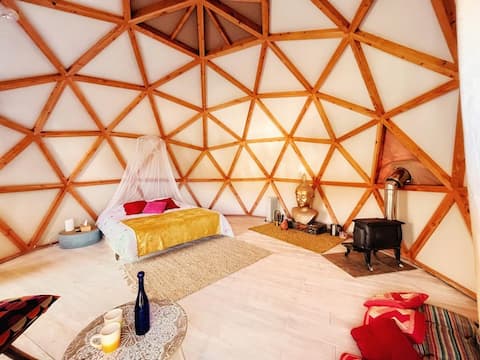
Sacred Dome with Panoramic View
Private Room • 1 bedroom
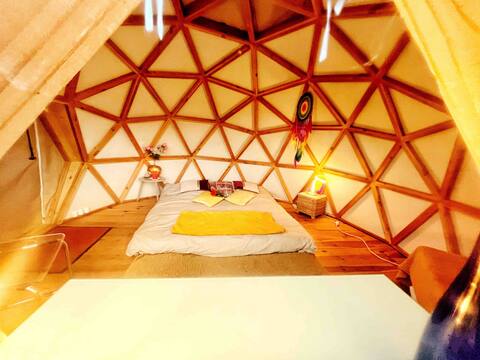
Nest Dôme - cocoon under the stars
Private Room • 1 bedroom

Natural Glamping in a Vintage American Caravan
Entire Place • 2 bedrooms
Studio vue sur la rivière
Entire Place • N/A
Note: Performance varies based on location, size, amenities, seasonality, and management quality. Data reflects the past 12 months.
Top Performing Airbnb Hosts in Rennes-les-Bains (2025)
Learn from the best! This table showcases top-performing Airbnb hosts in Rennes-les-Bains based on the number of properties managed and estimated total revenue over the past year. Analyze their scale and performance metrics.
| Host Name | Properties | Grossing Revenue | Stay Reviews | Avg Rating |
|---|---|---|---|---|
| Alain | 2 | $32,241 | 105 | 4.86/5.0 |
| Claire | 4 | $18,423 | 190 | 4.57/5.0 |
| Fabienne | 1 | $12,743 | 22 | 4.86/5.0 |
| Dave | 1 | $10,933 | 68 | 5.00/5.0 |
| Nicola | 5 | $9,972 | 3 | 1.00/5.0 |
| Host #10266693 | 1 | $6,961 | 2 | 0.00/5.0 |
| Linda | 1 | $6,568 | 40 | 4.55/5.0 |
| Marie-Christine | 1 | $6,056 | 24 | 4.79/5.0 |
| Caroline | 2 | $5,757 | 9 | 4.90/5.0 |
| Geoffrey | 1 | $5,365 | 53 | 4.66/5.0 |
Analyzing the strategies of top hosts, such as their property selection, pricing, and guest communication, can offer valuable lessons for optimizing your own Airbnb operations in Rennes-les-Bains.
Dive Deeper: Advanced Rennes-les-Bains STR Market Data (2025)
Ready to unlock more insights? AirROI provides access to advanced metrics and comprehensive Airbnb data for Rennes-les-Bains. Explore detailed analytics beyond this report to refine your investment strategy, optimize pricing, and maximize your vacation rental profits.
Explore Advanced MetricsRennes-les-Bains Short-Term Rental Market Composition (2025): Property & Room Types
Room Type Distribution
Property Type Distribution
Market Composition Insights for Rennes-les-Bains
- The Rennes-les-Bains Airbnb market composition is heavily skewed towards Entire Home/Apt listings, which make up 81% of the 21 active rentals. This indicates strong guest preference for privacy and space.
- Looking at the property type distribution in Rennes-les-Bains, Apartment/Condo properties are the most common (61.9%), reflecting the local real estate landscape.
Rennes-les-Bains Airbnb Room Capacity Analysis (2025): Bedroom Distribution
Distribution of Listings by Number of Bedrooms
Room Capacity Insights for Rennes-les-Bains
- The dominant room capacity in Rennes-les-Bains is 1 bedroom listings, making up 66.7% of the market. This suggests a strong demand for properties suitable for couples or solo travelers.
- Together, 1 bedroom and 2 bedrooms properties represent 76.2% of the active Airbnb listings in Rennes-les-Bains, indicating a high concentration in these sizes.
- With over half the market (66.7%) consisting of studios or 1-bedroom units, Rennes-les-Bains is particularly well-suited for individuals or couples.
- Listings with 3+ bedrooms (4.8%) represent a smaller niche, potentially indicating an underserved market for larger group accommodations in Rennes-les-Bains.
Rennes-les-Bains Vacation Rental Guest Capacity Trends (2025)
Distribution of Listings by Guest Capacity
Guest Capacity Insights for Rennes-les-Bains
- The most common guest capacity trend in Rennes-les-Bains vacation rentals is listings accommodating 2 guests (61.9%). This suggests the primary traveler segment is likely couples or solo travelers.
- Properties designed for 2 guests and 4 guests dominate the Rennes-les-Bains STR market, accounting for 76.2% of listings.
- A significant 61.9% of listings cater specifically to 1-2 guests, highlighting strong demand from couples and solo travelers in Rennes-les-Bains.
- On average, properties in Rennes-les-Bains are equipped to host 2.5 guests.
Rennes-les-Bains Airbnb Booking Patterns (2025): Available vs. Booked Days
Available Days Distribution
Booked Days Distribution
Booking Pattern Insights for Rennes-les-Bains
- The most common availability pattern in Rennes-les-Bains falls within the 271-366 days range, representing 57.1% of listings. This suggests many properties have significant open periods on their calendars.
- Approximately 100.0% of listings show high availability (181+ days open annually), indicating potential for increased bookings or specific owner usage patterns.
- For booked days, the 91-180 days range is most frequent in Rennes-les-Bains (42.9%), reflecting common guest stay durations or potential owner blocking patterns.
Rennes-les-Bains Airbnb Minimum Stay Requirements Analysis
Distribution of Listings by Minimum Night Requirement
1 Night
8 listings
40% of total
2 Nights
7 listings
35% of total
3 Nights
3 listings
15% of total
4-6 Nights
1 listings
5% of total
7-29 Nights
1 listings
5% of total
Key Insights
- The most prevalent minimum stay requirement in Rennes-les-Bains is 1 Night, adopted by 40% of listings. This highlights the market's preference for shorter, flexible bookings.
- A strong majority (75.0%) of the Rennes-les-Bains Airbnb data shows acceptance of very short stays (1-2 nights), indicating a dynamic, high-turnover market.
Recommendations
- Align with the market by considering a 1 Night minimum stay, as 40% of Rennes-les-Bains hosts use this setting.
- Adjust minimum nights based on seasonality – potentially shorter during low season and longer during peak demand periods in Rennes-les-Bains.
Rennes-les-Bains Airbnb Cancellation Policy Trends Analysis (2025)
Flexible
3 listings
20% of total
Moderate
6 listings
40% of total
Firm
4 listings
26.7% of total
Strict
2 listings
13.3% of total
Cancellation Policy Insights for Rennes-les-Bains
- The prevailing Airbnb cancellation policy trend in Rennes-les-Bains is Moderate, used by 40% of listings.
- There's a relatively balanced mix between guest-friendly (60.0%) and stricter (40.0%) policies, offering choices for different guest needs.
Recommendations for Hosts
- Consider adopting a Moderate policy to align with the 40% market standard in Rennes-les-Bains.
- Using a Strict policy might deter some guests, as only 13.3% of listings use it. Evaluate if potential revenue protection outweighs possible lower booking rates.
- Regularly review your cancellation policy against competitors and market demand shifts in Rennes-les-Bains.
Rennes-les-Bains STR Booking Lead Time Analysis (2025)
Average Booking Lead Time by Month
Booking Lead Time Insights for Rennes-les-Bains
- The overall average booking lead time for vacation rentals in Rennes-les-Bains is 34 days.
- Guests book furthest in advance for stays during September (average 68 days), likely coinciding with peak travel demand or local events.
- The shortest booking windows occur for stays in February (average 16 days), indicating more last-minute travel plans during this time.
- Seasonally, Fall (49 days avg.) sees the longest lead times, while Winter (20 days avg.) has the shortest, reflecting typical travel planning cycles.
Recommendations for Hosts
- Use the overall average lead time (34 days) as a baseline for your pricing and availability strategy in Rennes-les-Bains.
- For September stays, consider implementing length-of-stay discounts or slightly higher rates for bookings made less than 68 days out to capitalize on advance planning.
- Target marketing efforts for the Fall season well in advance (at least 49 days) to capture early planners.
- Monitor your own booking lead times against these Rennes-les-Bains averages to identify opportunities for dynamic pricing adjustments.
Popular & Essential Airbnb Amenities in Rennes-les-Bains (2025)
Amenity Prevalence
Amenity Insights for Rennes-les-Bains
- Essential amenities in Rennes-les-Bains that guests expect include: Kitchen. Lacking these (this) could significantly impact bookings.
- Popular amenities like Cooking basics, Heating, Free parking on premises are common but not universal. Offering these can provide a competitive edge.
- Warning: Wifi is not universally provided but is considered essential globally. Ensure reliable Wifi is offered.
Recommendations for Hosts
- Ensure your listing includes all essential amenities for Rennes-les-Bains: Kitchen.
- Consider adding popular differentiators like Cooking basics or Heating to increase appeal.
- Highlight unique or less common amenities you offer (e.g., hot tub, dedicated workspace, EV charger) in your listing description and photos.
- Regularly check competitor amenities in Rennes-les-Bains to stay competitive.
Rennes-les-Bains Airbnb Guest Demographics & Profile Analysis (2025)
Guest Profile Summary for Rennes-les-Bains
- The typical guest profile for Airbnb in Rennes-les-Bains consists of primarily domestic travelers (80%), often arriving from nearby Toulouse, typically belonging to the Post-2000s (Gen Z/Alpha) group (50%), primarily speaking French or English.
- Domestic travelers account for 79.8% of guests.
- Key international markets include France (79.8%) and Spain (5.8%).
- Top languages spoken are French (37%) followed by English (30.6%).
- A significant demographic segment is the Post-2000s (Gen Z/Alpha) group, representing 50% of guests.
Recommendations for Hosts
- Target domestic marketing efforts towards travelers from Toulouse and Perpignan.
- Tailor amenities and listing descriptions to appeal to the dominant Post-2000s (Gen Z/Alpha) demographic (e.g., highlight fast WiFi, smart home features, local guides).
- Highlight unique local experiences or amenities relevant to the primary guest profile.
- Consider seasonal promotions aligned with peak travel times for key origin markets.
Nearby Short-Term Rental Market Comparison
How does the Rennes-les-Bains Airbnb market stack up against its neighbors? Compare key performance metrics like average monthly revenue, ADR, and occupancy rates in surrounding areas to understand the broader regional STR landscape.
| Market | Active Properties | Monthly Revenue | Daily Rate | Avg. Occupancy |
|---|---|---|---|---|
| Vall-llobrega | 15 | $10,261 | $798.88 | 44% |
| Canyelles | 49 | $5,958 | $1023.94 | 37% |
| Arenys de Munt | 28 | $5,100 | $514.27 | 41% |
| Teià | 25 | $5,027 | $348.45 | 45% |
| Cornellà del Terri | 17 | $4,960 | $460.96 | 41% |
| Tiana | 12 | $4,955 | $299.97 | 48% |
| Amer | 10 | $4,848 | $397.58 | 40% |
| Bescanó | 11 | $4,761 | $445.38 | 41% |
| Porqueres | 12 | $4,714 | $469.05 | 36% |
| Premià de Dalt | 28 | $4,630 | $345.43 | 49% |