Pinet Airbnb Market Analysis 2025: Short Term Rental Data & Vacation Rental Statistics in Occitania, France
Is Airbnb profitable in Pinet in 2025? Explore comprehensive Airbnb analytics for Pinet, Occitania, France to uncover income potential. This 2025 STR market report for Pinet, based on AirROI data from April 2024 to March 2025, reveals key trends in the niche market of 21 active listings.
Whether you're considering an Airbnb investment in Pinet, optimizing your existing vacation rental, or exploring rental arbitrage opportunities, understanding the Pinet Airbnb data is crucial. Leveraging the low regulation environment is key to maximizing your short term rental income potential. Let's dive into the specifics.
Key Pinet Airbnb Performance Metrics Overview
Monthly Airbnb Revenue Variations & Income Potential in Pinet (2025)
Understanding the monthly revenue variations for Airbnb listings in Pinet is key to maximizing your short term rental income potential. Seasonality significantly impacts earnings. Our analysis, based on data from the past 12 months, shows that the peak revenue month for STRs in Pinet is typically August, while October often presents the lowest earnings, highlighting opportunities for strategic pricing adjustments during shoulder and low seasons. Explore the typical Airbnb income in Pinet across different performance tiers:
- Best-in-class properties (Top 10%) achieve $4,719+ monthly, often utilizing dynamic pricing and superior guest experiences.
- Strong performing properties (Top 25%) earn $2,359 or more, indicating effective management and desirable locations/amenities.
- Typical properties (Median) generate around $1,277 per month, representing the average market performance.
- Entry-level properties (Bottom 25%) see earnings around $654, often with potential for optimization.
Average Monthly Airbnb Earnings Trend in Pinet
Pinet Airbnb Occupancy Rate Trends (2025)
Maximize your bookings by understanding the Pinet STR occupancy trends. Seasonal demand shifts significantly influence how often properties are booked. Typically, Augustsees the highest demand (peak season occupancy), while March experiences the lowest (low season). Effective strategies, like adjusting minimum stays or offering promotions, can boost occupancy during slower periods. Here's how different property tiers perform in Pinet:
- Best-in-class properties (Top 10%) achieve 74%+ occupancy, indicating high desirability and potentially optimized availability.
- Strong performing properties (Top 25%) maintain 59% or higher occupancy, suggesting good market fit and guest satisfaction.
- Typical properties (Median) have an occupancy rate around 33%.
- Entry-level properties (Bottom 25%) average 17% occupancy, potentially facing higher vacancy.
Average Monthly Occupancy Rate Trend in Pinet
Average Daily Rate (ADR) Airbnb Trends in Pinet (2025)
Effective short term rental pricing strategy in Pinet involves understanding monthly ADR fluctuations. The Average Daily Rate (ADR) for Airbnb in Pinet typically peaks in August and dips lowest during March. Leveraging Airbnb dynamic pricing tools or strategies based on this seasonality can significantly boost revenue. Here's a look at the typical nightly rates achieved:
- Best-in-class properties (Top 10%) command rates of $357+ per night, often due to premium features or locations.
- Strong performing properties (Top 25%) achieve nightly rates of $189 or more.
- Typical properties (Median) charge around $117 per night.
- Entry-level properties (Bottom 25%) earn around $76 per night.
Average Daily Rate (ADR) Trend by Month in Pinet
Get Live Pinet Market Intelligence 👇

Explore Real-time Analytics
Airbnb Seasonality Analysis & Trends in Pinet (2025)
Peak Season (August, July, September)
- Revenue averages $2,563 per month
- Occupancy rates average 49.3%
- Daily rates average $159
Shoulder Season
- Revenue averages $1,644 per month
- Occupancy maintains around 36.3%
- Daily rates hold near $149
Low Season (January, February, October)
- Revenue drops to average $1,213 per month
- Occupancy decreases to average 30.3%
- Daily rates adjust to average $150
Seasonality Insights for Pinet
- The Airbnb seasonality in Pinet shows highly seasonal trends requiring careful strategy. While the sections above show seasonal averages, it's also insightful to look at the extremes:
- During the high season, the absolute peak month showcases Pinet's highest earning potential, with monthly revenues capable of climbing to $3,183, occupancy reaching a high of 61.3%, and ADRs peaking at $160.
- Conversely, the slowest single month of the year, typically falling within the low season, marks the market's lowest point. In this month, revenue might dip to $1,189, occupancy could drop to 27.2%, and ADRs may adjust down to $145.
- Understanding both the seasonal averages and these monthly peaks and troughs in revenue, occupancy, and ADR is crucial for maximizing your Airbnb profit potential in Pinet.
Seasonal Strategies for Maximizing Profit
- Peak Season: Maximize revenue through premium pricing and potentially longer minimum stays. Ensure high availability.
- Low Season: Offer competitive pricing, special promotions (e.g., extended stay discounts), and flexible cancellation policies. Target off-season travelers like remote workers or budget-conscious guests.
- Shoulder Seasons: Implement dynamic pricing that balances peak and low rates. Target weekend travelers or specific events. Offer slightly more flexible terms than peak season.
- Regularly analyze your own performance against these Pinet seasonality benchmarks and adjust your pricing and availability strategy accordingly.
Best Areas for Airbnb Investment in Pinet (2025)
Exploring the top neighborhoods for short-term rentals in Pinet? This section highlights key areas, outlining why they are attractive for hosts and guests, along with notable local attractions. Consider these locations based on your target guest profile and investment strategy.
| Neighborhood / Area | Why Host Here? (Target Guests & Appeal) | Key Attractions & Landmarks |
|---|---|---|
| Cévennes National Park | A stunning natural park famous for its rugged landscape and biodiversity, attracting nature lovers and hikers. Ideal for those seeking outdoor adventures and tranquility. | Mont Aigoual, Château de Florac, Gorges du Tarn, Biodiversity trails, Scenic drives |
| Carcassonne | Famous for its medieval fortress, La Cité, this historic city draws tourists interested in history and architecture. A prime spot for cultural tourism. | Carcassonne Castle, Basilica of Saint-Nazarre, Canal du Midi, La Cité medieval, Place Carnot |
| Montpellier | A vibrant city with a rich history and a youthful energy, making it popular for travelers looking for culture, nightlife, and events. | Place de la Comédie, Medieval streets, Montpellier Aquarium, Museums, Le Jardin des Plantes |
| Nîmes | Known for its well-preserved Roman architecture, such as the amphitheater and the Maison Carrée, attracting history enthusiasts and tourists. | Nîmes Arena, Maison Carrée, Gardens of the Fountain, Temple of Diana, Pont du Gard |
| Uzès | A charming town with a beautiful historic center and nearby attractions, perfect for those wanting a taste of Provençal life. | Uzès Ducal Palace, Place aux Herbes, Pont du Gard, Uzès Market, Château de Fairmont |
| Sète | Known as the Venice of Languedoc, this coastal town offers beautiful beaches and a rich maritime culture, drawing beachgoers and food lovers. | Étang de Thau, The canals, Mont Saint-Clair, The beach, Local seafood restaurants |
| Aigues-Mortes | A historic fortified town with medieval walls, attracting visitors interested in history and photography, as well as those looking for a unique stay. | The medieval walls, Constance Tower, Church of Saints Peter and Paul, Nearby salt marshes, Scenic viewpoints |
| Céret | Famous for its art scene and cherry trees, this picturesque town attracts artists and nature lovers looking for an authentic experience in the South of France. | The Museum of Modern Art, Céret Market, Château de Céret, Nearby hiking trails, Cherry orchards |
Understanding Airbnb License Requirements & STR Laws in Pinet (2025)
While Pinet, Occitania, France currently shows low STR regulations, specific Airbnb license requirements might still exist or change. Always verify the latest short term rental regulations and Airbnb license requirements directly with local government authorities for Pinet to ensure full compliance before hosting.
(Source: AirROI data, 2025, based on 10% licensed listings)
Top Performing Airbnb Properties in Pinet (2025)
Benchmark your potential! Explore examples of top-performing Airbnb properties in Pinetbased on Trailing Twelve Month (TTM) revenue. Analyze their characteristics, revenue, occupancy rate, and ADR to understand what drives success in this market.
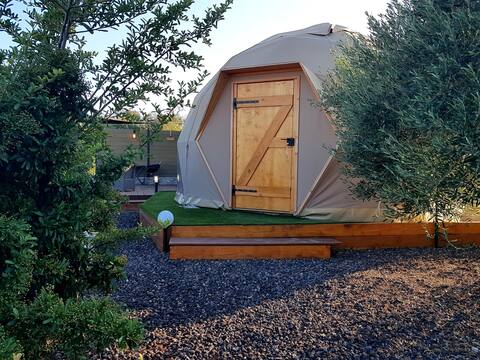
Cocooning dome with private hot tub
Entire Place • 1 bedroom
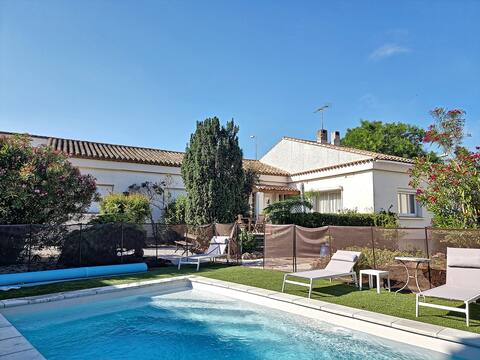
Large fully renovated pool villa
Entire Place • 5 bedrooms
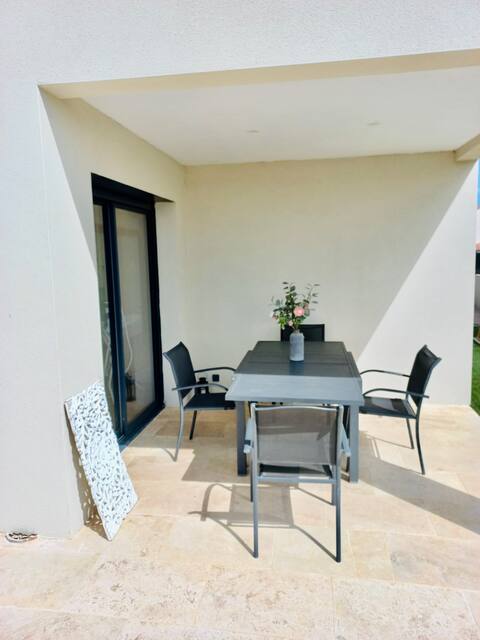
Villa moderne avec piscine
Entire Place • 3 bedrooms
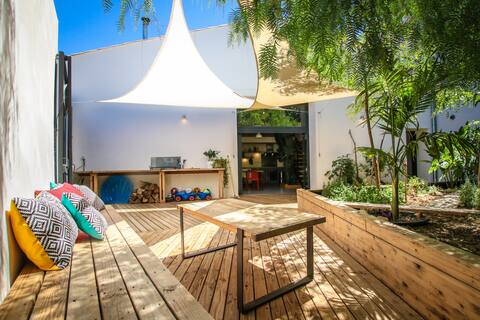
architect house on green garden
Entire Place • 3 bedrooms
La Villa Zen
Entire Place • 4 bedrooms
house l 'Angelina
Entire Place • 2 bedrooms
Note: Performance varies based on location, size, amenities, seasonality, and management quality. Data reflects the past 12 months.
Top Performing Airbnb Hosts in Pinet (2025)
Learn from the best! This table showcases top-performing Airbnb hosts in Pinet based on the number of properties managed and estimated total revenue over the past year. Analyze their scale and performance metrics.
| Host Name | Properties | Grossing Revenue | Stay Reviews | Avg Rating |
|---|---|---|---|---|
| Christelle | 1 | $50,595 | 189 | 4.96/5.0 |
| Françoise | 1 | $33,889 | 32 | 4.63/5.0 |
| Host #96299010 | 1 | $23,356 | 0 | 0.00/5.0 |
| Sarah | 1 | $15,474 | 18 | 4.83/5.0 |
| Alain | 1 | $15,036 | 36 | 4.67/5.0 |
| Laura | 1 | $14,911 | 26 | 4.88/5.0 |
| Marie | 1 | $12,004 | 158 | 4.96/5.0 |
| Pascale Et Justine | 1 | $11,816 | 46 | 4.78/5.0 |
| Tony | 2 | $10,202 | 14 | 4.53/5.0 |
| Host #488899060 | 1 | $9,433 | 1 | 0.00/5.0 |
Analyzing the strategies of top hosts, such as their property selection, pricing, and guest communication, can offer valuable lessons for optimizing your own Airbnb operations in Pinet.
Dive Deeper: Advanced Pinet STR Market Data (2025)
Ready to unlock more insights? AirROI provides access to advanced metrics and comprehensive Airbnb data for Pinet. Explore detailed analytics beyond this report to refine your investment strategy, optimize pricing, and maximize your vacation rental profits.
Explore Advanced MetricsPinet Short-Term Rental Market Composition (2025): Property & Room Types
Room Type Distribution
Property Type Distribution
Market Composition Insights for Pinet
- The Pinet Airbnb market composition is heavily skewed towards Entire Home/Apt listings, which make up 95.2% of the 21 active rentals. This indicates strong guest preference for privacy and space.
- Looking at the property type distribution in Pinet, House properties are the most common (57.1%), reflecting the local real estate landscape.
- Houses represent a significant 57.1% portion, catering likely to families or larger groups.
- Smaller segments like unique stays (combined 4.8%) offer potential for unique stay experiences.
Pinet Airbnb Room Capacity Analysis (2025): Bedroom Distribution
Distribution of Listings by Number of Bedrooms
Room Capacity Insights for Pinet
- The dominant room capacity in Pinet is 1 bedroom listings, making up 38.1% of the market. This suggests a strong demand for properties suitable for couples or solo travelers.
- Together, 1 bedroom and 3 bedrooms properties represent 61.9% of the active Airbnb listings in Pinet, indicating a high concentration in these sizes.
- A significant 47.6% of listings offer 3+ bedrooms, catering to larger groups and families seeking more space in Pinet.
Pinet Vacation Rental Guest Capacity Trends (2025)
Distribution of Listings by Guest Capacity
Guest Capacity Insights for Pinet
- The most common guest capacity trend in Pinet vacation rentals is listings accommodating 4 guests (33.3%). This suggests the primary traveler segment is likely small families or groups.
- Properties designed for 4 guests and 8+ guests dominate the Pinet STR market, accounting for 57.1% of listings.
- 42.9% of properties accommodate 6+ guests, serving the market segment for larger families or group travel in Pinet.
- On average, properties in Pinet are equipped to host 5.0 guests.
Pinet Airbnb Booking Patterns (2025): Available vs. Booked Days
Available Days Distribution
Booked Days Distribution
Booking Pattern Insights for Pinet
- The most common availability pattern in Pinet falls within the 271-366 days range, representing 76.2% of listings. This suggests many properties have significant open periods on their calendars.
- Approximately 90.5% of listings show high availability (181+ days open annually), indicating potential for increased bookings or specific owner usage patterns.
- For booked days, the 31-90 days range is most frequent in Pinet (52.4%), reflecting common guest stay durations or potential owner blocking patterns.
- A notable 9.6% of properties secure long booking periods (181+ days booked per year), highlighting successful long-term rental strategies or significant owner usage.
Pinet Airbnb Minimum Stay Requirements Analysis
Distribution of Listings by Minimum Night Requirement
1 Night
4 listings
21.1% of total
2 Nights
5 listings
26.3% of total
3 Nights
3 listings
15.8% of total
4-6 Nights
5 listings
26.3% of total
30+ Nights
2 listings
10.5% of total
Key Insights
- The most prevalent minimum stay requirement in Pinet is 2 Nights, adopted by 26.3% of listings. This highlights the market's preference for shorter, flexible bookings.
- A significant segment (10.5%) caters to monthly stays (30+ nights) in Pinet, pointing to opportunities in the extended-stay market.
Recommendations
- Align with the market by considering a 2 Nights minimum stay, as 26.3% of Pinet hosts use this setting.
- If feasible, allowing 1-night stays, especially midweek or during low season, could capture last-minute bookings, as only 21.1% currently do.
- Explore offering discounts for stays of 30+ nights to attract the 10.5% of the market seeking extended stays.
- Adjust minimum nights based on seasonality – potentially shorter during low season and longer during peak demand periods in Pinet.
Pinet Airbnb Cancellation Policy Trends Analysis (2025)
Flexible
2 listings
11.8% of total
Moderate
6 listings
35.3% of total
Firm
3 listings
17.6% of total
Strict
6 listings
35.3% of total
Cancellation Policy Insights for Pinet
- The prevailing Airbnb cancellation policy trend in Pinet is Moderate, used by 35.3% of listings.
- A majority (52.9%) of hosts in Pinet utilize Firm or Strict policies, indicating a market where hosts prioritize booking security.
Recommendations for Hosts
- Consider adopting a Moderate policy to align with the 35.3% market standard in Pinet.
- With 35.3% using Strict terms, this is a viable option in Pinet, particularly for high-value properties or during peak demand periods.
- Regularly review your cancellation policy against competitors and market demand shifts in Pinet.
Pinet STR Booking Lead Time Analysis (2025)
Average Booking Lead Time by Month
Booking Lead Time Insights for Pinet
- The overall average booking lead time for vacation rentals in Pinet is 59 days.
- Guests book furthest in advance for stays during June (average 93 days), likely coinciding with peak travel demand or local events.
- The shortest booking windows occur for stays in March (average 33 days), indicating more last-minute travel plans during this time.
- Seasonally, Summer (67 days avg.) sees the longest lead times, while Spring (41 days avg.) has the shortest, reflecting typical travel planning cycles.
Recommendations for Hosts
- Use the overall average lead time (59 days) as a baseline for your pricing and availability strategy in Pinet.
- For June stays, consider implementing length-of-stay discounts or slightly higher rates for bookings made less than 93 days out to capitalize on advance planning.
- Target marketing efforts for the Summer season well in advance (at least 67 days) to capture early planners.
- Monitor your own booking lead times against these Pinet averages to identify opportunities for dynamic pricing adjustments.
Popular & Essential Airbnb Amenities in Pinet (2025)
Amenity Prevalence
Amenity Insights for Pinet
- Essential amenities in Pinet that guests expect include: Kitchen, Dishes and silverware. Lacking these (any) could significantly impact bookings.
- Popular amenities like Hangers, Hot water, Cooking basics are common but not universal. Offering these can provide a competitive edge.
Recommendations for Hosts
- Ensure your listing includes all essential amenities for Pinet: Kitchen, Dishes and silverware.
- Prioritize adding missing essentials: Dishes and silverware.
- Consider adding popular differentiators like Hangers or Hot water to increase appeal.
- Highlight unique or less common amenities you offer (e.g., hot tub, dedicated workspace, EV charger) in your listing description and photos.
- Regularly check competitor amenities in Pinet to stay competitive.
Pinet Airbnb Guest Demographics & Profile Analysis (2025)
Guest Profile Summary for Pinet
- The typical guest profile for Airbnb in Pinet consists of primarily domestic travelers (91%), often arriving from nearby Montpellier, typically belonging to the Post-2000s (Gen Z/Alpha) group (50%), primarily speaking French or English.
- Domestic travelers account for 91.0% of guests.
- Key international markets include France (91%) and United Kingdom (2.2%).
- Top languages spoken are French (56.1%) followed by English (26.5%).
- A significant demographic segment is the Post-2000s (Gen Z/Alpha) group, representing 50% of guests.
Recommendations for Hosts
- Target domestic marketing efforts towards travelers from Montpellier and Paris.
- Tailor amenities and listing descriptions to appeal to the dominant Post-2000s (Gen Z/Alpha) demographic (e.g., highlight fast WiFi, smart home features, local guides).
- Highlight unique local experiences or amenities relevant to the primary guest profile.
- Consider seasonal promotions aligned with peak travel times for key origin markets.
Nearby Short-Term Rental Market Comparison
How does the Pinet Airbnb market stack up against its neighbors? Compare key performance metrics like average monthly revenue, ADR, and occupancy rates in surrounding areas to understand the broader regional STR landscape.
| Market | Active Properties | Monthly Revenue | Daily Rate | Avg. Occupancy |
|---|---|---|---|---|
| Cornellà del Terri | 17 | $4,960 | $460.96 | 41% |
| Amer | 10 | $4,848 | $397.58 | 40% |
| Porqueres | 12 | $4,714 | $469.05 | 36% |
| Villeneuvette | 13 | $4,150 | $337.56 | 44% |
| Divajeu | 19 | $3,941 | $410.65 | 42% |
| Bordils | 11 | $3,557 | $525.15 | 36% |
| Vilademuls | 20 | $3,489 | $328.54 | 36% |
| Vilanant | 10 | $3,424 | $343.93 | 34% |
| Bàscara | 13 | $3,317 | $437.52 | 39% |
| Castelnou | 12 | $3,274 | $302.12 | 31% |