Palavas-les-Flots Airbnb Market Analysis 2025: Short Term Rental Data & Vacation Rental Statistics in Occitania, France
Is Airbnb profitable in Palavas-les-Flots in 2025? Explore comprehensive Airbnb analytics for Palavas-les-Flots, Occitania, France to uncover income potential. This 2025 STR market report for Palavas-les-Flots, based on AirROI data from April 2024 to March 2025, reveals key trends in the market of 668 active listings.
Whether you're considering an Airbnb investment in Palavas-les-Flots, optimizing your existing vacation rental, or exploring rental arbitrage opportunities, understanding the Palavas-les-Flots Airbnb data is crucial. Leveraging the low regulation environment is key to maximizing your short term rental income potential. Let's dive into the specifics.
Key Palavas-les-Flots Airbnb Performance Metrics Overview
Monthly Airbnb Revenue Variations & Income Potential in Palavas-les-Flots (2025)
Understanding the monthly revenue variations for Airbnb listings in Palavas-les-Flots is key to maximizing your short term rental income potential. Seasonality significantly impacts earnings. Our analysis, based on data from the past 12 months, shows that the peak revenue month for STRs in Palavas-les-Flots is typically August, while March often presents the lowest earnings, highlighting opportunities for strategic pricing adjustments during shoulder and low seasons. Explore the typical Airbnb income in Palavas-les-Flots across different performance tiers:
- Best-in-class properties (Top 10%) achieve $3,106+ monthly, often utilizing dynamic pricing and superior guest experiences.
- Strong performing properties (Top 25%) earn $2,155 or more, indicating effective management and desirable locations/amenities.
- Typical properties (Median) generate around $1,321 per month, representing the average market performance.
- Entry-level properties (Bottom 25%) see earnings around $697, often with potential for optimization.
Average Monthly Airbnb Earnings Trend in Palavas-les-Flots
Palavas-les-Flots Airbnb Occupancy Rate Trends (2025)
Maximize your bookings by understanding the Palavas-les-Flots STR occupancy trends. Seasonal demand shifts significantly influence how often properties are booked. Typically, Augustsees the highest demand (peak season occupancy), while March experiences the lowest (low season). Effective strategies, like adjusting minimum stays or offering promotions, can boost occupancy during slower periods. Here's how different property tiers perform in Palavas-les-Flots:
- Best-in-class properties (Top 10%) achieve 78%+ occupancy, indicating high desirability and potentially optimized availability.
- Strong performing properties (Top 25%) maintain 59% or higher occupancy, suggesting good market fit and guest satisfaction.
- Typical properties (Median) have an occupancy rate around 39%.
- Entry-level properties (Bottom 25%) average 21% occupancy, potentially facing higher vacancy.
Average Monthly Occupancy Rate Trend in Palavas-les-Flots
Average Daily Rate (ADR) Airbnb Trends in Palavas-les-Flots (2025)
Effective short term rental pricing strategy in Palavas-les-Flots involves understanding monthly ADR fluctuations. The Average Daily Rate (ADR) for Airbnb in Palavas-les-Flots typically peaks in July and dips lowest during March. Leveraging Airbnb dynamic pricing tools or strategies based on this seasonality can significantly boost revenue. Here's a look at the typical nightly rates achieved:
- Best-in-class properties (Top 10%) command rates of $191+ per night, often due to premium features or locations.
- Strong performing properties (Top 25%) achieve nightly rates of $131 or more.
- Typical properties (Median) charge around $100 per night.
- Entry-level properties (Bottom 25%) earn around $80 per night.
Average Daily Rate (ADR) Trend by Month in Palavas-les-Flots
Get Live Palavas-les-Flots Market Intelligence 👇

Explore Real-time Analytics
Airbnb Seasonality Analysis & Trends in Palavas-les-Flots (2025)
Peak Season (August, July, May)
- Revenue averages $2,539 per month
- Occupancy rates average 58.2%
- Daily rates average $127
Shoulder Season
- Revenue averages $1,471 per month
- Occupancy maintains around 38.5%
- Daily rates hold near $118
Low Season (January, February, March)
- Revenue drops to average $849 per month
- Occupancy decreases to average 29.8%
- Daily rates adjust to average $111
Seasonality Insights for Palavas-les-Flots
- The Airbnb seasonality in Palavas-les-Flots shows highly seasonal trends requiring careful strategy. While the sections above show seasonal averages, it's also insightful to look at the extremes:
- During the high season, the absolute peak month showcases Palavas-les-Flots's highest earning potential, with monthly revenues capable of climbing to $3,115, occupancy reaching a high of 73.2%, and ADRs peaking at $131.
- Conversely, the slowest single month of the year, typically falling within the low season, marks the market's lowest point. In this month, revenue might dip to $823, occupancy could drop to 28.5%, and ADRs may adjust down to $110.
- Understanding both the seasonal averages and these monthly peaks and troughs in revenue, occupancy, and ADR is crucial for maximizing your Airbnb profit potential in Palavas-les-Flots.
Seasonal Strategies for Maximizing Profit
- Peak Season: Maximize revenue through premium pricing and potentially longer minimum stays. Ensure high availability.
- Low Season: Offer competitive pricing, special promotions (e.g., extended stay discounts), and flexible cancellation policies. Target off-season travelers like remote workers or budget-conscious guests.
- Shoulder Seasons: Implement dynamic pricing that balances peak and low rates. Target weekend travelers or specific events. Offer slightly more flexible terms than peak season.
- Regularly analyze your own performance against these Palavas-les-Flots seasonality benchmarks and adjust your pricing and availability strategy accordingly.
Best Areas for Airbnb Investment in Palavas-les-Flots (2025)
Exploring the top neighborhoods for short-term rentals in Palavas-les-Flots? This section highlights key areas, outlining why they are attractive for hosts and guests, along with notable local attractions. Consider these locations based on your target guest profile and investment strategy.
| Neighborhood / Area | Why Host Here? (Target Guests & Appeal) | Key Attractions & Landmarks |
|---|---|---|
| Plage de Palavas | Popular beach area with golden sands and vibrant beach clubs, attracting both tourists and locals looking for sun and relaxation. | Aquarium Mare Nostrum, Palavas Beach, Luna Park, Casino de Palavas, Espace Louis Daclin |
| Centre-ville de Palavas | The city center is bustling with shops, restaurants, and markets, making it a prime location for visitors wanting to experience local culture and cuisine. | Fishermen's Port, Palavas Market, Restaurants along the Canal, Musee Albert Dubout, Church of Saint-Pierre |
| Le Petit Travers | A quieter beach area ideal for families and those seeking a more tranquil getaway, yet still close to attractions in Palavas. | Petit Travers Beach, Walking and cycling paths, Family-friendly restaurants, Natural reserve nearby |
| Salin de Giraud | An area known for its beautiful salt marshes and natural beauty, attracting nature lovers and bird watchers alike, offering a unique experience away from the crowd. | Pink Flamingo Viewing, Canal de Palavas, Nature walks, Photography opportunities |
| La Grande Motte | Nearby modern resort town known for its unique architecture and beach access, a favorite spot for tourists looking for a chic seaside experience. | Grande Motte Beach, Shopping in La Grande Motte, Golf courses, Cycling paths along the coast |
| Montpellier | A short drive away, Montpellier is a vibrant city filled with history, culture, and nightlife, perfect for those staying in Palavas who want urban excitement. | Place de la Comédie, Montpellier Cathedral, Museums and Galleries, Shopping streets, Live music venues |
| Carnon | A nearby seaside resort with lovely beaches and a marina, ideal for water sports enthusiasts and families looking for seaside fun. | Carnon Beach, Marina Port, Water sports activities, Local seafood restaurants |
| Castelans Beach | A more secluded beach spot ideal for visitors looking for peace and less crowded spaces, surrounded by natural beauty. | Scenic walking trails, Quiet beach spots, Access to water sports, Dunes and wildlife |
Understanding Airbnb License Requirements & STR Laws in Palavas-les-Flots (2025)
While Palavas-les-Flots, Occitania, France currently shows low STR regulations, specific Airbnb license requirements might still exist or change. Always verify the latest short term rental regulations and Airbnb license requirements directly with local government authorities for Palavas-les-Flots to ensure full compliance before hosting.
(Source: AirROI data, 2025, based on 9% licensed listings)
Top Performing Airbnb Properties in Palavas-les-Flots (2025)
Benchmark your potential! Explore examples of top-performing Airbnb properties in Palavas-les-Flotsbased on Trailing Twelve Month (TTM) revenue. Analyze their characteristics, revenue, occupancy rate, and ADR to understand what drives success in this market.
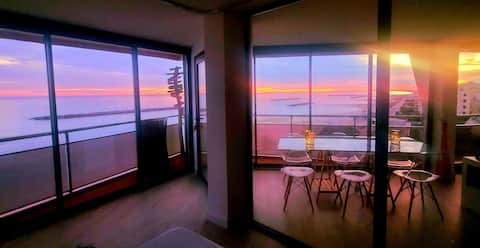
Best view in Palavas. 4 floor-to-ceiling windows with sea view
Entire Place • 2 bedrooms

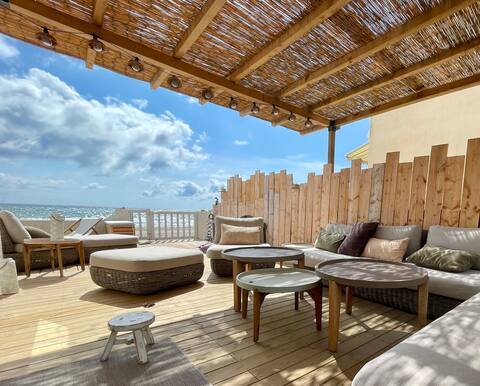
2 min BEACH, Beautiful renovated fisherman's house
Entire Place • 4 bedrooms
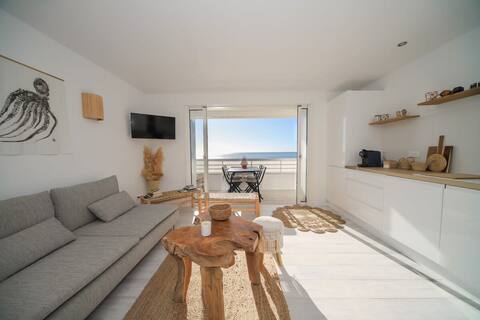
Chic et cosy, Palavas-les-Flots
Entire Place • 3 bedrooms
T3 Octopus Sea View Palavas Private Parking
Entire Place • 2 bedrooms
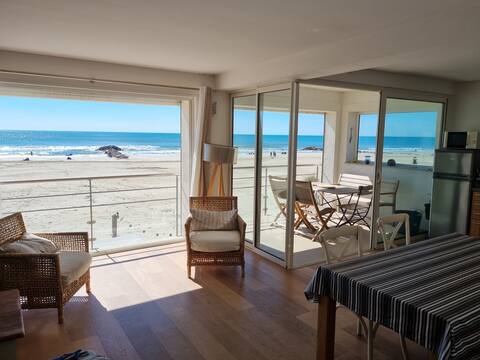
Beautiful frontline apartment with sea view
Entire Place • 3 bedrooms
Villa des Flamants roses
Entire Place • 4 bedrooms
Note: Performance varies based on location, size, amenities, seasonality, and management quality. Data reflects the past 12 months.
Top Performing Airbnb Hosts in Palavas-les-Flots (2025)
Learn from the best! This table showcases top-performing Airbnb hosts in Palavas-les-Flots based on the number of properties managed and estimated total revenue over the past year. Analyze their scale and performance metrics.
| Host Name | Properties | Grossing Revenue | Stay Reviews | Avg Rating |
|---|---|---|---|---|
| Carole Et Bastien | 11 | $250,806 | 260 | 4.83/5.0 |
| Manon | 11 | $193,338 | 183 | 4.20/5.0 |
| Sophie | 2 | $105,352 | 163 | 4.96/5.0 |
| Charlotte | 4 | $92,243 | 70 | 4.42/5.0 |
| Thierry | 1 | $68,873 | 120 | 4.98/5.0 |
| Appart'Hôtel Evasion | 5 | $67,783 | 262 | 4.90/5.0 |
| Key’Pal Conciergerie | 6 | $66,040 | 113 | 4.72/5.0 |
| Emmanuelle | 2 | $64,480 | 154 | 4.99/5.0 |
| Vanessa Fortunée | 3 | $58,563 | 11 | 1.36/5.0 |
| Stéphanie | 1 | $53,754 | 10 | 4.90/5.0 |
Analyzing the strategies of top hosts, such as their property selection, pricing, and guest communication, can offer valuable lessons for optimizing your own Airbnb operations in Palavas-les-Flots.
Dive Deeper: Advanced Palavas-les-Flots STR Market Data (2025)
Ready to unlock more insights? AirROI provides access to advanced metrics and comprehensive Airbnb data for Palavas-les-Flots. Explore detailed analytics beyond this report to refine your investment strategy, optimize pricing, and maximize your vacation rental profits.
Explore Advanced MetricsPalavas-les-Flots Short-Term Rental Market Composition (2025): Property & Room Types
Room Type Distribution
Property Type Distribution
Market Composition Insights for Palavas-les-Flots
- The Palavas-les-Flots Airbnb market composition is heavily skewed towards Entire Home/Apt listings, which make up 98.2% of the 668 active rentals. This indicates strong guest preference for privacy and space.
- Looking at the property type distribution in Palavas-les-Flots, Apartment/Condo properties are the most common (88.9%), reflecting the local real estate landscape.
- Smaller segments like hotel/boutique, outdoor/unique, others (combined 2.0%) offer potential for unique stay experiences.
Palavas-les-Flots Airbnb Room Capacity Analysis (2025): Bedroom Distribution
Distribution of Listings by Number of Bedrooms
Room Capacity Insights for Palavas-les-Flots
- The dominant room capacity in Palavas-les-Flots is 1 bedroom listings, making up 48.2% of the market. This suggests a strong demand for properties suitable for couples or solo travelers.
- Together, 1 bedroom and 2 bedrooms properties represent 75.1% of the active Airbnb listings in Palavas-les-Flots, indicating a high concentration in these sizes.
- Listings with 3+ bedrooms (8.5%) represent a smaller niche, potentially indicating an underserved market for larger group accommodations in Palavas-les-Flots.
Palavas-les-Flots Vacation Rental Guest Capacity Trends (2025)
Distribution of Listings by Guest Capacity
Guest Capacity Insights for Palavas-les-Flots
- The most common guest capacity trend in Palavas-les-Flots vacation rentals is listings accommodating 4 guests (48.1%). This suggests the primary traveler segment is likely small families or groups.
- Properties designed for 4 guests and 2 guests dominate the Palavas-les-Flots STR market, accounting for 63.5% of listings.
- 16.7% of properties accommodate 6+ guests, serving the market segment for larger families or group travel in Palavas-les-Flots.
- On average, properties in Palavas-les-Flots are equipped to host 4.0 guests.
Palavas-les-Flots Airbnb Booking Patterns (2025): Available vs. Booked Days
Available Days Distribution
Booked Days Distribution
Booking Pattern Insights for Palavas-les-Flots
- The most common availability pattern in Palavas-les-Flots falls within the 271-366 days range, representing 48.1% of listings. This suggests many properties have significant open periods on their calendars.
- Approximately 85.4% of listings show high availability (181+ days open annually), indicating potential for increased bookings or specific owner usage patterns.
- For booked days, the 91-180 days range is most frequent in Palavas-les-Flots (38.2%), reflecting common guest stay durations or potential owner blocking patterns.
- A notable 16.0% of properties secure long booking periods (181+ days booked per year), highlighting successful long-term rental strategies or significant owner usage.
Palavas-les-Flots Airbnb Minimum Stay Requirements Analysis
Distribution of Listings by Minimum Night Requirement
1 Night
51 listings
8.2% of total
2 Nights
159 listings
25.6% of total
3 Nights
121 listings
19.5% of total
4-6 Nights
154 listings
24.8% of total
7-29 Nights
79 listings
12.7% of total
30+ Nights
56 listings
9% of total
Key Insights
- The most prevalent minimum stay requirement in Palavas-les-Flots is 2 Nights, adopted by 25.6% of listings. This highlights the market's preference for shorter, flexible bookings.
Recommendations
- Align with the market by considering a 2 Nights minimum stay, as 25.6% of Palavas-les-Flots hosts use this setting.
- If feasible, allowing 1-night stays, especially midweek or during low season, could capture last-minute bookings, as only 8.2% currently do.
- Explore offering discounts for stays of 30+ nights to attract the 9% of the market seeking extended stays.
- Adjust minimum nights based on seasonality – potentially shorter during low season and longer during peak demand periods in Palavas-les-Flots.
Palavas-les-Flots Airbnb Cancellation Policy Trends Analysis (2025)
Super Strict 30 Days
1 listings
0.2% of total
Flexible
120 listings
20.3% of total
Moderate
176 listings
29.8% of total
Firm
119 listings
20.1% of total
Strict
175 listings
29.6% of total
Cancellation Policy Insights for Palavas-les-Flots
- The prevailing Airbnb cancellation policy trend in Palavas-les-Flots is Moderate, used by 29.8% of listings.
- There's a relatively balanced mix between guest-friendly (50.1%) and stricter (49.7%) policies, offering choices for different guest needs.
Recommendations for Hosts
- Consider adopting a Moderate policy to align with the 29.8% market standard in Palavas-les-Flots.
- Regularly review your cancellation policy against competitors and market demand shifts in Palavas-les-Flots.
Palavas-les-Flots STR Booking Lead Time Analysis (2025)
Average Booking Lead Time by Month
Booking Lead Time Insights for Palavas-les-Flots
- The overall average booking lead time for vacation rentals in Palavas-les-Flots is 50 days.
- Guests book furthest in advance for stays during July (average 84 days), likely coinciding with peak travel demand or local events.
- The shortest booking windows occur for stays in November (average 31 days), indicating more last-minute travel plans during this time.
- Seasonally, Summer (79 days avg.) sees the longest lead times, while Winter (33 days avg.) has the shortest, reflecting typical travel planning cycles.
Recommendations for Hosts
- Use the overall average lead time (50 days) as a baseline for your pricing and availability strategy in Palavas-les-Flots.
- For July stays, consider implementing length-of-stay discounts or slightly higher rates for bookings made less than 84 days out to capitalize on advance planning.
- Target marketing efforts for the Summer season well in advance (at least 79 days) to capture early planners.
- Monitor your own booking lead times against these Palavas-les-Flots averages to identify opportunities for dynamic pricing adjustments.
Popular & Essential Airbnb Amenities in Palavas-les-Flots (2025)
Amenity Prevalence
Amenity Insights for Palavas-les-Flots
- Essential amenities in Palavas-les-Flots that guests expect include: Kitchen, TV. Lacking these (any) could significantly impact bookings.
- Popular amenities like Heating, Hot water, Dishes and silverware are common but not universal. Offering these can provide a competitive edge.
Recommendations for Hosts
- Ensure your listing includes all essential amenities for Palavas-les-Flots: Kitchen, TV.
- Prioritize adding missing essentials: Kitchen, TV.
- Consider adding popular differentiators like Heating or Hot water to increase appeal.
- Highlight unique or less common amenities you offer (e.g., hot tub, dedicated workspace, EV charger) in your listing description and photos.
- Regularly check competitor amenities in Palavas-les-Flots to stay competitive.
Palavas-les-Flots Airbnb Guest Demographics & Profile Analysis (2025)
Guest Profile Summary for Palavas-les-Flots
- The typical guest profile for Airbnb in Palavas-les-Flots consists of primarily domestic travelers (81%), often arriving from nearby Paris, typically belonging to the Post-2000s (Gen Z/Alpha) group (50%), primarily speaking French or English.
- Domestic travelers account for 81.4% of guests.
- Key international markets include France (81.4%) and Germany (4.9%).
- Top languages spoken are French (42.6%) followed by English (30.2%).
- A significant demographic segment is the Post-2000s (Gen Z/Alpha) group, representing 50% of guests.
Recommendations for Hosts
- Target domestic marketing efforts towards travelers from Paris and Lyon.
- Tailor amenities and listing descriptions to appeal to the dominant Post-2000s (Gen Z/Alpha) demographic (e.g., highlight fast WiFi, smart home features, local guides).
- Highlight unique local experiences or amenities relevant to the primary guest profile.
- Consider seasonal promotions aligned with peak travel times for key origin markets.
Nearby Short-Term Rental Market Comparison
How does the Palavas-les-Flots Airbnb market stack up against its neighbors? Compare key performance metrics like average monthly revenue, ADR, and occupancy rates in surrounding areas to understand the broader regional STR landscape.
| Market | Active Properties | Monthly Revenue | Daily Rate | Avg. Occupancy |
|---|---|---|---|---|
| Cornellà del Terri | 17 | $4,960 | $460.96 | 41% |
| Amer | 10 | $4,848 | $397.58 | 40% |
| Porqueres | 12 | $4,714 | $469.05 | 36% |
| Villeneuvette | 13 | $4,150 | $337.56 | 44% |
| Divajeu | 19 | $3,941 | $410.65 | 42% |
| Bordils | 11 | $3,557 | $525.15 | 36% |
| Vilademuls | 20 | $3,489 | $328.54 | 36% |
| Vilanant | 10 | $3,424 | $343.93 | 34% |
| Bàscara | 13 | $3,317 | $437.52 | 39% |
| Castelnou | 12 | $3,274 | $302.12 | 31% |