Nant Airbnb Market Analysis 2025: Short Term Rental Data & Vacation Rental Statistics in Occitania, France
Is Airbnb profitable in Nant in 2025? Explore comprehensive Airbnb analytics for Nant, Occitania, France to uncover income potential. This 2025 STR market report for Nant, based on AirROI data from April 2024 to March 2025, reveals key trends in the niche market of 21 active listings.
Whether you're considering an Airbnb investment in Nant, optimizing your existing vacation rental, or exploring rental arbitrage opportunities, understanding the Nant Airbnb data is crucial. Leveraging the low regulation environment is key to maximizing your short term rental income potential. Let's dive into the specifics.
Key Nant Airbnb Performance Metrics Overview
Monthly Airbnb Revenue Variations & Income Potential in Nant (2025)
Understanding the monthly revenue variations for Airbnb listings in Nant is key to maximizing your short term rental income potential. Seasonality significantly impacts earnings. Our analysis, based on data from the past 12 months, shows that the peak revenue month for STRs in Nant is typically August, while March often presents the lowest earnings, highlighting opportunities for strategic pricing adjustments during shoulder and low seasons. Explore the typical Airbnb income in Nant across different performance tiers:
- Best-in-class properties (Top 10%) achieve $2,316+ monthly, often utilizing dynamic pricing and superior guest experiences.
- Strong performing properties (Top 25%) earn $1,428 or more, indicating effective management and desirable locations/amenities.
- Typical properties (Median) generate around $810 per month, representing the average market performance.
- Entry-level properties (Bottom 25%) see earnings around $435, often with potential for optimization.
Average Monthly Airbnb Earnings Trend in Nant
Nant Airbnb Occupancy Rate Trends (2025)
Maximize your bookings by understanding the Nant STR occupancy trends. Seasonal demand shifts significantly influence how often properties are booked. Typically, Augustsees the highest demand (peak season occupancy), while March experiences the lowest (low season). Effective strategies, like adjusting minimum stays or offering promotions, can boost occupancy during slower periods. Here's how different property tiers perform in Nant:
- Best-in-class properties (Top 10%) achieve 65%+ occupancy, indicating high desirability and potentially optimized availability.
- Strong performing properties (Top 25%) maintain 52% or higher occupancy, suggesting good market fit and guest satisfaction.
- Typical properties (Median) have an occupancy rate around 29%.
- Entry-level properties (Bottom 25%) average 20% occupancy, potentially facing higher vacancy.
Average Monthly Occupancy Rate Trend in Nant
Average Daily Rate (ADR) Airbnb Trends in Nant (2025)
Effective short term rental pricing strategy in Nant involves understanding monthly ADR fluctuations. The Average Daily Rate (ADR) for Airbnb in Nant typically peaks in January and dips lowest during October. Leveraging Airbnb dynamic pricing tools or strategies based on this seasonality can significantly boost revenue. Here's a look at the typical nightly rates achieved:
- Best-in-class properties (Top 10%) command rates of $180+ per night, often due to premium features or locations.
- Strong performing properties (Top 25%) achieve nightly rates of $112 or more.
- Typical properties (Median) charge around $84 per night.
- Entry-level properties (Bottom 25%) earn around $61 per night.
Average Daily Rate (ADR) Trend by Month in Nant
Get Live Nant Market Intelligence 👇

Explore Real-time Analytics
Airbnb Seasonality Analysis & Trends in Nant (2025)
Peak Season (August, July, November)
- Revenue averages $1,693 per month
- Occupancy rates average 57.8%
- Daily rates average $113
Shoulder Season
- Revenue averages $1,021 per month
- Occupancy maintains around 31.8%
- Daily rates hold near $105
Low Season (January, February, March)
- Revenue drops to average $547 per month
- Occupancy decreases to average 20.0%
- Daily rates adjust to average $116
Seasonality Insights for Nant
- The Airbnb seasonality in Nant shows highly seasonal trends requiring careful strategy. While the sections above show seasonal averages, it's also insightful to look at the extremes:
- During the high season, the absolute peak month showcases Nant's highest earning potential, with monthly revenues capable of climbing to $1,956, occupancy reaching a high of 64.7%, and ADRs peaking at $118.
- Conversely, the slowest single month of the year, typically falling within the low season, marks the market's lowest point. In this month, revenue might dip to $359, occupancy could drop to 14.5%, and ADRs may adjust down to $101.
- Understanding both the seasonal averages and these monthly peaks and troughs in revenue, occupancy, and ADR is crucial for maximizing your Airbnb profit potential in Nant.
Seasonal Strategies for Maximizing Profit
- Peak Season: Maximize revenue through premium pricing and potentially longer minimum stays. Ensure high availability.
- Low Season: Offer competitive pricing, special promotions (e.g., extended stay discounts), and flexible cancellation policies. Target off-season travelers like remote workers or budget-conscious guests.
- Shoulder Seasons: Implement dynamic pricing that balances peak and low rates. Target weekend travelers or specific events. Offer slightly more flexible terms than peak season.
- Regularly analyze your own performance against these Nant seasonality benchmarks and adjust your pricing and availability strategy accordingly.
Best Areas for Airbnb Investment in Nant (2025)
Exploring the top neighborhoods for short-term rentals in Nant? This section highlights key areas, outlining why they are attractive for hosts and guests, along with notable local attractions. Consider these locations based on your target guest profile and investment strategy.
| Neighborhood / Area | Why Host Here? (Target Guests & Appeal) | Key Attractions & Landmarks |
|---|---|---|
| Nîmes | Historic city known for its Roman architecture, including the well-preserved amphitheater. It's a popular tourist destination, drawing visitors for its rich history and cultural heritage. | Nîmes Arena, Maison Carrée, Pont du Gard, Les Jardins de la Fontaine, Temple of Diane |
| Avignon | Famous for the Palais des Papes and its annual theater festival, Avignon attracts tourists looking for culture and history. The city is picturesque with its medieval walls and vibrant community. | Palais des Papes, Pont Saint-Bénézet, Avignon Festival, Rocher des Doms, Les Halles d'Avignon |
| Montpellier | A vibrant student city with a dynamic cultural scene, Montpellier is known for its architecture and Mediterranean beaches close by. It's perfect for hosting younger travelers and tourists alike. | Place de la Comédie, Montpellier Zoo, Musée Fabre, Jardin des Plantes, Esplanade Charles de Gaulle |
| Sète | A charming coastal town, Sète is known for its canals, beaches, and seafood cuisine. It's attractive to beachgoers and food enthusiasts during the summer months. | Mont Saint-Clair, Seafood markets, Sète beaches, Canal Royal, Fishermen's Festivals |
| Carcassonne | Famous for its medieval fortress, Carcassonne is a UNESCO World Heritage site. This area appeals to those interested in history and medieval architecture. | Cité de Carcassonne, Basilica of Saint-Nazaire, Castle of Carcassonne, Canal du Midi, Carcassonne Festival |
| Alès | Known for its proximity to natural parks and attractions, Alès attracts visitors who enjoy outdoor activities. It’s a perfect base for exploring the Cévennes National Park. | Cévennes National Park, La Bambouseraie, Musee du Verre, Aquarium de la Cèze, Temple de Diane |
| Béziers | With a rich wine heritage and beautiful canals, Béziers is a destination for wine lovers and those looking to experience Southern French culture. | Canal du Midi, Les Neuf Écluses, Saint-Nazaire Cathedral, Béziers Festival, Wine tasting tours |
| Céret | Located in the Pyrénées-Orientales, Céret is known for its art galleries and connection to famous artists. It’s ideal for cultural tourism and those seeking art experiences. | Musée d'Art Moderne, Ceret Cherry Festival, Pont du Diable, Céret Art Walk, Céret’s Farmers Market |
Understanding Airbnb License Requirements & STR Laws in Nant (2025)
While Nant, Occitania, France currently shows low STR regulations, specific Airbnb license requirements might still exist or change. Always verify the latest short term rental regulations and Airbnb license requirements directly with local government authorities for Nant to ensure full compliance before hosting.
(Source: AirROI data, 2025, finding no licensed listings among those analyzed)
Top Performing Airbnb Properties in Nant (2025)
Benchmark your potential! Explore examples of top-performing Airbnb properties in Nantbased on Trailing Twelve Month (TTM) revenue. Analyze their characteristics, revenue, occupancy rate, and ADR to understand what drives success in this market.
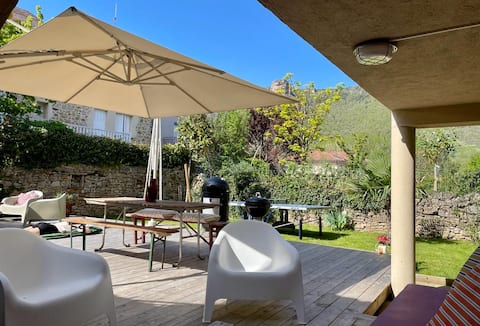
Pleasant house with nature view village center
Entire Place • 3 bedrooms
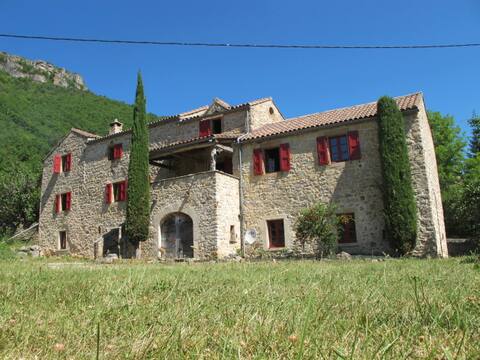
Typical house in the Gorges de la Dourbie
Entire Place • 2 bedrooms
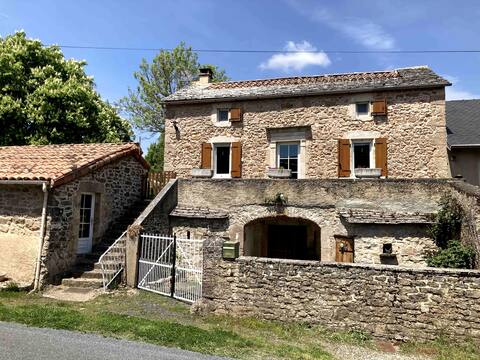
Welcome "Chez Nous", charming cottage
Entire Place • 4 bedrooms
La "Doucette"
Entire Place • 2 bedrooms

5 sleeping cottage with private garden and terrace
Entire Place • 3 bedrooms
Rent La Liquisse Haute
Entire Place • 2 bedrooms
Note: Performance varies based on location, size, amenities, seasonality, and management quality. Data reflects the past 12 months.
Top Performing Airbnb Hosts in Nant (2025)
Learn from the best! This table showcases top-performing Airbnb hosts in Nant based on the number of properties managed and estimated total revenue over the past year. Analyze their scale and performance metrics.
| Host Name | Properties | Grossing Revenue | Stay Reviews | Avg Rating |
|---|---|---|---|---|
| Marion | 1 | $20,588 | 3 | 5.00/5.0 |
| Claire | 1 | $19,921 | 78 | 4.92/5.0 |
| Cécile | 2 | $15,421 | 9 | 2.38/5.0 |
| Franboise | 1 | $12,776 | 20 | 4.90/5.0 |
| Guy | 1 | $11,194 | 41 | 4.63/5.0 |
| Pierre-Marie | 1 | $10,527 | 18 | 4.72/5.0 |
| Laurence | 1 | $10,287 | 21 | 4.81/5.0 |
| CléMarie | 1 | $10,147 | 11 | 4.91/5.0 |
| Host #27690512 | 2 | $9,376 | 2 | 0.00/5.0 |
| Claudie | 2 | $9,281 | 78 | 4.92/5.0 |
Analyzing the strategies of top hosts, such as their property selection, pricing, and guest communication, can offer valuable lessons for optimizing your own Airbnb operations in Nant.
Dive Deeper: Advanced Nant STR Market Data (2025)
Ready to unlock more insights? AirROI provides access to advanced metrics and comprehensive Airbnb data for Nant. Explore detailed analytics beyond this report to refine your investment strategy, optimize pricing, and maximize your vacation rental profits.
Explore Advanced MetricsNant Short-Term Rental Market Composition (2025): Property & Room Types
Room Type Distribution
Property Type Distribution
Market Composition Insights for Nant
- The Nant Airbnb market composition is heavily skewed towards Entire Home/Apt listings, which make up 81% of the 21 active rentals. This indicates strong guest preference for privacy and space.
- Looking at the property type distribution in Nant, House properties are the most common (81%), reflecting the local real estate landscape.
- Houses represent a significant 81% portion, catering likely to families or larger groups.
- Smaller segments like hotel/boutique, outdoor/unique (combined 9.6%) offer potential for unique stay experiences.
Nant Airbnb Room Capacity Analysis (2025): Bedroom Distribution
Distribution of Listings by Number of Bedrooms
Room Capacity Insights for Nant
- The dominant room capacity in Nant is 2 bedrooms listings, making up 33.3% of the market. This suggests a strong demand for properties suitable for couples or solo travelers.
- Together, 2 bedrooms and 1 bedroom properties represent 61.9% of the active Airbnb listings in Nant, indicating a high concentration in these sizes.
- A significant 38.1% of listings offer 3+ bedrooms, catering to larger groups and families seeking more space in Nant.
Nant Vacation Rental Guest Capacity Trends (2025)
Distribution of Listings by Guest Capacity
Guest Capacity Insights for Nant
- The most common guest capacity trend in Nant vacation rentals is listings accommodating 4 guests (33.3%). This suggests the primary traveler segment is likely small families or groups.
- Properties designed for 4 guests and 6 guests dominate the Nant STR market, accounting for 57.1% of listings.
- 33.3% of properties accommodate 6+ guests, serving the market segment for larger families or group travel in Nant.
- On average, properties in Nant are equipped to host 4.3 guests.
Nant Airbnb Booking Patterns (2025): Available vs. Booked Days
Available Days Distribution
Booked Days Distribution
Booking Pattern Insights for Nant
- The most common availability pattern in Nant falls within the 271-366 days range, representing 61.9% of listings. This suggests many properties have significant open periods on their calendars.
- Approximately 100.0% of listings show high availability (181+ days open annually), indicating potential for increased bookings or specific owner usage patterns.
- For booked days, the 91-180 days range is most frequent in Nant (38.1%), reflecting common guest stay durations or potential owner blocking patterns.
- A notable 4.8% of properties secure long booking periods (181+ days booked per year), highlighting successful long-term rental strategies or significant owner usage.
Nant Airbnb Minimum Stay Requirements Analysis
Distribution of Listings by Minimum Night Requirement
1 Night
4 listings
19% of total
2 Nights
4 listings
19% of total
3 Nights
4 listings
19% of total
4-6 Nights
6 listings
28.6% of total
7-29 Nights
1 listings
4.8% of total
30+ Nights
2 listings
9.5% of total
Key Insights
- The most prevalent minimum stay requirement in Nant is 4-6 Nights, adopted by 28.6% of listings. This highlights the market's preference for longer commitments.
Recommendations
- Align with the market by considering a 4-6 Nights minimum stay, as 28.6% of Nant hosts use this setting.
- If feasible, allowing 1-night stays, especially midweek or during low season, could capture last-minute bookings, as only 19% currently do.
- Explore offering discounts for stays of 30+ nights to attract the 9.5% of the market seeking extended stays.
- Adjust minimum nights based on seasonality – potentially shorter during low season and longer during peak demand periods in Nant.
Nant Airbnb Cancellation Policy Trends Analysis (2025)
Flexible
2 listings
12.5% of total
Moderate
4 listings
25% of total
Firm
6 listings
37.5% of total
Strict
4 listings
25% of total
Cancellation Policy Insights for Nant
- The prevailing Airbnb cancellation policy trend in Nant is Firm, used by 37.5% of listings.
- A majority (62.5%) of hosts in Nant utilize Firm or Strict policies, indicating a market where hosts prioritize booking security.
Recommendations for Hosts
- Consider adopting a Firm policy to align with the 37.5% market standard in Nant.
- Regularly review your cancellation policy against competitors and market demand shifts in Nant.
Nant STR Booking Lead Time Analysis (2025)
Average Booking Lead Time by Month
Booking Lead Time Insights for Nant
- The overall average booking lead time for vacation rentals in Nant is 68 days.
- Guests book furthest in advance for stays during August (average 108 days), likely coinciding with peak travel demand or local events.
- The shortest booking windows occur for stays in February (average 31 days), indicating more last-minute travel plans during this time.
- Seasonally, Summer (84 days avg.) sees the longest lead times, while Winter (54 days avg.) has the shortest, reflecting typical travel planning cycles.
Recommendations for Hosts
- Use the overall average lead time (68 days) as a baseline for your pricing and availability strategy in Nant.
- For August stays, consider implementing length-of-stay discounts or slightly higher rates for bookings made less than 108 days out to capitalize on advance planning.
- Target marketing efforts for the Summer season well in advance (at least 84 days) to capture early planners.
- Monitor your own booking lead times against these Nant averages to identify opportunities for dynamic pricing adjustments.
Popular & Essential Airbnb Amenities in Nant (2025)
Amenity Prevalence
Amenity Insights for Nant
- Essential amenities in Nant that guests expect include: Hot water, Heating, Kitchen. Lacking these (any) could significantly impact bookings.
- Popular amenities like Washer, Smoke alarm, Wifi are common but not universal. Offering these can provide a competitive edge.
- Warning: Wifi is not universally provided but is considered essential globally. Ensure reliable Wifi is offered.
Recommendations for Hosts
- Ensure your listing includes all essential amenities for Nant: Hot water, Heating, Kitchen.
- Prioritize adding missing essentials: Hot water, Heating, Kitchen.
- Consider adding popular differentiators like Washer or Smoke alarm to increase appeal.
- Highlight unique or less common amenities you offer (e.g., hot tub, dedicated workspace, EV charger) in your listing description and photos.
- Regularly check competitor amenities in Nant to stay competitive.
Nant Airbnb Guest Demographics & Profile Analysis (2025)
Guest Profile Summary for Nant
- The typical guest profile for Airbnb in Nant consists of primarily domestic travelers (91%), often arriving from nearby Paris, typically belonging to the Post-2000s (Gen Z/Alpha) group (50%), primarily speaking French or English.
- Domestic travelers account for 91.2% of guests.
- Key international markets include France (91.2%) and Germany (2.9%).
- Top languages spoken are French (48.6%) followed by English (34.3%).
- A significant demographic segment is the Post-2000s (Gen Z/Alpha) group, representing 50% of guests.
Recommendations for Hosts
- Target domestic marketing efforts towards travelers from Paris and Toulouse.
- Tailor amenities and listing descriptions to appeal to the dominant Post-2000s (Gen Z/Alpha) demographic (e.g., highlight fast WiFi, smart home features, local guides).
- Highlight unique local experiences or amenities relevant to the primary guest profile.
- Consider seasonal promotions aligned with peak travel times for key origin markets.
Nearby Short-Term Rental Market Comparison
How does the Nant Airbnb market stack up against its neighbors? Compare key performance metrics like average monthly revenue, ADR, and occupancy rates in surrounding areas to understand the broader regional STR landscape.
| Market | Active Properties | Monthly Revenue | Daily Rate | Avg. Occupancy |
|---|---|---|---|---|
| Villeneuvette | 13 | $4,150 | $337.56 | 44% |
| Divajeu | 19 | $3,941 | $410.65 | 42% |
| Saint-Germain-au-Mont-d'Or | 10 | $3,928 | $316.02 | 40% |
| Dommartin | 11 | $3,905 | $327.00 | 36% |
| Courzieu | 11 | $3,267 | $287.83 | 52% |
| Vanosc | 13 | $3,072 | $224.52 | 44% |
| Redessan | 19 | $2,834 | $334.82 | 34% |
| Fontarèches | 11 | $2,802 | $525.31 | 34% |
| La Bruguière | 14 | $2,732 | $277.64 | 50% |
| Verquières | 13 | $2,688 | $424.97 | 49% |