Mudaison Airbnb Market Analysis 2025: Short Term Rental Data & Vacation Rental Statistics in Occitania, France
Is Airbnb profitable in Mudaison in 2025? Explore comprehensive Airbnb analytics for Mudaison, Occitania, France to uncover income potential. This 2025 STR market report for Mudaison, based on AirROI data from April 2024 to March 2025, reveals key trends in the niche market of 32 active listings.
Whether you're considering an Airbnb investment in Mudaison, optimizing your existing vacation rental, or exploring rental arbitrage opportunities, understanding the Mudaison Airbnb data is crucial. Leveraging the low regulation environment is key to maximizing your short term rental income potential. Let's dive into the specifics.
Key Mudaison Airbnb Performance Metrics Overview
Monthly Airbnb Revenue Variations & Income Potential in Mudaison (2025)
Understanding the monthly revenue variations for Airbnb listings in Mudaison is key to maximizing your short term rental income potential. Seasonality significantly impacts earnings. Our analysis, based on data from the past 12 months, shows that the peak revenue month for STRs in Mudaison is typically August, while March often presents the lowest earnings, highlighting opportunities for strategic pricing adjustments during shoulder and low seasons. Explore the typical Airbnb income in Mudaison across different performance tiers:
- Best-in-class properties (Top 10%) achieve $3,429+ monthly, often utilizing dynamic pricing and superior guest experiences.
- Strong performing properties (Top 25%) earn $2,389 or more, indicating effective management and desirable locations/amenities.
- Typical properties (Median) generate around $1,142 per month, representing the average market performance.
- Entry-level properties (Bottom 25%) see earnings around $607, often with potential for optimization.
Average Monthly Airbnb Earnings Trend in Mudaison
Mudaison Airbnb Occupancy Rate Trends (2025)
Maximize your bookings by understanding the Mudaison STR occupancy trends. Seasonal demand shifts significantly influence how often properties are booked. Typically, Augustsees the highest demand (peak season occupancy), while March experiences the lowest (low season). Effective strategies, like adjusting minimum stays or offering promotions, can boost occupancy during slower periods. Here's how different property tiers perform in Mudaison:
- Best-in-class properties (Top 10%) achieve 79%+ occupancy, indicating high desirability and potentially optimized availability.
- Strong performing properties (Top 25%) maintain 60% or higher occupancy, suggesting good market fit and guest satisfaction.
- Typical properties (Median) have an occupancy rate around 33%.
- Entry-level properties (Bottom 25%) average 18% occupancy, potentially facing higher vacancy.
Average Monthly Occupancy Rate Trend in Mudaison
Average Daily Rate (ADR) Airbnb Trends in Mudaison (2025)
Effective short term rental pricing strategy in Mudaison involves understanding monthly ADR fluctuations. The Average Daily Rate (ADR) for Airbnb in Mudaison typically peaks in August and dips lowest during March. Leveraging Airbnb dynamic pricing tools or strategies based on this seasonality can significantly boost revenue. Here's a look at the typical nightly rates achieved:
- Best-in-class properties (Top 10%) command rates of $334+ per night, often due to premium features or locations.
- Strong performing properties (Top 25%) achieve nightly rates of $228 or more.
- Typical properties (Median) charge around $120 per night.
- Entry-level properties (Bottom 25%) earn around $66 per night.
Average Daily Rate (ADR) Trend by Month in Mudaison
Get Live Mudaison Market Intelligence 👇

Explore Real-time Analytics
Airbnb Seasonality Analysis & Trends in Mudaison (2025)
Peak Season (August, July, June)
- Revenue averages $3,119 per month
- Occupancy rates average 54.7%
- Daily rates average $210
Shoulder Season
- Revenue averages $1,440 per month
- Occupancy maintains around 36.9%
- Daily rates hold near $188
Low Season (February, March, December)
- Revenue drops to average $549 per month
- Occupancy decreases to average 27.9%
- Daily rates adjust to average $147
Seasonality Insights for Mudaison
- The Airbnb seasonality in Mudaison shows highly seasonal trends requiring careful strategy. While the sections above show seasonal averages, it's also insightful to look at the extremes:
- During the high season, the absolute peak month showcases Mudaison's highest earning potential, with monthly revenues capable of climbing to $3,777, occupancy reaching a high of 72.5%, and ADRs peaking at $211.
- Conversely, the slowest single month of the year, typically falling within the low season, marks the market's lowest point. In this month, revenue might dip to $396, occupancy could drop to 21.5%, and ADRs may adjust down to $146.
- Understanding both the seasonal averages and these monthly peaks and troughs in revenue, occupancy, and ADR is crucial for maximizing your Airbnb profit potential in Mudaison.
Seasonal Strategies for Maximizing Profit
- Peak Season: Maximize revenue through premium pricing and potentially longer minimum stays. Ensure high availability.
- Low Season: Offer competitive pricing, special promotions (e.g., extended stay discounts), and flexible cancellation policies. Target off-season travelers like remote workers or budget-conscious guests.
- Shoulder Seasons: Implement dynamic pricing that balances peak and low rates. Target weekend travelers or specific events. Offer slightly more flexible terms than peak season.
- Regularly analyze your own performance against these Mudaison seasonality benchmarks and adjust your pricing and availability strategy accordingly.
Best Areas for Airbnb Investment in Mudaison (2025)
Exploring the top neighborhoods for short-term rentals in Mudaison? This section highlights key areas, outlining why they are attractive for hosts and guests, along with notable local attractions. Consider these locations based on your target guest profile and investment strategy.
| Neighborhood / Area | Why Host Here? (Target Guests & Appeal) | Key Attractions & Landmarks |
|---|---|---|
| Centre Ville | The heart of Mudaison, offering easy access to local shops, restaurants, and transport links. Ideal for city visitors looking for convenience and local culture. | Eglise Saint-Saturnin, local market, café terraces, historical architecture |
| Parc de Loisirs | A recreational area popular with families and outdoor enthusiasts, providing activities and green spaces. Attractive for tourists seeking leisure and nature. | playgrounds, walking trails, sports facilities, picnic areas |
| Château de Mudaison | Historical site and landmark with beautiful views and cultural significance. Great for guests interested in history and heritage. | Château grounds, guided tours, scenic viewpoints |
| Les Vignobles | Surrounding vineyards and wineries, offering immersive wine tours and tastings. Perfect for wine lovers and those seeking rural charm. | wine tastings, vineyard tours, scenic drives |
| La Combe de la Vigne | A picturesque natural area ideal for hiking and exploring the French countryside. Appeals to outdoor lovers and nature enthusiasts. | hiking trails, nature observation, beautiful landscapes |
| Le Petit Marché | A quaint and vibrant market area that showcases local produce and crafts. Attracts visitors looking for authentic local experiences. | artisanal shops, local produce stalls, community events |
| Les Rives du Vergue | A scenic area along the Vergue river, offering tranquility and beautiful views. Perfect for those seeking peace and relaxation. | river walks, nature spots, wildlife viewing |
| La Gare | Convenient location near the train station for travelers looking to explore greater Occitania. Great for accessibility and transport connections. | train services, local eateries, easy access to nearby towns |
Understanding Airbnb License Requirements & STR Laws in Mudaison (2025)
While Mudaison, Occitania, France currently shows low STR regulations, specific Airbnb license requirements might still exist or change. Always verify the latest short term rental regulations and Airbnb license requirements directly with local government authorities for Mudaison to ensure full compliance before hosting.
(Source: AirROI data, 2025, based on 6% licensed listings)
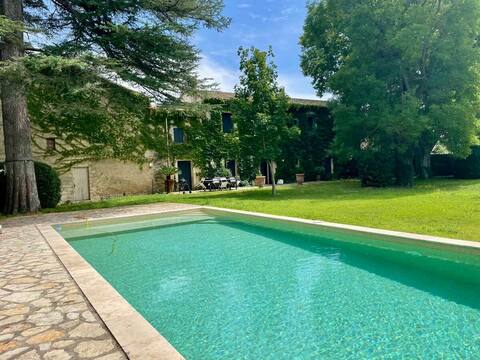
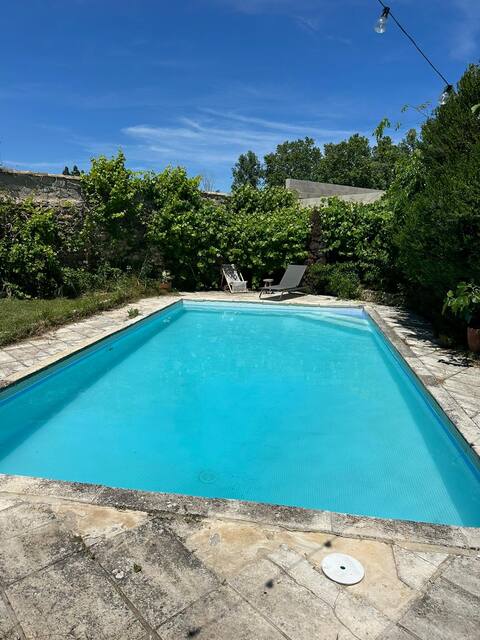
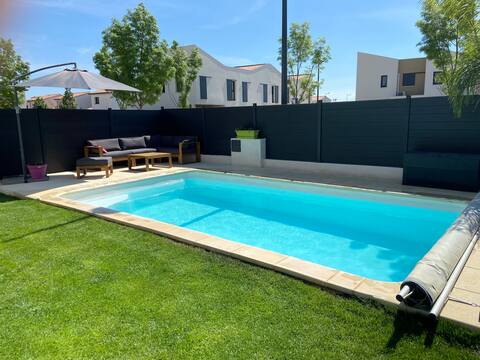
Top Performing Airbnb Properties in Mudaison (2025)
Benchmark your potential! Explore examples of top-performing Airbnb properties in Mudaisonbased on Trailing Twelve Month (TTM) revenue. Analyze their characteristics, revenue, occupancy rate, and ADR to understand what drives success in this market.
The Grand Mas Domaine du Moulin de Perdrix
Entire Place • 4 bedrooms

VILLA AVEC PISCINE PROCHE MONTPELLIER ET PLAGES
Entire Place • 4 bedrooms
Villa Isabelle- Large bright house with courtyard
Entire Place • 3 bedrooms
Joli Mas duplex piscine parking
Entire Place • 1 bedroom
Very nice villa with pool
Entire Place • 3 bedrooms
Modern villa with swimming pool all comforts
Entire Place • 2 bedrooms
Note: Performance varies based on location, size, amenities, seasonality, and management quality. Data reflects the past 12 months.
Top Performing Airbnb Hosts in Mudaison (2025)
Learn from the best! This table showcases top-performing Airbnb hosts in Mudaison based on the number of properties managed and estimated total revenue over the past year. Analyze their scale and performance metrics.
| Host Name | Properties | Grossing Revenue | Stay Reviews | Avg Rating |
|---|---|---|---|---|
| Manon | 2 | $81,413 | 27 | 4.39/5.0 |
| Host #77210287 | 1 | $32,510 | 92 | 4.91/5.0 |
| Corinne | 2 | $28,360 | 32 | 4.80/5.0 |
| Jessica | 2 | $22,720 | 224 | 2.45/5.0 |
| Françoise | 1 | $21,577 | 8 | 3.88/5.0 |
| Sebastien | 1 | $21,264 | 3 | 5.00/5.0 |
| Sophie | 1 | $20,449 | 15 | 5.00/5.0 |
| Mélanie | 3 | $19,797 | 47 | 4.89/5.0 |
| Elodie | 1 | $17,812 | 5 | 4.80/5.0 |
| Stephane | 2 | $17,087 | 16 | 4.67/5.0 |
Analyzing the strategies of top hosts, such as their property selection, pricing, and guest communication, can offer valuable lessons for optimizing your own Airbnb operations in Mudaison.
Dive Deeper: Advanced Mudaison STR Market Data (2025)
Ready to unlock more insights? AirROI provides access to advanced metrics and comprehensive Airbnb data for Mudaison. Explore detailed analytics beyond this report to refine your investment strategy, optimize pricing, and maximize your vacation rental profits.
Explore Advanced MetricsMudaison Short-Term Rental Market Composition (2025): Property & Room Types
Room Type Distribution
Property Type Distribution
Market Composition Insights for Mudaison
- The Mudaison Airbnb market composition is heavily skewed towards Entire Home/Apt listings, which make up 75% of the 32 active rentals. This indicates strong guest preference for privacy and space.
- Looking at the property type distribution in Mudaison, House properties are the most common (81.3%), reflecting the local real estate landscape.
- Houses represent a significant 81.3% portion, catering likely to families or larger groups.
- Smaller segments like hotel/boutique (combined 3.1%) offer potential for unique stay experiences.
Mudaison Airbnb Room Capacity Analysis (2025): Bedroom Distribution
Distribution of Listings by Number of Bedrooms
Room Capacity Insights for Mudaison
- The dominant room capacity in Mudaison is 3 bedrooms listings, making up 28.1% of the market. This suggests a strong demand for properties suitable for families or small groups.
- Together, 3 bedrooms and 1 bedroom properties represent 53.1% of the active Airbnb listings in Mudaison, indicating a high concentration in these sizes.
- A significant 37.5% of listings offer 3+ bedrooms, catering to larger groups and families seeking more space in Mudaison.
Mudaison Vacation Rental Guest Capacity Trends (2025)
Distribution of Listings by Guest Capacity
Guest Capacity Insights for Mudaison
- The most common guest capacity trend in Mudaison vacation rentals is listings accommodating 6 guests (21.9%). This suggests the primary traveler segment is likely larger groups.
- Properties designed for 6 guests and 4 guests dominate the Mudaison STR market, accounting for 40.7% of listings.
- 37.5% of properties accommodate 6+ guests, serving the market segment for larger families or group travel in Mudaison.
- On average, properties in Mudaison are equipped to host 3.9 guests.
Mudaison Airbnb Booking Patterns (2025): Available vs. Booked Days
Available Days Distribution
Booked Days Distribution
Booking Pattern Insights for Mudaison
- The most common availability pattern in Mudaison falls within the 271-366 days range, representing 56.3% of listings. This suggests many properties have significant open periods on their calendars.
- Approximately 87.6% of listings show high availability (181+ days open annually), indicating potential for increased bookings or specific owner usage patterns.
- For booked days, the 31-90 days range is most frequent in Mudaison (37.5%), reflecting common guest stay durations or potential owner blocking patterns.
- A notable 15.6% of properties secure long booking periods (181+ days booked per year), highlighting successful long-term rental strategies or significant owner usage.
Mudaison Airbnb Minimum Stay Requirements Analysis
Distribution of Listings by Minimum Night Requirement
1 Night
5 listings
16.7% of total
2 Nights
7 listings
23.3% of total
3 Nights
8 listings
26.7% of total
4-6 Nights
4 listings
13.3% of total
7-29 Nights
3 listings
10% of total
30+ Nights
3 listings
10% of total
Key Insights
- The most prevalent minimum stay requirement in Mudaison is 3 Nights, adopted by 26.7% of listings. This highlights the market's preference for longer commitments.
Recommendations
- Align with the market by considering a 3 Nights minimum stay, as 26.7% of Mudaison hosts use this setting.
- If feasible, allowing 1-night stays, especially midweek or during low season, could capture last-minute bookings, as only 16.7% currently do.
- Explore offering discounts for stays of 30+ nights to attract the 10% of the market seeking extended stays.
- Adjust minimum nights based on seasonality – potentially shorter during low season and longer during peak demand periods in Mudaison.
Mudaison Airbnb Cancellation Policy Trends Analysis (2025)
Flexible
9 listings
31% of total
Moderate
11 listings
37.9% of total
Firm
2 listings
6.9% of total
Strict
7 listings
24.1% of total
Cancellation Policy Insights for Mudaison
- The prevailing Airbnb cancellation policy trend in Mudaison is Moderate, used by 37.9% of listings.
- There's a relatively balanced mix between guest-friendly (68.9%) and stricter (31.0%) policies, offering choices for different guest needs.
Recommendations for Hosts
- Consider adopting a Moderate policy to align with the 37.9% market standard in Mudaison.
- Regularly review your cancellation policy against competitors and market demand shifts in Mudaison.
Mudaison STR Booking Lead Time Analysis (2025)
Average Booking Lead Time by Month
Booking Lead Time Insights for Mudaison
- The overall average booking lead time for vacation rentals in Mudaison is 46 days.
- Guests book furthest in advance for stays during September (average 73 days), likely coinciding with peak travel demand or local events.
- The shortest booking windows occur for stays in March (average 23 days), indicating more last-minute travel plans during this time.
- Seasonally, Summer (59 days avg.) sees the longest lead times, while Winter (38 days avg.) has the shortest, reflecting typical travel planning cycles.
Recommendations for Hosts
- Use the overall average lead time (46 days) as a baseline for your pricing and availability strategy in Mudaison.
- For September stays, consider implementing length-of-stay discounts or slightly higher rates for bookings made less than 73 days out to capitalize on advance planning.
- Target marketing efforts for the Summer season well in advance (at least 59 days) to capture early planners.
- Monitor your own booking lead times against these Mudaison averages to identify opportunities for dynamic pricing adjustments.
Popular & Essential Airbnb Amenities in Mudaison (2025)
Amenity Prevalence
Amenity Insights for Mudaison
- Essential amenities in Mudaison that guests expect include: Heating, Wifi. Lacking these (any) could significantly impact bookings.
- Popular amenities like Hangers, Dishes and silverware, Free parking on premises are common but not universal. Offering these can provide a competitive edge.
Recommendations for Hosts
- Ensure your listing includes all essential amenities for Mudaison: Heating, Wifi.
- Prioritize adding missing essentials: Heating, Wifi.
- Consider adding popular differentiators like Hangers or Dishes and silverware to increase appeal.
- Highlight unique or less common amenities you offer (e.g., hot tub, dedicated workspace, EV charger) in your listing description and photos.
- Regularly check competitor amenities in Mudaison to stay competitive.
Mudaison Airbnb Guest Demographics & Profile Analysis (2025)
Guest Profile Summary for Mudaison
- The typical guest profile for Airbnb in Mudaison consists of primarily domestic travelers (85%), often arriving from nearby Paris, typically belonging to the Post-2000s (Gen Z/Alpha) group (50%), primarily speaking French or English.
- Domestic travelers account for 85.4% of guests.
- Key international markets include France (85.4%) and Spain (2%).
- Top languages spoken are French (47.1%) followed by English (32.1%).
- A significant demographic segment is the Post-2000s (Gen Z/Alpha) group, representing 50% of guests.
Recommendations for Hosts
- Target domestic marketing efforts towards travelers from Paris and Lyon.
- Tailor amenities and listing descriptions to appeal to the dominant Post-2000s (Gen Z/Alpha) demographic (e.g., highlight fast WiFi, smart home features, local guides).
- Highlight unique local experiences or amenities relevant to the primary guest profile.
- Consider seasonal promotions aligned with peak travel times for key origin markets.
Nearby Short-Term Rental Market Comparison
How does the Mudaison Airbnb market stack up against its neighbors? Compare key performance metrics like average monthly revenue, ADR, and occupancy rates in surrounding areas to understand the broader regional STR landscape.
| Market | Active Properties | Monthly Revenue | Daily Rate | Avg. Occupancy |
|---|---|---|---|---|
| Villeneuvette | 13 | $4,150 | $337.56 | 44% |
| Divajeu | 19 | $3,941 | $410.65 | 42% |
| Chantepérier | 20 | $3,057 | $281.60 | 37% |
| Rupià | 11 | $3,046 | $386.95 | 40% |
| Gordes | 225 | $2,913 | $366.32 | 43% |
| Redessan | 19 | $2,834 | $334.82 | 34% |
| Fontarèches | 11 | $2,802 | $525.31 | 34% |
| Ménerbes | 97 | $2,800 | $453.86 | 41% |
| La Bruguière | 14 | $2,732 | $277.64 | 50% |
| Soyans | 12 | $2,721 | $193.55 | 45% |