Montréal Airbnb Market Analysis 2025: Short Term Rental Data & Vacation Rental Statistics in Occitania, France
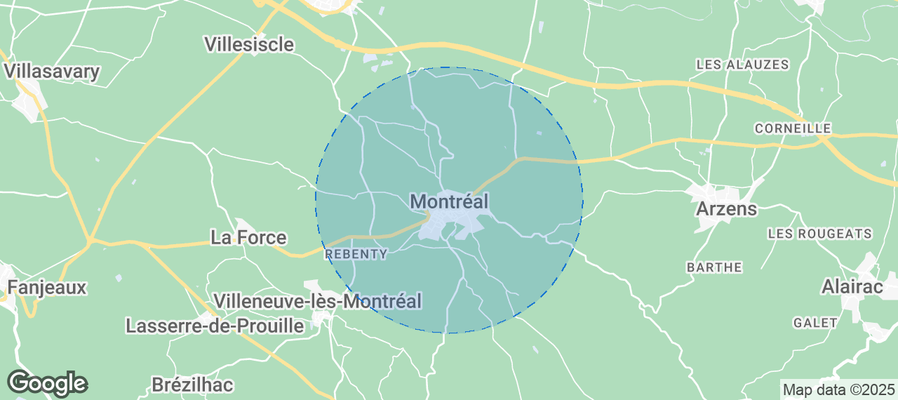
Is Airbnb profitable in Montréal in 2025? Explore comprehensive Airbnb analytics for Montréal, Occitania, France to uncover income potential. This 2025 STR market report for Montréal, based on AirROI data from April 2024 to March 2025, reveals key trends in the niche market of 49 active listings.
Whether you're considering an Airbnb investment in Montréal, optimizing your existing vacation rental, or exploring rental arbitrage opportunities, understanding the Montréal Airbnb data is crucial. Leveraging the low regulation environment is key to maximizing your short term rental income potential. Let's dive into the specifics.
Key Montréal Airbnb Performance Metrics Overview
Monthly Airbnb Revenue Variations & Income Potential in Montréal (2025)
Understanding the monthly revenue variations for Airbnb listings in Montréal is key to maximizing your short term rental income potential. Seasonality significantly impacts earnings. Our analysis, based on data from the past 12 months, shows that the peak revenue month for STRs in Montréal is typically August, while January often presents the lowest earnings, highlighting opportunities for strategic pricing adjustments during shoulder and low seasons. Explore the typical Airbnb income in Montréal across different performance tiers:
- Best-in-class properties (Top 10%) achieve $2,786+ monthly, often utilizing dynamic pricing and superior guest experiences.
- Strong performing properties (Top 25%) earn $1,413 or more, indicating effective management and desirable locations/amenities.
- Typical properties (Median) generate around $843 per month, representing the average market performance.
- Entry-level properties (Bottom 25%) see earnings around $414, often with potential for optimization.
Average Monthly Airbnb Earnings Trend in Montréal
Montréal Airbnb Occupancy Rate Trends (2025)
Maximize your bookings by understanding the Montréal STR occupancy trends. Seasonal demand shifts significantly influence how often properties are booked. Typically, Augustsees the highest demand (peak season occupancy), while January experiences the lowest (low season). Effective strategies, like adjusting minimum stays or offering promotions, can boost occupancy during slower periods. Here's how different property tiers perform in Montréal:
- Best-in-class properties (Top 10%) achieve 60%+ occupancy, indicating high desirability and potentially optimized availability.
- Strong performing properties (Top 25%) maintain 44% or higher occupancy, suggesting good market fit and guest satisfaction.
- Typical properties (Median) have an occupancy rate around 28%.
- Entry-level properties (Bottom 25%) average 14% occupancy, potentially facing higher vacancy.
Average Monthly Occupancy Rate Trend in Montréal
Average Daily Rate (ADR) Airbnb Trends in Montréal (2025)
Effective short term rental pricing strategy in Montréal involves understanding monthly ADR fluctuations. The Average Daily Rate (ADR) for Airbnb in Montréal typically peaks in July and dips lowest during March. Leveraging Airbnb dynamic pricing tools or strategies based on this seasonality can significantly boost revenue. Here's a look at the typical nightly rates achieved:
- Best-in-class properties (Top 10%) command rates of $325+ per night, often due to premium features or locations.
- Strong performing properties (Top 25%) achieve nightly rates of $182 or more.
- Typical properties (Median) charge around $113 per night.
- Entry-level properties (Bottom 25%) earn around $76 per night.
Average Daily Rate (ADR) Trend by Month in Montréal
Get Live Montréal Market Intelligence 👇
Explore Real-time Analytics
Airbnb Seasonality Analysis & Trends in Montréal (2025)
Peak Season (August, July, June)
- Revenue averages $1,924 per month
- Occupancy rates average 41.7%
- Daily rates average $184
Shoulder Season
- Revenue averages $1,128 per month
- Occupancy maintains around 28.1%
- Daily rates hold near $177
Low Season (January, February, March)
- Revenue drops to average $690 per month
- Occupancy decreases to average 25.9%
- Daily rates adjust to average $170
Seasonality Insights for Montréal
- The Airbnb seasonality in Montréal shows highly seasonal trends requiring careful strategy. While the sections above show seasonal averages, it's also insightful to look at the extremes:
- During the high season, the absolute peak month showcases Montréal's highest earning potential, with monthly revenues capable of climbing to $2,307, occupancy reaching a high of 52.1%, and ADRs peaking at $186.
- Conversely, the slowest single month of the year, typically falling within the low season, marks the market's lowest point. In this month, revenue might dip to $636, occupancy could drop to 19.2%, and ADRs may adjust down to $170.
- Understanding both the seasonal averages and these monthly peaks and troughs in revenue, occupancy, and ADR is crucial for maximizing your Airbnb profit potential in Montréal.
Seasonal Strategies for Maximizing Profit
- Peak Season: Maximize revenue through premium pricing and potentially longer minimum stays. Ensure high availability.
- Low Season: Offer competitive pricing, special promotions (e.g., extended stay discounts), and flexible cancellation policies. Target off-season travelers like remote workers or budget-conscious guests.
- Shoulder Seasons: Implement dynamic pricing that balances peak and low rates. Target weekend travelers or specific events. Offer slightly more flexible terms than peak season.
- Regularly analyze your own performance against these Montréal seasonality benchmarks and adjust your pricing and availability strategy accordingly.
Best Areas for Airbnb Investment in Montréal (2025)
Exploring the top neighborhoods for short-term rentals in Montréal? This section highlights key areas, outlining why they are attractive for hosts and guests, along with notable local attractions. Consider these locations based on your target guest profile and investment strategy.
| Neighborhood / Area | Why Host Here? (Target Guests & Appeal) | Key Attractions & Landmarks |
|---|---|---|
| Vieux-Montréal | Historic and picturesque neighborhood known for its cobblestone streets, European architecture, and rich history. Attracts tourists interested in culture, dining, and sightseeing. | Notre-Dame Basilica, Old Port of Montréal, Place Jacques-Cartier, Montreal Museum of Fine Arts, Pointe-à-Callière Museum |
| Plateau-Mont-Royal | Vibrant and trendy neighborhood famous for its artistic vibe, diverse culture, and culinary scene. Appeals to young travelers and those seeking a lively atmosphere. | Mount Royal Park, The Main (Boulevard Saint-Laurent), La Fontaine Park, Street art murals, Café culture |
| Downtown | The bustling city center is perfect for business travelers and tourists. Offers a mix of shopping, entertainment, and cultural experiences all in close proximity. | Montreal Museum of Fine Arts, Place-des-Arts, Underground City, St. Catherine Street, Bell Centre |
| Mile End | Up-and-coming neighborhood known for its hip cafes, boutiques, and a strong sense of community. Popular among younger travelers and creatives looking for a unique experience. | St. Viateur Bagel, Bernard Avenue, Jean-Talon Market, Art galleries, Live music venues |
| Saint-Henri | An emerging area with a mix of trendy cafes, parks, and young professionals. Great for those looking for a more residential experience while still close to downtown. | Lachine Canal, Atwater Market, Parc de la Promenade-Bellerive, Local breweries, Comfort food restaurants |
| Griffintown | A revitalized district combining industrial charm with modern living, it attracts tourists and locals alike with its restaurants and proximity to downtown. | Lachine Canal, Windsor Station, Restaurants and bars, Boutique shops, Museum of Contemporary Art |
| Outremont | Known for its beautiful homes and affluent atmosphere, this neighborhood is ideal for travelers looking for a quieter, upscale experience with easy access to the city. | Outremont Park, Saint-Viateur Park, Cinema Paradiso, Cafés and gourmet restaurants, Historic buildings |
| Little Italy | Famous for its rich Italian heritage and food scene. Highly attractive for tourists wanting to experience authentic Italian culture and cuisine. | Church of the Madonna della Difesa, Little Italy Market, Pizzeria Napoletana, Local cafes, La Fête des Neiges |
Understanding Airbnb License Requirements & STR Laws in Montréal (2025)
While Montréal, Occitania, France currently shows low STR regulations, specific Airbnb license requirements might still exist or change. Always verify the latest short term rental regulations and Airbnb license requirements directly with local government authorities for Montréal to ensure full compliance before hosting.
(Source: AirROI data, 2025, based on 2% licensed listings)
Top Performing Airbnb Properties in Montréal (2025)
Benchmark your potential! Explore examples of top-performing Airbnb properties in Montréalbased on Trailing Twelve Month (TTM) revenue. Analyze their characteristics, revenue, occupancy rate, and ADR to understand what drives success in this market.
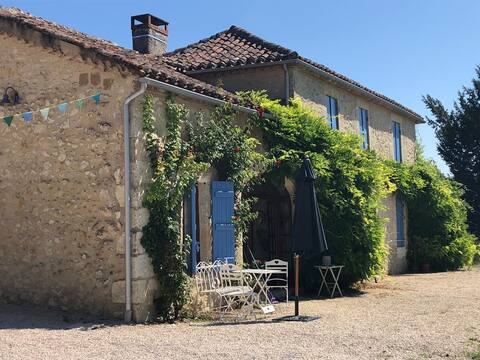
Peaceful and stylish Gascon farmhouse
Entire Place • 5 bedrooms
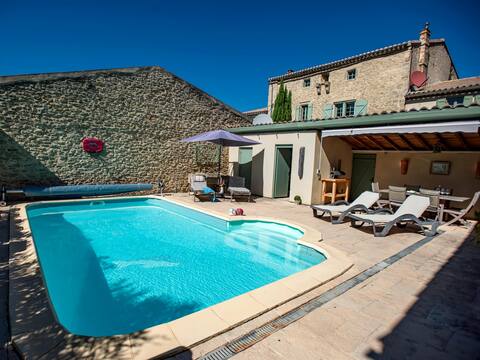
Renovated farmhouse with private pool
Entire Place • 3 bedrooms
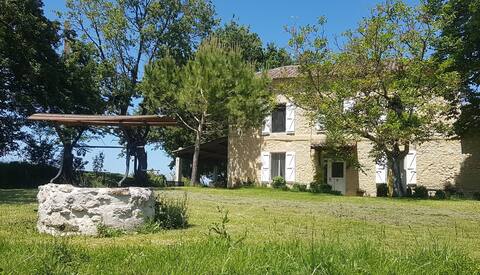
Stone cottage overlooking the countryside (11 guests)
Entire Place • 4 bedrooms
Domaine de Moreau
Entire Place • 6 bedrooms
Warm country home with hot tub
Entire Place • 3 bedrooms

Le Chat Moine Maison de Village du XVIIe
Entire Place • 4 bedrooms
Note: Performance varies based on location, size, amenities, seasonality, and management quality. Data reflects the past 12 months.
Top Performing Airbnb Hosts in Montréal (2025)
Learn from the best! This table showcases top-performing Airbnb hosts in Montréal based on the number of properties managed and estimated total revenue over the past year. Analyze their scale and performance metrics.
| Host Name | Properties | Grossing Revenue | Stay Reviews | Avg Rating |
|---|---|---|---|---|
| Sybrand | 5 | $65,554 | 7 | 1.00/5.0 |
| David & Kirstie | 1 | $45,827 | 30 | 5.00/5.0 |
| Patricia | 1 | $31,122 | 94 | 4.98/5.0 |
| Michel | 6 | $28,120 | 13 | 2.50/5.0 |
| Olivier | 1 | $25,655 | 68 | 4.99/5.0 |
| Josette | 1 | $20,062 | 36 | 5.00/5.0 |
| Beate | 2 | $17,616 | 36 | 4.96/5.0 |
| Benedict | 1 | $16,912 | 22 | 5.00/5.0 |
| Host #375981672 | 2 | $14,416 | 36 | 4.67/5.0 |
| Host #434282251 | 1 | $14,047 | 0 | 0.00/5.0 |
Analyzing the strategies of top hosts, such as their property selection, pricing, and guest communication, can offer valuable lessons for optimizing your own Airbnb operations in Montréal.
Dive Deeper: Advanced Montréal STR Market Data (2025)
Ready to unlock more insights? AirROI provides access to advanced metrics and comprehensive Airbnb data for Montréal. Explore detailed analytics beyond this report to refine your investment strategy, optimize pricing, and maximize your vacation rental profits.
Explore Advanced MetricsMontréal Short-Term Rental Market Composition (2025): Property & Room Types
Room Type Distribution
Property Type Distribution
Market Composition Insights for Montréal
- The Montréal Airbnb market composition is heavily skewed towards Entire Home/Apt listings, which make up 81.6% of the 49 active rentals. This indicates strong guest preference for privacy and space.
- Looking at the property type distribution in Montréal, House properties are the most common (57.1%), reflecting the local real estate landscape.
- Houses represent a significant 57.1% portion, catering likely to families or larger groups.
- The presence of 12.2% Hotel/Boutique listings indicates integration with traditional hospitality.
- Smaller segments like unique stays, others (combined 6.1%) offer potential for unique stay experiences.
Montréal Airbnb Room Capacity Analysis (2025): Bedroom Distribution
Distribution of Listings by Number of Bedrooms
Room Capacity Insights for Montréal
- The dominant room capacity in Montréal is 3 bedrooms listings, making up 34.7% of the market. This suggests a strong demand for properties suitable for families or small groups.
- Together, 3 bedrooms and 1 bedroom properties represent 67.4% of the active Airbnb listings in Montréal, indicating a high concentration in these sizes.
- A significant 53.1% of listings offer 3+ bedrooms, catering to larger groups and families seeking more space in Montréal.
Montréal Vacation Rental Guest Capacity Trends (2025)
Distribution of Listings by Guest Capacity
Guest Capacity Insights for Montréal
- The most common guest capacity trend in Montréal vacation rentals is listings accommodating 6 guests (26.5%). This suggests the primary traveler segment is likely larger groups.
- Properties designed for 6 guests and 8+ guests dominate the Montréal STR market, accounting for 48.9% of listings.
- 48.9% of properties accommodate 6+ guests, serving the market segment for larger families or group travel in Montréal.
- On average, properties in Montréal are equipped to host 5.0 guests.
Montréal Airbnb Booking Patterns (2025): Available vs. Booked Days
Available Days Distribution
Booked Days Distribution
Booking Pattern Insights for Montréal
- The most common availability pattern in Montréal falls within the 271-366 days range, representing 73.5% of listings. This suggests many properties have significant open periods on their calendars.
- Approximately 91.9% of listings show high availability (181+ days open annually), indicating potential for increased bookings or specific owner usage patterns.
- For booked days, the 31-90 days range is most frequent in Montréal (53.1%), reflecting common guest stay durations or potential owner blocking patterns.
- A notable 8.2% of properties secure long booking periods (181+ days booked per year), highlighting successful long-term rental strategies or significant owner usage.
Montréal Airbnb Minimum Stay Requirements Analysis
Distribution of Listings by Minimum Night Requirement
1 Night
14 listings
33.3% of total
2 Nights
12 listings
28.6% of total
3 Nights
6 listings
14.3% of total
4-6 Nights
4 listings
9.5% of total
7-29 Nights
3 listings
7.1% of total
30+ Nights
3 listings
7.1% of total
Key Insights
- The most prevalent minimum stay requirement in Montréal is 1 Night, adopted by 33.3% of listings. This highlights the market's preference for shorter, flexible bookings.
- A strong majority (61.9%) of the Montréal Airbnb data shows acceptance of very short stays (1-2 nights), indicating a dynamic, high-turnover market.
Recommendations
- Align with the market by considering a 1 Night minimum stay, as 33.3% of Montréal hosts use this setting.
- Explore offering discounts for stays of 30+ nights to attract the 7.1% of the market seeking extended stays.
- Adjust minimum nights based on seasonality – potentially shorter during low season and longer during peak demand periods in Montréal.
Montréal Airbnb Cancellation Policy Trends Analysis (2025)
Super Strict 30 Days
1 listings
3% of total
Flexible
14 listings
42.4% of total
Moderate
8 listings
24.2% of total
Firm
4 listings
12.1% of total
Strict
6 listings
18.2% of total
Cancellation Policy Insights for Montréal
- The prevailing Airbnb cancellation policy trend in Montréal is Flexible, used by 42.4% of listings.
- There's a relatively balanced mix between guest-friendly (66.6%) and stricter (30.3%) policies, offering choices for different guest needs.
Recommendations for Hosts
- Consider adopting a Flexible policy to align with the 42.4% market standard in Montréal.
- Regularly review your cancellation policy against competitors and market demand shifts in Montréal.
Montréal STR Booking Lead Time Analysis (2025)
Average Booking Lead Time by Month
Booking Lead Time Insights for Montréal
- The overall average booking lead time for vacation rentals in Montréal is 66 days.
- Guests book furthest in advance for stays during July (average 110 days), likely coinciding with peak travel demand or local events.
- The shortest booking windows occur for stays in February (average 32 days), indicating more last-minute travel plans during this time.
- Seasonally, Summer (86 days avg.) sees the longest lead times, while Fall (47 days avg.) has the shortest, reflecting typical travel planning cycles.
Recommendations for Hosts
- Use the overall average lead time (66 days) as a baseline for your pricing and availability strategy in Montréal.
- For July stays, consider implementing length-of-stay discounts or slightly higher rates for bookings made less than 110 days out to capitalize on advance planning.
- Target marketing efforts for the Summer season well in advance (at least 86 days) to capture early planners.
- Monitor your own booking lead times against these Montréal averages to identify opportunities for dynamic pricing adjustments.
Popular & Essential Airbnb Amenities in Montréal (2025)
Amenity Prevalence
Amenity Insights for Montréal
- Essential amenities in Montréal that guests expect include: Heating, Hot water. Lacking these (any) could significantly impact bookings.
- Popular amenities like Kitchen, Essentials, Free parking on premises are common but not universal. Offering these can provide a competitive edge.
- Warning: Wifi is not universally provided but is considered essential globally. Ensure reliable Wifi is offered.
Recommendations for Hosts
- Ensure your listing includes all essential amenities for Montréal: Heating, Hot water.
- Prioritize adding missing essentials: Heating, Hot water.
- Consider adding popular differentiators like Kitchen or Essentials to increase appeal.
- Highlight unique or less common amenities you offer (e.g., hot tub, dedicated workspace, EV charger) in your listing description and photos.
- Regularly check competitor amenities in Montréal to stay competitive.
Montréal Airbnb Guest Demographics & Profile Analysis (2025)
Guest Profile Summary for Montréal
- The typical guest profile for Airbnb in Montréal consists of primarily domestic travelers (78%), often arriving from nearby Toulouse, typically belonging to the Post-2000s (Gen Z/Alpha) group (50%), primarily speaking French or English.
- Domestic travelers account for 77.7% of guests.
- Key international markets include France (77.7%) and United Kingdom (6.3%).
- Top languages spoken are French (42.6%) followed by English (26.6%).
- A significant demographic segment is the Post-2000s (Gen Z/Alpha) group, representing 50% of guests.
Recommendations for Hosts
- Target domestic marketing efforts towards travelers from Toulouse and England.
- Tailor amenities and listing descriptions to appeal to the dominant Post-2000s (Gen Z/Alpha) demographic (e.g., highlight fast WiFi, smart home features, local guides).
- Highlight unique local experiences or amenities relevant to the primary guest profile.
- Consider seasonal promotions aligned with peak travel times for key origin markets.
Nearby Short-Term Rental Market Comparison
How does the Montréal Airbnb market stack up against its neighbors? Compare key performance metrics like average monthly revenue, ADR, and occupancy rates in surrounding areas to understand the broader regional STR landscape.
| Market | Active Properties | Monthly Revenue | Daily Rate | Avg. Occupancy |
|---|---|---|---|---|
| Cornellà del Terri | 17 | $4,960 | $460.96 | 41% |
| Amer | 10 | $4,848 | $397.58 | 40% |
| Porqueres | 12 | $4,714 | $469.05 | 36% |
| la Baronia de Rialb | 14 | $4,296 | $393.88 | 43% |
| Bordils | 11 | $3,557 | $525.15 | 36% |
| Vilademuls | 20 | $3,489 | $328.54 | 36% |
| Vilanant | 10 | $3,424 | $343.93 | 34% |
| Astaffort | 10 | $3,393 | $314.20 | 35% |
| Bàscara | 13 | $3,317 | $437.52 | 39% |
| Castelnou | 12 | $3,274 | $302.12 | 31% |