Miers Airbnb Market Analysis 2025: Short Term Rental Data & Vacation Rental Statistics in Occitania, France
Is Airbnb profitable in Miers in 2025? Explore comprehensive Airbnb analytics for Miers, Occitania, France to uncover income potential. This 2025 STR market report for Miers, based on AirROI data from April 2024 to March 2025, reveals key trends in the niche market of 17 active listings.
Whether you're considering an Airbnb investment in Miers, optimizing your existing vacation rental, or exploring rental arbitrage opportunities, understanding the Miers Airbnb data is crucial. Understanding the local regulations is key to maximizing your short term rental income potential. Let's dive into the specifics.
Key Miers Airbnb Performance Metrics Overview
Monthly Airbnb Revenue Variations & Income Potential in Miers (2025)
Understanding the monthly revenue variations for Airbnb listings in Miers is key to maximizing your short term rental income potential. Seasonality significantly impacts earnings. Our analysis, based on data from the past 12 months, shows that the peak revenue month for STRs in Miers is typically August, while March often presents the lowest earnings, highlighting opportunities for strategic pricing adjustments during shoulder and low seasons. Explore the typical Airbnb income in Miers across different performance tiers:
- Best-in-class properties (Top 10%) achieve $6,512+ monthly, often utilizing dynamic pricing and superior guest experiences.
- Strong performing properties (Top 25%) earn $4,533 or more, indicating effective management and desirable locations/amenities.
- Typical properties (Median) generate around $1,926 per month, representing the average market performance.
- Entry-level properties (Bottom 25%) see earnings around $988, often with potential for optimization.
Average Monthly Airbnb Earnings Trend in Miers
Miers Airbnb Occupancy Rate Trends (2025)
Maximize your bookings by understanding the Miers STR occupancy trends. Seasonal demand shifts significantly influence how often properties are booked. Typically, Augustsees the highest demand (peak season occupancy), while November experiences the lowest (low season). Effective strategies, like adjusting minimum stays or offering promotions, can boost occupancy during slower periods. Here's how different property tiers perform in Miers:
- Best-in-class properties (Top 10%) achieve 76%+ occupancy, indicating high desirability and potentially optimized availability.
- Strong performing properties (Top 25%) maintain 64% or higher occupancy, suggesting good market fit and guest satisfaction.
- Typical properties (Median) have an occupancy rate around 46%.
- Entry-level properties (Bottom 25%) average 28% occupancy, potentially facing higher vacancy.
Average Monthly Occupancy Rate Trend in Miers
Average Daily Rate (ADR) Airbnb Trends in Miers (2025)
Effective short term rental pricing strategy in Miers involves understanding monthly ADR fluctuations. The Average Daily Rate (ADR) for Airbnb in Miers typically peaks in December and dips lowest during April. Leveraging Airbnb dynamic pricing tools or strategies based on this seasonality can significantly boost revenue. Here's a look at the typical nightly rates achieved:
- Best-in-class properties (Top 10%) command rates of $340+ per night, often due to premium features or locations.
- Strong performing properties (Top 25%) achieve nightly rates of $238 or more.
- Typical properties (Median) charge around $111 per night.
- Entry-level properties (Bottom 25%) earn around $80 per night.
Average Daily Rate (ADR) Trend by Month in Miers
Get Live Miers Market Intelligence 👇
Explore Real-time Analytics
Airbnb Seasonality Analysis & Trends in Miers (2025)
Peak Season (August, July, June)
- Revenue averages $4,232 per month
- Occupancy rates average 61.2%
- Daily rates average $163
Shoulder Season
- Revenue averages $2,707 per month
- Occupancy maintains around 43.4%
- Daily rates hold near $163
Low Season (January, February, March)
- Revenue drops to average $1,909 per month
- Occupancy decreases to average 35.6%
- Daily rates adjust to average $172
Seasonality Insights for Miers
- The Airbnb seasonality in Miers shows highly seasonal trends requiring careful strategy. While the sections above show seasonal averages, it's also insightful to look at the extremes:
- During the high season, the absolute peak month showcases Miers's highest earning potential, with monthly revenues capable of climbing to $4,974, occupancy reaching a high of 79.7%, and ADRs peaking at $177.
- Conversely, the slowest single month of the year, typically falling within the low season, marks the market's lowest point. In this month, revenue might dip to $1,836, occupancy could drop to 28.8%, and ADRs may adjust down to $153.
- Understanding both the seasonal averages and these monthly peaks and troughs in revenue, occupancy, and ADR is crucial for maximizing your Airbnb profit potential in Miers.
Seasonal Strategies for Maximizing Profit
- Peak Season: Maximize revenue through premium pricing and potentially longer minimum stays. Ensure high availability.
- Low Season: Offer competitive pricing, special promotions (e.g., extended stay discounts), and flexible cancellation policies. Target off-season travelers like remote workers or budget-conscious guests.
- Shoulder Seasons: Implement dynamic pricing that balances peak and low rates. Target weekend travelers or specific events. Offer slightly more flexible terms than peak season.
- Regularly analyze your own performance against these Miers seasonality benchmarks and adjust your pricing and availability strategy accordingly.
Best Areas for Airbnb Investment in Miers (2025)
Exploring the top neighborhoods for short-term rentals in Miers? This section highlights key areas, outlining why they are attractive for hosts and guests, along with notable local attractions. Consider these locations based on your target guest profile and investment strategy.
| Neighborhood / Area | Why Host Here? (Target Guests & Appeal) | Key Attractions & Landmarks |
|---|---|---|
| Carcassonne | Famous for its medieval fortress, La Cité, Carcassonne attracts history buffs and tourists fascinated by its picturesque streets and historical significance. A great spot for guests interested in culture and heritage. | Cité de Carcassonne, Castelnaudary, Canal du Midi, Carcassonne Cathedral, Place Carnot |
| Toulouse | Known as La Ville Rose, Toulouse is vibrant with an impressive aerospace industry and a rich cultural scene. Popular for both business and leisure travelers seeking a blend of modernity and tradition. | Capitole de Toulouse, Cité de l'Espace, Basilique Saint-Sernin, Pont Neuf, Jardin des Plantes |
| Narbonne | A historical city with Roman ruins and a Mediterranean vibe, Narbonne is perfect for those wanting beach access along with cultural exploration. Attracts tourists seeking a mix of relaxation and history. | Palais des Archevêques, Canal de la Robine, Narbonne Market, Les Halles de Narbonne, Classified Roman monuments |
| Montpellier | A dynamic university town with a youthful atmosphere, Montpellier enjoys many festivals, cultural activities, and a vibrant nightlife, appealing to younger travelers and students. | Place de la Comédie, Montpellier Cathedral, Antigone District, Botanical Garden, Musee Fabre |
| Perpignan | Rich in Catalan culture and history, Perpignan offers a unique blend of French and Spanish influences, attracting tourists interested in regional traditions and culinary experiences. | Palais des Rois de Majorque, Castillet, Saint-Jean-Baptiste Cathedral, Le Castillet, Jardin de la mairie |
| Collioure | A charming coastal town known for its scenic coastline and artistic heritage, Collioure is a favorite for those looking to unwind at the beach while enjoying vibrant local art. | Collioure Castle, Art galleries, Beachfront promenades, Notre-Dame-des-Anges Church, Port de Collioure |
| Alès | An attractive small town located near the Cévennes National Park, Alès is ideal for nature lovers and outdoor enthusiasts, offering hiking and natural beauty. | Cévennes National Park, Musee biblique, Alès Market, Gardons River, Eglise de la Madeleine |
| Saint-Jean-de-Védas | A suburb of Montpellier, Saint-Jean-de-Védas combines urban convenience with a relaxed lifestyle, making it appealing for families and those attending events in Montpellier. | Parc de la Peyrière, Local festivals, Nearby Montpellier attractions, Shopping centers, Parks and recreational areas |
Understanding Airbnb License Requirements & STR Laws in Miers (2025)
With 18% of listings showing registration in 2025, understanding potential Airbnb license requirements is crucial in Miers. Always verify the latest short term rental regulations and Airbnb license requirements directly with local government authorities for Miers to ensure full compliance before hosting.
(Source: AirROI data, 2025, based on 18% licensed listings)
Top Performing Airbnb Properties in Miers (2025)
Benchmark your potential! Explore examples of top-performing Airbnb properties in Miersbased on Trailing Twelve Month (TTM) revenue. Analyze their characteristics, revenue, occupancy rate, and ADR to understand what drives success in this market.
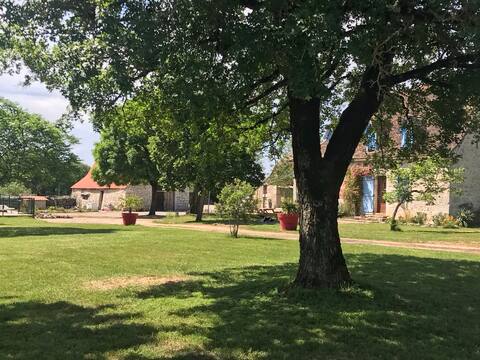
Domaine de Barrieres
Entire Place • 6 bedrooms
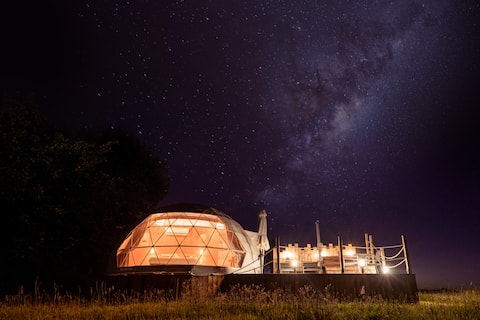
In the field of the unusual poppy dome
Entire Place • N/A

In the field of the unusual dome mimosa
Entire Place • N/A

Gîte Rocamadour - Au Grand Bonheur - with swimming pool
Entire Place • 4 bedrooms

Gites du Mas Davet
Entire Place • 8 bedrooms

Quiet stone cottage
Entire Place • 4 bedrooms
Note: Performance varies based on location, size, amenities, seasonality, and management quality. Data reflects the past 12 months.
Top Performing Airbnb Hosts in Miers (2025)
Learn from the best! This table showcases top-performing Airbnb hosts in Miers based on the number of properties managed and estimated total revenue over the past year. Analyze their scale and performance metrics.
| Host Name | Properties | Grossing Revenue | Stay Reviews | Avg Rating |
|---|---|---|---|---|
| Guillaume | 2 | $117,432 | 583 | 4.83/5.0 |
| Laget | 1 | $75,333 | 16 | 4.88/5.0 |
| Au Grand Bonheur | 2 | $59,875 | 9 | 2.50/5.0 |
| Margaret | 2 | $53,226 | 15 | 5.00/5.0 |
| Myriam | 2 | $25,601 | 277 | 4.84/5.0 |
| Annie | 1 | $16,195 | 21 | 4.95/5.0 |
| Corinne | 1 | $13,045 | 27 | 4.52/5.0 |
| Sabine | 1 | $12,610 | 32 | 4.91/5.0 |
| Host #5109886 | 1 | $12,572 | 0 | 0.00/5.0 |
| Marie AMELIE | 1 | $7,941 | 24 | 4.71/5.0 |
Analyzing the strategies of top hosts, such as their property selection, pricing, and guest communication, can offer valuable lessons for optimizing your own Airbnb operations in Miers.
Dive Deeper: Advanced Miers STR Market Data (2025)
Ready to unlock more insights? AirROI provides access to advanced metrics and comprehensive Airbnb data for Miers. Explore detailed analytics beyond this report to refine your investment strategy, optimize pricing, and maximize your vacation rental profits.
Explore Advanced MetricsMiers Short-Term Rental Market Composition (2025): Property & Room Types
Room Type Distribution
Property Type Distribution
Market Composition Insights for Miers
- The Miers Airbnb market composition is heavily skewed towards Entire Home/Apt listings, which make up 100% of the 17 active rentals. This indicates strong guest preference for privacy and space.
- Looking at the property type distribution in Miers, House properties are the most common (76.5%), reflecting the local real estate landscape.
- Houses represent a significant 76.5% portion, catering likely to families or larger groups.
Miers Airbnb Room Capacity Analysis (2025): Bedroom Distribution
Distribution of Listings by Number of Bedrooms
Room Capacity Insights for Miers
- The dominant room capacity in Miers is 2 bedrooms listings, making up 41.2% of the market. This suggests a strong demand for properties suitable for couples or solo travelers.
- Together, 2 bedrooms and 5+ bedrooms properties represent 58.8% of the active Airbnb listings in Miers, indicating a high concentration in these sizes.
- A significant 41.2% of listings offer 3+ bedrooms, catering to larger groups and families seeking more space in Miers.
Miers Vacation Rental Guest Capacity Trends (2025)
Distribution of Listings by Guest Capacity
Guest Capacity Insights for Miers
- The most common guest capacity trend in Miers vacation rentals is listings accommodating 4 guests (35.3%). This suggests the primary traveler segment is likely small families or groups.
- Properties designed for 4 guests and 8+ guests dominate the Miers STR market, accounting for 64.7% of listings.
- 41.2% of properties accommodate 6+ guests, serving the market segment for larger families or group travel in Miers.
- On average, properties in Miers are equipped to host 5.3 guests.
Miers Airbnb Booking Patterns (2025): Available vs. Booked Days
Available Days Distribution
Booked Days Distribution
Booking Pattern Insights for Miers
- The most common availability pattern in Miers falls within the 181-270 days range, representing 47.1% of listings. This suggests many properties have significant open periods on their calendars.
- Approximately 82.4% of listings show high availability (181+ days open annually), indicating potential for increased bookings or specific owner usage patterns.
- For booked days, the 91-180 days range is most frequent in Miers (41.2%), reflecting common guest stay durations or potential owner blocking patterns.
- A notable 23.5% of properties secure long booking periods (181+ days booked per year), highlighting successful long-term rental strategies or significant owner usage.
Miers Airbnb Minimum Stay Requirements Analysis
Distribution of Listings by Minimum Night Requirement
1 Night
3 listings
20% of total
2 Nights
5 listings
33.3% of total
3 Nights
1 listings
6.7% of total
4-6 Nights
3 listings
20% of total
30+ Nights
3 listings
20% of total
Key Insights
- The most prevalent minimum stay requirement in Miers is 2 Nights, adopted by 33.3% of listings. This highlights the market's preference for shorter, flexible bookings.
- A significant segment (20%) caters to monthly stays (30+ nights) in Miers, pointing to opportunities in the extended-stay market.
Recommendations
- Align with the market by considering a 2 Nights minimum stay, as 33.3% of Miers hosts use this setting.
- If feasible, allowing 1-night stays, especially midweek or during low season, could capture last-minute bookings, as only 20% currently do.
- Explore offering discounts for stays of 30+ nights to attract the 20% of the market seeking extended stays.
- Adjust minimum nights based on seasonality – potentially shorter during low season and longer during peak demand periods in Miers.
Miers Airbnb Cancellation Policy Trends Analysis (2025)
Super Strict 30 Days
1 listings
7.1% of total
Flexible
3 listings
21.4% of total
Moderate
5 listings
35.7% of total
Firm
4 listings
28.6% of total
Strict
1 listings
7.1% of total
Cancellation Policy Insights for Miers
- The prevailing Airbnb cancellation policy trend in Miers is Moderate, used by 35.7% of listings.
- There's a relatively balanced mix between guest-friendly (57.1%) and stricter (35.7%) policies, offering choices for different guest needs.
- Strict cancellation policies are quite rare (7.1%), potentially making listings with this policy less competitive unless justified by high demand or property type.
Recommendations for Hosts
- Consider adopting a Moderate policy to align with the 35.7% market standard in Miers.
- Using a Strict policy might deter some guests, as only 7.1% of listings use it. Evaluate if potential revenue protection outweighs possible lower booking rates.
- Regularly review your cancellation policy against competitors and market demand shifts in Miers.
Miers STR Booking Lead Time Analysis (2025)
Average Booking Lead Time by Month
Booking Lead Time Insights for Miers
- The overall average booking lead time for vacation rentals in Miers is 53 days.
- Guests book furthest in advance for stays during July (average 112 days), likely coinciding with peak travel demand or local events.
- The shortest booking windows occur for stays in January (average 18 days), indicating more last-minute travel plans during this time.
- Seasonally, Summer (101 days avg.) sees the longest lead times, while Winter (31 days avg.) has the shortest, reflecting typical travel planning cycles.
Recommendations for Hosts
- Use the overall average lead time (53 days) as a baseline for your pricing and availability strategy in Miers.
- For July stays, consider implementing length-of-stay discounts or slightly higher rates for bookings made less than 112 days out to capitalize on advance planning.
- Target marketing efforts for the Summer season well in advance (at least 101 days) to capture early planners.
- Monitor your own booking lead times against these Miers averages to identify opportunities for dynamic pricing adjustments.
Popular & Essential Airbnb Amenities in Miers (2025)
Amenity Prevalence
Amenity Insights for Miers
- Popular amenities like Hot water, Coffee maker, Smoke alarm are common but not universal. Offering these can provide a competitive edge.
Recommendations for Hosts
- Consider adding popular differentiators like Hot water or Coffee maker to increase appeal.
- Highlight unique or less common amenities you offer (e.g., hot tub, dedicated workspace, EV charger) in your listing description and photos.
- Regularly check competitor amenities in Miers to stay competitive.
Miers Airbnb Guest Demographics & Profile Analysis (2025)
Guest Profile Summary for Miers
- The typical guest profile for Airbnb in Miers consists of primarily domestic travelers (97%), often arriving from nearby Toulouse, typically belonging to the Post-2000s (Gen Z/Alpha) group (50%), primarily speaking French or English.
- Domestic travelers account for 96.8% of guests.
- Key international markets include France (96.8%) and Netherlands (0.6%).
- Top languages spoken are French (58.8%) followed by English (26.3%).
- A significant demographic segment is the Post-2000s (Gen Z/Alpha) group, representing 50% of guests.
Recommendations for Hosts
- Target domestic marketing efforts towards travelers from Toulouse and Bordeaux.
- Tailor amenities and listing descriptions to appeal to the dominant Post-2000s (Gen Z/Alpha) demographic (e.g., highlight fast WiFi, smart home features, local guides).
- Highlight unique local experiences or amenities relevant to the primary guest profile.
- Consider seasonal promotions aligned with peak travel times for key origin markets.
Nearby Short-Term Rental Market Comparison
How does the Miers Airbnb market stack up against its neighbors? Compare key performance metrics like average monthly revenue, ADR, and occupancy rates in surrounding areas to understand the broader regional STR landscape.
| Market | Active Properties | Monthly Revenue | Daily Rate | Avg. Occupancy |
|---|---|---|---|---|
| Astaffort | 10 | $3,393 | $314.20 | 35% |
| Saint-Pierre-Roche | 11 | $2,627 | $166.21 | 48% |
| Eynesse | 14 | $2,564 | $282.87 | 36% |
| Bourrou | 10 | $2,475 | $247.57 | 36% |
| Saint-Jean-d'Alcapiès | 10 | $2,429 | $169.43 | 43% |
| Jayac | 11 | $2,388 | $202.75 | 40% |
| La Magdelaine-sur-Tarn | 10 | $2,383 | $243.17 | 32% |
| Lanta | 14 | $2,306 | $270.81 | 44% |
| Pont-de-Larn | 17 | $2,254 | $239.90 | 32% |
| Gout-Rossignol | 11 | $2,212 | $251.86 | 38% |