Mazamet Airbnb Market Analysis 2025: Short Term Rental Data & Vacation Rental Statistics in Occitania, France
Is Airbnb profitable in Mazamet in 2025? Explore comprehensive Airbnb analytics for Mazamet, Occitania, France to uncover income potential. This 2025 STR market report for Mazamet, based on AirROI data from April 2024 to March 2025, reveals key trends in the niche market of 66 active listings.
Whether you're considering an Airbnb investment in Mazamet, optimizing your existing vacation rental, or exploring rental arbitrage opportunities, understanding the Mazamet Airbnb data is crucial. Understanding the local regulations is key to maximizing your short term rental income potential. Let's dive into the specifics.
Key Mazamet Airbnb Performance Metrics Overview
Monthly Airbnb Revenue Variations & Income Potential in Mazamet (2025)
Understanding the monthly revenue variations for Airbnb listings in Mazamet is key to maximizing your short term rental income potential. Seasonality significantly impacts earnings. Our analysis, based on data from the past 12 months, shows that the peak revenue month for STRs in Mazamet is typically August, while March often presents the lowest earnings, highlighting opportunities for strategic pricing adjustments during shoulder and low seasons. Explore the typical Airbnb income in Mazamet across different performance tiers:
- Best-in-class properties (Top 10%) achieve $1,573+ monthly, often utilizing dynamic pricing and superior guest experiences.
- Strong performing properties (Top 25%) earn $1,068 or more, indicating effective management and desirable locations/amenities.
- Typical properties (Median) generate around $726 per month, representing the average market performance.
- Entry-level properties (Bottom 25%) see earnings around $373, often with potential for optimization.
Average Monthly Airbnb Earnings Trend in Mazamet
Mazamet Airbnb Occupancy Rate Trends (2025)
Maximize your bookings by understanding the Mazamet STR occupancy trends. Seasonal demand shifts significantly influence how often properties are booked. Typically, Augustsees the highest demand (peak season occupancy), while March experiences the lowest (low season). Effective strategies, like adjusting minimum stays or offering promotions, can boost occupancy during slower periods. Here's how different property tiers perform in Mazamet:
- Best-in-class properties (Top 10%) achieve 73%+ occupancy, indicating high desirability and potentially optimized availability.
- Strong performing properties (Top 25%) maintain 56% or higher occupancy, suggesting good market fit and guest satisfaction.
- Typical properties (Median) have an occupancy rate around 34%.
- Entry-level properties (Bottom 25%) average 18% occupancy, potentially facing higher vacancy.
Average Monthly Occupancy Rate Trend in Mazamet
Average Daily Rate (ADR) Airbnb Trends in Mazamet (2025)
Effective short term rental pricing strategy in Mazamet involves understanding monthly ADR fluctuations. The Average Daily Rate (ADR) for Airbnb in Mazamet typically peaks in July and dips lowest during March. Leveraging Airbnb dynamic pricing tools or strategies based on this seasonality can significantly boost revenue. Here's a look at the typical nightly rates achieved:
- Best-in-class properties (Top 10%) command rates of $101+ per night, often due to premium features or locations.
- Strong performing properties (Top 25%) achieve nightly rates of $76 or more.
- Typical properties (Median) charge around $57 per night.
- Entry-level properties (Bottom 25%) earn around $47 per night.
Average Daily Rate (ADR) Trend by Month in Mazamet
Get Live Mazamet Market Intelligence 👇

Explore Real-time Analytics
Airbnb Seasonality Analysis & Trends in Mazamet (2025)
Peak Season (August, July, April)
- Revenue averages $1,128 per month
- Occupancy rates average 48.7%
- Daily rates average $74
Shoulder Season
- Revenue averages $822 per month
- Occupancy maintains around 38.3%
- Daily rates hold near $70
Low Season (January, February, March)
- Revenue drops to average $496 per month
- Occupancy decreases to average 28.7%
- Daily rates adjust to average $63
Seasonality Insights for Mazamet
- The Airbnb seasonality in Mazamet shows highly seasonal trends requiring careful strategy. While the sections above show seasonal averages, it's also insightful to look at the extremes:
- During the high season, the absolute peak month showcases Mazamet's highest earning potential, with monthly revenues capable of climbing to $1,168, occupancy reaching a high of 56.7%, and ADRs peaking at $75.
- Conversely, the slowest single month of the year, typically falling within the low season, marks the market's lowest point. In this month, revenue might dip to $451, occupancy could drop to 26.3%, and ADRs may adjust down to $62.
- Understanding both the seasonal averages and these monthly peaks and troughs in revenue, occupancy, and ADR is crucial for maximizing your Airbnb profit potential in Mazamet.
Seasonal Strategies for Maximizing Profit
- Peak Season: Maximize revenue through premium pricing and potentially longer minimum stays. Ensure high availability.
- Low Season: Offer competitive pricing, special promotions (e.g., extended stay discounts), and flexible cancellation policies. Target off-season travelers like remote workers or budget-conscious guests.
- Shoulder Seasons: Implement dynamic pricing that balances peak and low rates. Target weekend travelers or specific events. Offer slightly more flexible terms than peak season.
- Regularly analyze your own performance against these Mazamet seasonality benchmarks and adjust your pricing and availability strategy accordingly.
Best Areas for Airbnb Investment in Mazamet (2025)
Exploring the top neighborhoods for short-term rentals in Mazamet? This section highlights key areas, outlining why they are attractive for hosts and guests, along with notable local attractions. Consider these locations based on your target guest profile and investment strategy.
| Neighborhood / Area | Why Host Here? (Target Guests & Appeal) | Key Attractions & Landmarks |
|---|---|---|
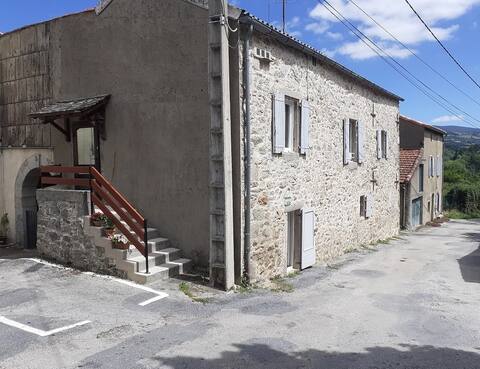
| Old Town Mazamet | Charming historic center with medieval architecture and vibrant local culture. Attracts tourists interested in history, culture, and local cuisine. | Saint-Sauveur Church, Place du Général de Gaulle, Les Jardins de la Berre, Musee du Textile et du Design, Café de la Mairie |
| Montagne Noire | Stunning natural area ideal for outdoor activities and nature lovers. Great for those seeking hiking, mountain biking, and scenic views. | Hiking trails, Cascades de la Fontsalade, Lac de Pradelles, Montagne Noire Regional Park |
| Castres | Nearby city known for its picturesque canals and rich heritage. Offers visitors cultural sites and a lively atmosphere. | Goya Museum, Liberté Bridge, St- Benoit Abbey, Canal du Midi, Castres Market |
| Ski Resorts | Proximity to ski resorts in the Pyrenees attracts winter sports enthusiasts. Great opportunity for year-round rentals. | Skiing, Snowboarding, Snowshoeing, Mountain Lodges |
| Albi | UNESCO World Heritage site with beautiful architecture and a rich history. Popular with tourists exploring the region's culture. | Albi Cathedral, Palais de la Berbie, Museum of Toulouse-Lautrec |
| Lac de Saint-Ferréol | Scenic lake area perfect for family outings and leisure activities, attracting visitors in the summer. | Swimming, Boating, Picnicking, Walking trails, Cycling routes |
| Cévennes National Park | National park known for its diverse wildlife and stunning landscapes, perfect for eco-tourism and nature retreats. | Hiking, Wildlife Watching, Natural Springs, Historical Villages |
| Local Vineyards | Region known for its wine production; tourists often seek vineyard experiences and wine tastings. | Wine Tours, Tasting Experiences, Guided Vineyard Visits |
Understanding Airbnb License Requirements & STR Laws in Mazamet (2025)
With 11% of listings showing registration in 2025, understanding potential Airbnb license requirements is crucial in Mazamet. Always verify the latest short term rental regulations and Airbnb license requirements directly with local government authorities for Mazamet to ensure full compliance before hosting.
(Source: AirROI data, 2025, based on 11% licensed listings)
Top Performing Airbnb Properties in Mazamet (2025)
Benchmark your potential! Explore examples of top-performing Airbnb properties in Mazametbased on Trailing Twelve Month (TTM) revenue. Analyze their characteristics, revenue, occupancy rate, and ADR to understand what drives success in this market.

19th century character house with private swimming pool.
Entire Place • 4 bedrooms
Gîte des Monts de l 'Autan
Entire Place • 3 bedrooms

Apartment - 2 quiet bedrooms - Private parking
Entire Place • 2 bedrooms

The Mazamet warehouse - near train station - Parking
Entire Place • 1 bedroom
Charming Hautpoul home
Entire Place • 2 bedrooms
Cottage in medieval village
Entire Place • 3 bedrooms
Note: Performance varies based on location, size, amenities, seasonality, and management quality. Data reflects the past 12 months.
Top Performing Airbnb Hosts in Mazamet (2025)
Learn from the best! This table showcases top-performing Airbnb hosts in Mazamet based on the number of properties managed and estimated total revenue over the past year. Analyze their scale and performance metrics.
| Host Name | Properties | Grossing Revenue | Stay Reviews | Avg Rating |
|---|---|---|---|---|
| Isabelle | 5 | $43,489 | 89 | 4.89/5.0 |
| Gauthier | 4 | $32,153 | 29 | 3.58/5.0 |
| Aurélie | 3 | $31,646 | 347 | 4.83/5.0 |
| Benoit | 2 | $21,821 | 92 | 4.59/5.0 |
| Pauline | 3 | $20,987 | 81 | 3.19/5.0 |
| Henri | 3 | $19,771 | 45 | 4.73/5.0 |
| Myriem | 1 | $19,103 | 46 | 4.85/5.0 |
| Shirley | 3 | $18,248 | 31 | 4.93/5.0 |
| Jerome | 1 | $17,699 | 44 | 4.80/5.0 |
| Mike | 1 | $17,602 | 49 | 4.96/5.0 |
Analyzing the strategies of top hosts, such as their property selection, pricing, and guest communication, can offer valuable lessons for optimizing your own Airbnb operations in Mazamet.
Dive Deeper: Advanced Mazamet STR Market Data (2025)
Ready to unlock more insights? AirROI provides access to advanced metrics and comprehensive Airbnb data for Mazamet. Explore detailed analytics beyond this report to refine your investment strategy, optimize pricing, and maximize your vacation rental profits.
Explore Advanced MetricsMazamet Short-Term Rental Market Composition (2025): Property & Room Types
Room Type Distribution
Property Type Distribution
Market Composition Insights for Mazamet
- The Mazamet Airbnb market composition is heavily skewed towards Entire Home/Apt listings, which make up 89.4% of the 66 active rentals. This indicates strong guest preference for privacy and space.
- Looking at the property type distribution in Mazamet, Apartment/Condo properties are the most common (57.6%), reflecting the local real estate landscape.
- Houses represent a significant 34.8% portion, catering likely to families or larger groups.
- Smaller segments like hotel/boutique, others, outdoor/unique (combined 7.5%) offer potential for unique stay experiences.
Mazamet Airbnb Room Capacity Analysis (2025): Bedroom Distribution
Distribution of Listings by Number of Bedrooms
Room Capacity Insights for Mazamet
- The dominant room capacity in Mazamet is 1 bedroom listings, making up 43.9% of the market. This suggests a strong demand for properties suitable for couples or solo travelers.
- Together, 1 bedroom and 2 bedrooms properties represent 65.1% of the active Airbnb listings in Mazamet, indicating a high concentration in these sizes.
Mazamet Vacation Rental Guest Capacity Trends (2025)
Distribution of Listings by Guest Capacity
Guest Capacity Insights for Mazamet
- The most common guest capacity trend in Mazamet vacation rentals is listings accommodating 4 guests (33.3%). This suggests the primary traveler segment is likely small families or groups.
- Properties designed for 4 guests and 2 guests dominate the Mazamet STR market, accounting for 60.6% of listings.
- 15.1% of properties accommodate 6+ guests, serving the market segment for larger families or group travel in Mazamet.
- On average, properties in Mazamet are equipped to host 3.5 guests.
Mazamet Airbnb Booking Patterns (2025): Available vs. Booked Days
Available Days Distribution
Booked Days Distribution
Booking Pattern Insights for Mazamet
- The most common availability pattern in Mazamet falls within the 181-270 days range, representing 40.9% of listings. This suggests many properties have significant open periods on their calendars.
- Approximately 71.2% of listings show high availability (181+ days open annually), indicating potential for increased bookings or specific owner usage patterns.
- For booked days, the 91-180 days range is most frequent in Mazamet (40.9%), reflecting common guest stay durations or potential owner blocking patterns.
- A notable 30.3% of properties secure long booking periods (181+ days booked per year), highlighting successful long-term rental strategies or significant owner usage.
Mazamet Airbnb Minimum Stay Requirements Analysis
Distribution of Listings by Minimum Night Requirement
1 Night
32 listings
51.6% of total
2 Nights
19 listings
30.6% of total
3 Nights
3 listings
4.8% of total
4-6 Nights
5 listings
8.1% of total
7-29 Nights
1 listings
1.6% of total
30+ Nights
2 listings
3.2% of total
Key Insights
- The most prevalent minimum stay requirement in Mazamet is 1 Night, adopted by 51.6% of listings. This highlights the market's preference for shorter, flexible bookings.
- A strong majority (82.2%) of the Mazamet Airbnb data shows acceptance of very short stays (1-2 nights), indicating a dynamic, high-turnover market.
Recommendations
- Align with the market by considering a 1 Night minimum stay, as 51.6% of Mazamet hosts use this setting.
- Adjust minimum nights based on seasonality – potentially shorter during low season and longer during peak demand periods in Mazamet.
Mazamet Airbnb Cancellation Policy Trends Analysis (2025)
Super Strict 30 Days
1 listings
1.8% of total
Flexible
25 listings
43.9% of total
Moderate
22 listings
38.6% of total
Firm
7 listings
12.3% of total
Strict
2 listings
3.5% of total
Cancellation Policy Insights for Mazamet
- The prevailing Airbnb cancellation policy trend in Mazamet is Flexible, used by 43.9% of listings.
- The market strongly favors guest-friendly terms, with 82.5% of listings offering Flexible or Moderate policies. This suggests guests in Mazamet may expect booking flexibility.
- Strict cancellation policies are quite rare (3.5%), potentially making listings with this policy less competitive unless justified by high demand or property type.
Recommendations for Hosts
- Consider adopting a Flexible policy to align with the 43.9% market standard in Mazamet.
- Using a Strict policy might deter some guests, as only 3.5% of listings use it. Evaluate if potential revenue protection outweighs possible lower booking rates.
- Regularly review your cancellation policy against competitors and market demand shifts in Mazamet.
Mazamet STR Booking Lead Time Analysis (2025)
Average Booking Lead Time by Month
Booking Lead Time Insights for Mazamet
- The overall average booking lead time for vacation rentals in Mazamet is 39 days.
- Guests book furthest in advance for stays during July (average 54 days), likely coinciding with peak travel demand or local events.
- The shortest booking windows occur for stays in October (average 21 days), indicating more last-minute travel plans during this time.
- Seasonally, Summer (49 days avg.) sees the longest lead times, while Fall (31 days avg.) has the shortest, reflecting typical travel planning cycles.
Recommendations for Hosts
- Use the overall average lead time (39 days) as a baseline for your pricing and availability strategy in Mazamet.
- For July stays, consider implementing length-of-stay discounts or slightly higher rates for bookings made less than 54 days out to capitalize on advance planning.
- Target marketing efforts for the Summer season well in advance (at least 49 days) to capture early planners.
- Monitor your own booking lead times against these Mazamet averages to identify opportunities for dynamic pricing adjustments.
Popular & Essential Airbnb Amenities in Mazamet (2025)
Amenity Prevalence
Amenity Insights for Mazamet
- Popular amenities like Kitchen, TV, Smoke alarm are common but not universal. Offering these can provide a competitive edge.
- Warning: Wifi is not universally provided but is considered essential globally. Ensure reliable Wifi is offered.
Recommendations for Hosts
- Consider adding popular differentiators like Kitchen or TV to increase appeal.
- Highlight unique or less common amenities you offer (e.g., hot tub, dedicated workspace, EV charger) in your listing description and photos.
- Regularly check competitor amenities in Mazamet to stay competitive.
Mazamet Airbnb Guest Demographics & Profile Analysis (2025)
Guest Profile Summary for Mazamet
- The typical guest profile for Airbnb in Mazamet consists of primarily domestic travelers (91%), often arriving from nearby Toulouse, typically belonging to the Post-2000s (Gen Z/Alpha) group (50%), primarily speaking French or English.
- Domestic travelers account for 90.9% of guests.
- Key international markets include France (90.9%) and Spain (2.6%).
- Top languages spoken are French (45.6%) followed by English (29.9%).
- A significant demographic segment is the Post-2000s (Gen Z/Alpha) group, representing 50% of guests.
Recommendations for Hosts
- Target domestic marketing efforts towards travelers from Toulouse and Montpellier.
- Tailor amenities and listing descriptions to appeal to the dominant Post-2000s (Gen Z/Alpha) demographic (e.g., highlight fast WiFi, smart home features, local guides).
- Highlight unique local experiences or amenities relevant to the primary guest profile.
- Consider seasonal promotions aligned with peak travel times for key origin markets.
Nearby Short-Term Rental Market Comparison
How does the Mazamet Airbnb market stack up against its neighbors? Compare key performance metrics like average monthly revenue, ADR, and occupancy rates in surrounding areas to understand the broader regional STR landscape.
| Market | Active Properties | Monthly Revenue | Daily Rate | Avg. Occupancy |
|---|---|---|---|---|
| Cornellà del Terri | 17 | $4,960 | $460.96 | 41% |
| Amer | 10 | $4,848 | $397.58 | 40% |
| Porqueres | 12 | $4,714 | $469.05 | 36% |
| la Baronia de Rialb | 14 | $4,296 | $393.88 | 43% |
| Villeneuvette | 13 | $4,150 | $337.56 | 44% |
| Bordils | 11 | $3,557 | $525.15 | 36% |
| Vilademuls | 20 | $3,489 | $328.54 | 36% |
| Vilanant | 10 | $3,424 | $343.93 | 34% |
| Bàscara | 13 | $3,317 | $437.52 | 39% |
| Castelnou | 12 | $3,274 | $302.12 | 31% |