Lourdes Airbnb Market Analysis 2025: Short Term Rental Data & Vacation Rental Statistics in Occitania, France
Is Airbnb profitable in Lourdes in 2025? Explore comprehensive Airbnb analytics for Lourdes, Occitania, France to uncover income potential. This 2025 STR market report for Lourdes, based on AirROI data from April 2024 to March 2025, reveals key trends in the market of 427 active listings.
Whether you're considering an Airbnb investment in Lourdes, optimizing your existing vacation rental, or exploring rental arbitrage opportunities, understanding the Lourdes Airbnb data is crucial. Understanding the local regulations is key to maximizing your short term rental income potential. Let's dive into the specifics.
Key Lourdes Airbnb Performance Metrics Overview
Monthly Airbnb Revenue Variations & Income Potential in Lourdes (2025)
Understanding the monthly revenue variations for Airbnb listings in Lourdes is key to maximizing your short term rental income potential. Seasonality significantly impacts earnings. Our analysis, based on data from the past 12 months, shows that the peak revenue month for STRs in Lourdes is typically August, while January often presents the lowest earnings, highlighting opportunities for strategic pricing adjustments during shoulder and low seasons. Explore the typical Airbnb income in Lourdes across different performance tiers:
- Best-in-class properties (Top 10%) achieve $2,118+ monthly, often utilizing dynamic pricing and superior guest experiences.
- Strong performing properties (Top 25%) earn $1,332 or more, indicating effective management and desirable locations/amenities.
- Typical properties (Median) generate around $843 per month, representing the average market performance.
- Entry-level properties (Bottom 25%) see earnings around $435, often with potential for optimization.
Average Monthly Airbnb Earnings Trend in Lourdes
Lourdes Airbnb Occupancy Rate Trends (2025)
Maximize your bookings by understanding the Lourdes STR occupancy trends. Seasonal demand shifts significantly influence how often properties are booked. Typically, Augustsees the highest demand (peak season occupancy), while January experiences the lowest (low season). Effective strategies, like adjusting minimum stays or offering promotions, can boost occupancy during slower periods. Here's how different property tiers perform in Lourdes:
- Best-in-class properties (Top 10%) achieve 77%+ occupancy, indicating high desirability and potentially optimized availability.
- Strong performing properties (Top 25%) maintain 61% or higher occupancy, suggesting good market fit and guest satisfaction.
- Typical properties (Median) have an occupancy rate around 39%.
- Entry-level properties (Bottom 25%) average 20% occupancy, potentially facing higher vacancy.
Average Monthly Occupancy Rate Trend in Lourdes
Average Daily Rate (ADR) Airbnb Trends in Lourdes (2025)
Effective short term rental pricing strategy in Lourdes involves understanding monthly ADR fluctuations. The Average Daily Rate (ADR) for Airbnb in Lourdes typically peaks in July and dips lowest during March. Leveraging Airbnb dynamic pricing tools or strategies based on this seasonality can significantly boost revenue. Here's a look at the typical nightly rates achieved:
- Best-in-class properties (Top 10%) command rates of $128+ per night, often due to premium features or locations.
- Strong performing properties (Top 25%) achieve nightly rates of $87 or more.
- Typical properties (Median) charge around $59 per night.
- Entry-level properties (Bottom 25%) earn around $46 per night.
Average Daily Rate (ADR) Trend by Month in Lourdes
Get Live Lourdes Market Intelligence 👇

Explore Real-time Analytics
Airbnb Seasonality Analysis & Trends in Lourdes (2025)
Peak Season (August, May, July)
- Revenue averages $1,505 per month
- Occupancy rates average 54.9%
- Daily rates average $83
Shoulder Season
- Revenue averages $1,059 per month
- Occupancy maintains around 39.4%
- Daily rates hold near $78
Low Season (January, February, March)
- Revenue drops to average $675 per month
- Occupancy decreases to average 31.8%
- Daily rates adjust to average $71
Seasonality Insights for Lourdes
- The Airbnb seasonality in Lourdes shows highly seasonal trends requiring careful strategy. While the sections above show seasonal averages, it's also insightful to look at the extremes:
- During the high season, the absolute peak month showcases Lourdes's highest earning potential, with monthly revenues capable of climbing to $1,581, occupancy reaching a high of 62.9%, and ADRs peaking at $84.
- Conversely, the slowest single month of the year, typically falling within the low season, marks the market's lowest point. In this month, revenue might dip to $659, occupancy could drop to 28.3%, and ADRs may adjust down to $70.
- Understanding both the seasonal averages and these monthly peaks and troughs in revenue, occupancy, and ADR is crucial for maximizing your Airbnb profit potential in Lourdes.
Seasonal Strategies for Maximizing Profit
- Peak Season: Maximize revenue through premium pricing and potentially longer minimum stays. Ensure high availability.
- Low Season: Offer competitive pricing, special promotions (e.g., extended stay discounts), and flexible cancellation policies. Target off-season travelers like remote workers or budget-conscious guests.
- Shoulder Seasons: Implement dynamic pricing that balances peak and low rates. Target weekend travelers or specific events. Offer slightly more flexible terms than peak season.
- Regularly analyze your own performance against these Lourdes seasonality benchmarks and adjust your pricing and availability strategy accordingly.
Best Areas for Airbnb Investment in Lourdes (2025)
Exploring the top neighborhoods for short-term rentals in Lourdes? This section highlights key areas, outlining why they are attractive for hosts and guests, along with notable local attractions. Consider these locations based on your target guest profile and investment strategy.
| Neighborhood / Area | Why Host Here? (Target Guests & Appeal) | Key Attractions & Landmarks |
|---|---|---|
| Sanctuaries of Lourdes | The Sanctuaries are the primary pilgrimage sites attracting millions of visitors each year seeking spiritual healing and enlightenment. Hosting near these sites ensures high occupancy rates throughout the year. | Basilica of the Immaculate Conception, Grotto of Massabielle, Crown of Roses, St. Joseph's Oratory, Rosary Basilica |
| Lourdes City Center | The city center is bustling with shops, restaurants, and cultural sites, making it a convenient location for tourists. Proximity to amenities and attractions drives demand for stays in this area. | Notre-Dame de Lourdes, Lourdes Markets, Musee de Cire, House of Saint Bernadette, Lourdes Railway Station |
| Cité Saint-Pierre | This neighborhood offers affordable housing options and is close to the sanctuaries, appealing to budget-conscious travelers, hence a solid choice for investors. | Lourdes Casino, Gave de Pau River, Local eateries, Parks and gardens, Various walking trails |
| Rue de la Grotte | Located near the Grotto, this street attracts choirs and pilgrims visiting Lourdes. It is a key area for Airbnb hosting due to the foot traffic during the pilgrimage months. | Spot for pilgrims, Souvenir shops, Food stalls, Churches, Cafes |
| Palais des Congrès | This area hosts various conferences and events, attracting business travelers. Investing here can cater to a different demographic interested in both tourism and business. | Convention Center, Event spaces, Nearby hotels, Restaurants and bars, Parks |
| Bord du Gave | The picturesque riverfront offers scenic views and a peaceful atmosphere, appealing to visitors looking for relaxation while still being close to the city’s attractions. | Gave de Pau, Walking trails along the river, Picnic areas, Scenic viewpoints, Cycling paths |
| Les Halles | The market area is vibrant and lively, ideal for those wanting to experience local culture. It's a great location for short-term rentals attracting food lovers and culture seekers. | Local farmer's market, Craft food stalls, Nearby cafes, Cooking workshops, Cultural events |
| Soubirous | A residential yet accessible neighborhood known for hosting families visiting Lourdes. Offers a quieter stay away from the busy tourist areas, ideal for families seeking a home-like environment. | Local parks, Family-friendly restaurants, Scenic walks, Cultural sites, Community events |
Understanding Airbnb License Requirements & STR Laws in Lourdes (2025)
With 13% of listings showing registration in 2025, understanding potential Airbnb license requirements is crucial in Lourdes. Always verify the latest short term rental regulations and Airbnb license requirements directly with local government authorities for Lourdes to ensure full compliance before hosting.
(Source: AirROI data, 2025, based on 13% licensed listings)
Top Performing Airbnb Properties in Lourdes (2025)
Benchmark your potential! Explore examples of top-performing Airbnb properties in Lourdesbased on Trailing Twelve Month (TTM) revenue. Analyze their characteristics, revenue, occupancy rate, and ADR to understand what drives success in this market.

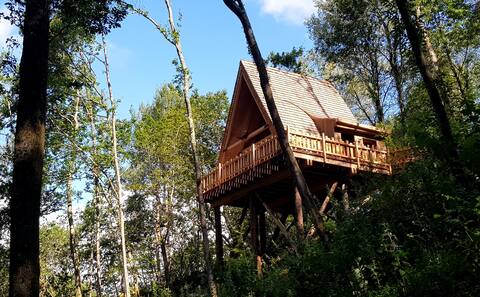
2021inley - Cabins & Spas les 7 Montagnes
Entire Place • 1 bedroom

Mount Fuji - Cabins & Spas les 7 Mountains
Entire Place • 2 bedrooms
Le Mont Perdu - Cabins & Spas les 7 Montagnes
Entire Place • 1 bedroom
House.6 bedrooms,6 bathrooms. 12 people
Entire Place • 6 bedrooms

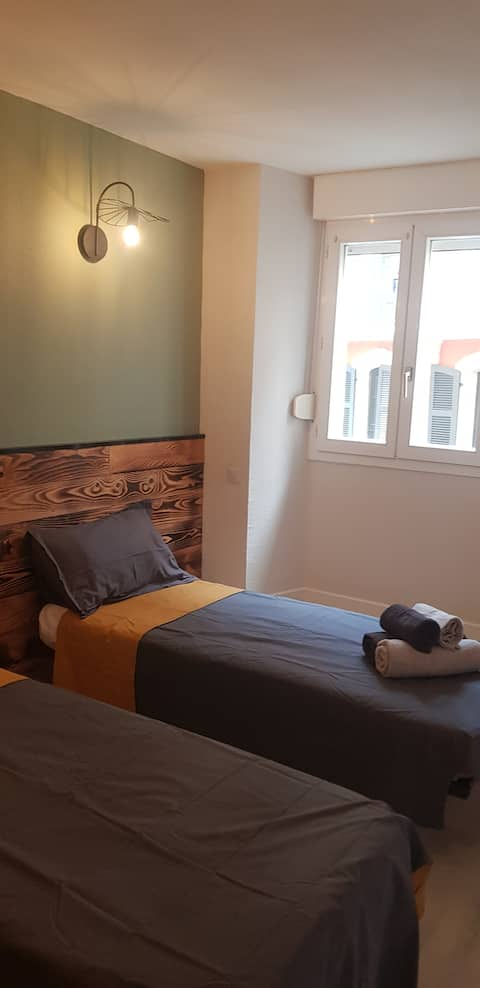
Apartment Le Secret, 140m2, Near Sanctuary, Clim
Entire Place • 2 bedrooms

Beautiful 125 m2 duplex near train station
Entire Place • 5 bedrooms
Note: Performance varies based on location, size, amenities, seasonality, and management quality. Data reflects the past 12 months.
Top Performing Airbnb Hosts in Lourdes (2025)
Learn from the best! This table showcases top-performing Airbnb hosts in Lourdes based on the number of properties managed and estimated total revenue over the past year. Analyze their scale and performance metrics.
| Host Name | Properties | Grossing Revenue | Stay Reviews | Avg Rating |
|---|---|---|---|---|
| Anne-Emilie & Victor | 4 | $230,682 | 372 | 4.90/5.0 |
| Chris | 8 | $186,061 | 280 | 4.18/5.0 |
| Christophe | 14 | $163,256 | 225 | 4.49/5.0 |
| Vincent | 10 | $137,025 | 1502 | 4.48/5.0 |
| Joy | 2 | $77,514 | 37 | 4.70/5.0 |
| Davide | 6 | $77,442 | 231 | 4.81/5.0 |
| Muriel | 2 | $73,808 | 69 | 4.93/5.0 |
| Dawlet | 4 | $70,995 | 207 | 4.66/5.0 |
| Christophe | 5 | $69,735 | 310 | 4.61/5.0 |
| Marie Et Sacha | 4 | $66,683 | 57 | 4.92/5.0 |
Analyzing the strategies of top hosts, such as their property selection, pricing, and guest communication, can offer valuable lessons for optimizing your own Airbnb operations in Lourdes.
Dive Deeper: Advanced Lourdes STR Market Data (2025)
Ready to unlock more insights? AirROI provides access to advanced metrics and comprehensive Airbnb data for Lourdes. Explore detailed analytics beyond this report to refine your investment strategy, optimize pricing, and maximize your vacation rental profits.
Explore Advanced MetricsLourdes Short-Term Rental Market Composition (2025): Property & Room Types
Room Type Distribution
Property Type Distribution
Market Composition Insights for Lourdes
- The Lourdes Airbnb market composition is heavily skewed towards Entire Home/Apt listings, which make up 82.9% of the 427 active rentals. This indicates strong guest preference for privacy and space.
- Looking at the property type distribution in Lourdes, Apartment/Condo properties are the most common (79.4%), reflecting the local real estate landscape.
- The presence of 7.3% Hotel/Boutique listings indicates integration with traditional hospitality.
- Smaller segments like unique stays, outdoor/unique, others (combined 2.4%) offer potential for unique stay experiences.
Lourdes Airbnb Room Capacity Analysis (2025): Bedroom Distribution
Distribution of Listings by Number of Bedrooms
Room Capacity Insights for Lourdes
- The dominant room capacity in Lourdes is 1 bedroom listings, making up 48.7% of the market. This suggests a strong demand for properties suitable for couples or solo travelers.
- Together, 1 bedroom and 2 bedrooms properties represent 69.3% of the active Airbnb listings in Lourdes, indicating a high concentration in these sizes.
Lourdes Vacation Rental Guest Capacity Trends (2025)
Distribution of Listings by Guest Capacity
Guest Capacity Insights for Lourdes
- The most common guest capacity trend in Lourdes vacation rentals is listings accommodating 2 guests (30.4%). This suggests the primary traveler segment is likely couples or solo travelers.
- Properties designed for 2 guests and 4 guests dominate the Lourdes STR market, accounting for 60.4% of listings.
- 19.5% of properties accommodate 6+ guests, serving the market segment for larger families or group travel in Lourdes.
- On average, properties in Lourdes are equipped to host 3.6 guests.
Lourdes Airbnb Booking Patterns (2025): Available vs. Booked Days
Available Days Distribution
Booked Days Distribution
Booking Pattern Insights for Lourdes
- The most common availability pattern in Lourdes falls within the 271-366 days range, representing 40% of listings. This suggests many properties have significant open periods on their calendars.
- Approximately 69.5% of listings show high availability (181+ days open annually), indicating potential for increased bookings or specific owner usage patterns.
- For booked days, the 91-180 days range is most frequent in Lourdes (30.2%), reflecting common guest stay durations or potential owner blocking patterns.
- A notable 31.8% of properties secure long booking periods (181+ days booked per year), highlighting successful long-term rental strategies or significant owner usage.
Lourdes Airbnb Minimum Stay Requirements Analysis
Distribution of Listings by Minimum Night Requirement
1 Night
127 listings
33.5% of total
2 Nights
156 listings
41.2% of total
3 Nights
32 listings
8.4% of total
4-6 Nights
16 listings
4.2% of total
7-29 Nights
2 listings
0.5% of total
30+ Nights
46 listings
12.1% of total
Key Insights
- The most prevalent minimum stay requirement in Lourdes is 2 Nights, adopted by 41.2% of listings. This highlights the market's preference for shorter, flexible bookings.
- A strong majority (74.7%) of the Lourdes Airbnb data shows acceptance of very short stays (1-2 nights), indicating a dynamic, high-turnover market.
- A significant segment (12.1%) caters to monthly stays (30+ nights) in Lourdes, pointing to opportunities in the extended-stay market.
Recommendations
- Align with the market by considering a 2 Nights minimum stay, as 41.2% of Lourdes hosts use this setting.
- Explore offering discounts for stays of 30+ nights to attract the 12.1% of the market seeking extended stays.
- Adjust minimum nights based on seasonality – potentially shorter during low season and longer during peak demand periods in Lourdes.
Lourdes Airbnb Cancellation Policy Trends Analysis (2025)
Refundable
8 listings
2.2% of total
Super Strict 30 Days
1 listings
0.3% of total
Non-refundable
6 listings
1.7% of total
Flexible
125 listings
34.5% of total
Moderate
128 listings
35.4% of total
Firm
37 listings
10.2% of total
Strict
57 listings
15.7% of total
Cancellation Policy Insights for Lourdes
- The prevailing Airbnb cancellation policy trend in Lourdes is Moderate, used by 35.4% of listings.
- There's a relatively balanced mix between guest-friendly (69.9%) and stricter (25.9%) policies, offering choices for different guest needs.
Recommendations for Hosts
- Consider adopting a Moderate policy to align with the 35.4% market standard in Lourdes.
- Regularly review your cancellation policy against competitors and market demand shifts in Lourdes.
Lourdes STR Booking Lead Time Analysis (2025)
Average Booking Lead Time by Month
Booking Lead Time Insights for Lourdes
- The overall average booking lead time for vacation rentals in Lourdes is 39 days.
- Guests book furthest in advance for stays during May (average 71 days), likely coinciding with peak travel demand or local events.
- The shortest booking windows occur for stays in January (average 28 days), indicating more last-minute travel plans during this time.
- Seasonally, Summer (63 days avg.) sees the longest lead times, while Winter (30 days avg.) has the shortest, reflecting typical travel planning cycles.
Recommendations for Hosts
- Use the overall average lead time (39 days) as a baseline for your pricing and availability strategy in Lourdes.
- For May stays, consider implementing length-of-stay discounts or slightly higher rates for bookings made less than 71 days out to capitalize on advance planning.
- Target marketing efforts for the Summer season well in advance (at least 63 days) to capture early planners.
- Monitor your own booking lead times against these Lourdes averages to identify opportunities for dynamic pricing adjustments.
Popular & Essential Airbnb Amenities in Lourdes (2025)
Amenity Prevalence
Amenity Insights for Lourdes
- Popular amenities like Heating, Wifi, TV are common but not universal. Offering these can provide a competitive edge.
- Warning: Wifi is not universally provided but is considered essential globally. Ensure reliable Wifi is offered.
Recommendations for Hosts
- Consider adding popular differentiators like Heating or Wifi to increase appeal.
- Highlight unique or less common amenities you offer (e.g., hot tub, dedicated workspace, EV charger) in your listing description and photos.
- Regularly check competitor amenities in Lourdes to stay competitive.
Lourdes Airbnb Guest Demographics & Profile Analysis (2025)
Guest Profile Summary for Lourdes
- The typical guest profile for Airbnb in Lourdes consists of a mix of domestic (60%) and international guests, often arriving from nearby Paris, typically belonging to the Post-2000s (Gen Z/Alpha) group (50%), primarily speaking English or French.
- Domestic travelers account for 60.0% of guests.
- Key international markets include France (60%) and United States (7%).
- Top languages spoken are English (33.8%) followed by French (33%).
- A significant demographic segment is the Post-2000s (Gen Z/Alpha) group, representing 50% of guests.
Recommendations for Hosts
- Balance marketing efforts between domestic and international channels based on the guest mix.
- Tailor amenities and listing descriptions to appeal to the dominant Post-2000s (Gen Z/Alpha) demographic (e.g., highlight fast WiFi, smart home features, local guides).
- Highlight unique local experiences or amenities relevant to the primary guest profile.
- Consider seasonal promotions aligned with peak travel times for key origin markets.
Nearby Short-Term Rental Market Comparison
How does the Lourdes Airbnb market stack up against its neighbors? Compare key performance metrics like average monthly revenue, ADR, and occupancy rates in surrounding areas to understand the broader regional STR landscape.
| Market | Active Properties | Monthly Revenue | Daily Rate | Avg. Occupancy |
|---|---|---|---|---|
| San Sebastián | 1,426 | $3,546 | $262.81 | 49% |
| Saint-Laurent-des-Combes | 11 | $3,526 | $706.18 | 23% |
| Astaffort | 10 | $3,393 | $314.20 | 35% |
| Cénac | 18 | $2,773 | $268.58 | 53% |
| Cérons | 11 | $2,635 | $196.16 | 39% |
| Galgon | 12 | $2,599 | $210.34 | 48% |
| Esteribar | 20 | $2,574 | $276.81 | 32% |
| Hernani | 11 | $2,572 | $345.16 | 40% |
| Eynesse | 14 | $2,564 | $282.87 | 36% |
| Azet | 13 | $2,500 | $245.55 | 43% |