Loubressac Airbnb Market Analysis 2025: Short Term Rental Data & Vacation Rental Statistics in Occitania, France
Is Airbnb profitable in Loubressac in 2025? Explore comprehensive Airbnb analytics for Loubressac, Occitania, France to uncover income potential. This 2025 STR market report for Loubressac, based on AirROI data from April 2024 to March 2025, reveals key trends in the niche market of 25 active listings.
Whether you're considering an Airbnb investment in Loubressac, optimizing your existing vacation rental, or exploring rental arbitrage opportunities, understanding the Loubressac Airbnb data is crucial. Leveraging the low regulation environment is key to maximizing your short term rental income potential. Let's dive into the specifics.
Key Loubressac Airbnb Performance Metrics Overview
Monthly Airbnb Revenue Variations & Income Potential in Loubressac (2025)
Understanding the monthly revenue variations for Airbnb listings in Loubressac is key to maximizing your short term rental income potential. Seasonality significantly impacts earnings. Our analysis, based on data from the past 12 months, shows that the peak revenue month for STRs in Loubressac is typically July, while November often presents the lowest earnings, highlighting opportunities for strategic pricing adjustments during shoulder and low seasons. Explore the typical Airbnb income in Loubressac across different performance tiers:
- Best-in-class properties (Top 10%) achieve $3,001+ monthly, often utilizing dynamic pricing and superior guest experiences.
- Strong performing properties (Top 25%) earn $1,782 or more, indicating effective management and desirable locations/amenities.
- Typical properties (Median) generate around $1,079 per month, representing the average market performance.
- Entry-level properties (Bottom 25%) see earnings around $708, often with potential for optimization.
Average Monthly Airbnb Earnings Trend in Loubressac
Loubressac Airbnb Occupancy Rate Trends (2025)
Maximize your bookings by understanding the Loubressac STR occupancy trends. Seasonal demand shifts significantly influence how often properties are booked. Typically, Augustsees the highest demand (peak season occupancy), while November experiences the lowest (low season). Effective strategies, like adjusting minimum stays or offering promotions, can boost occupancy during slower periods. Here's how different property tiers perform in Loubressac:
- Best-in-class properties (Top 10%) achieve 68%+ occupancy, indicating high desirability and potentially optimized availability.
- Strong performing properties (Top 25%) maintain 54% or higher occupancy, suggesting good market fit and guest satisfaction.
- Typical properties (Median) have an occupancy rate around 36%.
- Entry-level properties (Bottom 25%) average 24% occupancy, potentially facing higher vacancy.
Average Monthly Occupancy Rate Trend in Loubressac
Average Daily Rate (ADR) Airbnb Trends in Loubressac (2025)
Effective short term rental pricing strategy in Loubressac involves understanding monthly ADR fluctuations. The Average Daily Rate (ADR) for Airbnb in Loubressac typically peaks in August and dips lowest during October. Leveraging Airbnb dynamic pricing tools or strategies based on this seasonality can significantly boost revenue. Here's a look at the typical nightly rates achieved:
- Best-in-class properties (Top 10%) command rates of $182+ per night, often due to premium features or locations.
- Strong performing properties (Top 25%) achieve nightly rates of $135 or more.
- Typical properties (Median) charge around $106 per night.
- Entry-level properties (Bottom 25%) earn around $69 per night.
Average Daily Rate (ADR) Trend by Month in Loubressac
Get Live Loubressac Market Intelligence 👇

Explore Real-time Analytics
Airbnb Seasonality Analysis & Trends in Loubressac (2025)
Peak Season (July, August, September)
- Revenue averages $2,360 per month
- Occupancy rates average 59.4%
- Daily rates average $124
Shoulder Season
- Revenue averages $1,245 per month
- Occupancy maintains around 34.2%
- Daily rates hold near $117
Low Season (February, March, November)
- Revenue drops to average $698 per month
- Occupancy decreases to average 30.7%
- Daily rates adjust to average $120
Seasonality Insights for Loubressac
- The Airbnb seasonality in Loubressac shows highly seasonal trends requiring careful strategy. While the sections above show seasonal averages, it's also insightful to look at the extremes:
- During the high season, the absolute peak month showcases Loubressac's highest earning potential, with monthly revenues capable of climbing to $2,769, occupancy reaching a high of 67.7%, and ADRs peaking at $130.
- Conversely, the slowest single month of the year, typically falling within the low season, marks the market's lowest point. In this month, revenue might dip to $607, occupancy could drop to 25.5%, and ADRs may adjust down to $112.
- Understanding both the seasonal averages and these monthly peaks and troughs in revenue, occupancy, and ADR is crucial for maximizing your Airbnb profit potential in Loubressac.
Seasonal Strategies for Maximizing Profit
- Peak Season: Maximize revenue through premium pricing and potentially longer minimum stays. Ensure high availability.
- Low Season: Offer competitive pricing, special promotions (e.g., extended stay discounts), and flexible cancellation policies. Target off-season travelers like remote workers or budget-conscious guests.
- Shoulder Seasons: Implement dynamic pricing that balances peak and low rates. Target weekend travelers or specific events. Offer slightly more flexible terms than peak season.
- Regularly analyze your own performance against these Loubressac seasonality benchmarks and adjust your pricing and availability strategy accordingly.
Best Areas for Airbnb Investment in Loubressac (2025)
Exploring the top neighborhoods for short-term rentals in Loubressac? This section highlights key areas, outlining why they are attractive for hosts and guests, along with notable local attractions. Consider these locations based on your target guest profile and investment strategy.
| Neighborhood / Area | Why Host Here? (Target Guests & Appeal) | Key Attractions & Landmarks |
|---|---|---|
| Loubressac Historic Village | A picturesque medieval village perched on a cliff, offering stunning views of the surrounding countryside. It's a popular choice for tourists seeking a blend of history and beauty. | Château de Loubressac, Eglise de Loubressac, walking trails, scenic viewpoints, local artisan shops |
| Padirac | Known for the stunning Gouffre de Padirac cave, this area attracts visitors interested in natural wonders and adventure tourism. | Gouffre de Padirac, river boat tours, nature walks, local gastronomy, caving tours |
| Rocamadour | A UNESCO World Heritage Site and a major pilgrimage destination, Rocamadour draws large crowds, making it ideal for Airbnb hosting. | Rocamadour Sanctuary, château, monastery, scenic viewpoints, local markets |
| Saint-Céré | A charming town with historical significance and cultural events, appealing to visitors looking for a local experience in a vibrant community. | Maison de la Culture, local festivals, theatre, historical sites, natural landscapes |
| Assier | Renowned for its Renaissance chateau and beautiful landscapes, Assier offers a serene stay in the countryside, ideal for nature lovers. | Château d'Assier, hiking trails, cycling routes, local vineyards, scenic picnic spots |
| Martel | This medieval town is filled with history and has a unique charm that attracts tourists looking for an authentic experience. | Martel's medieval architecture, local markets, theatre, vintage shops, charming cafes |
| Turenne | A historic village that overlooks the Dordogne valley, Turenne is ideal for those seeking peace and breathtaking views. | Château de Turenne, narrow streets, local artisan shops, scenic views, nature hikes |
| Beaulieu-sur-Dordogne | A beautiful riverside town known for its relaxed atmosphere and access to outdoor activities on the Dordogne River, appealing to families and adventure seekers. | Dordogne River, local restaurants, beaches, kayaking, historical monuments |
Understanding Airbnb License Requirements & STR Laws in Loubressac (2025)
While Loubressac, Occitania, France currently shows low STR regulations, specific Airbnb license requirements might still exist or change. Always verify the latest short term rental regulations and Airbnb license requirements directly with local government authorities for Loubressac to ensure full compliance before hosting.
(Source: AirROI data, 2025, based on 4% licensed listings)
Top Performing Airbnb Properties in Loubressac (2025)
Benchmark your potential! Explore examples of top-performing Airbnb properties in Loubressacbased on Trailing Twelve Month (TTM) revenue. Analyze their characteristics, revenue, occupancy rate, and ADR to understand what drives success in this market.

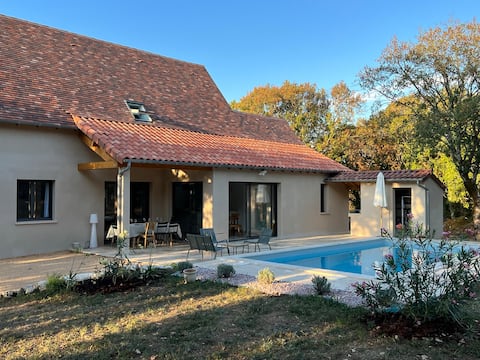
Villa with pool on the causse
Entire Place • 3 bedrooms
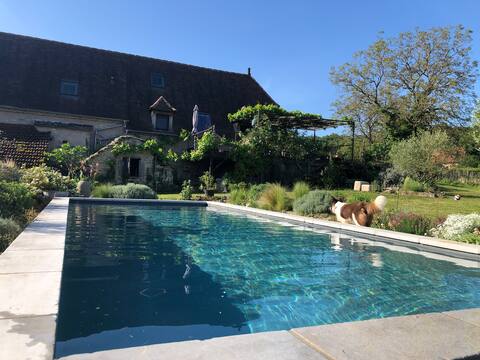
Quiet house in an exceptional site
Entire Place • 3 bedrooms

Gîte Lalie Loubressac Dordogne Valley
Entire Place • 4 bedrooms
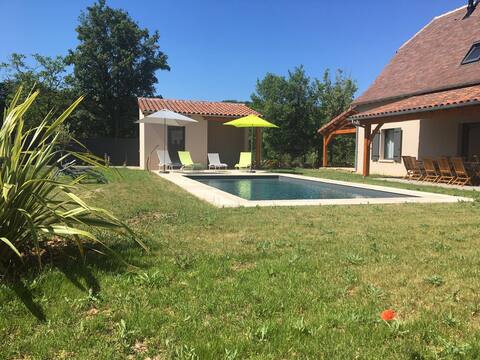
Charming Caussenarde house with pool
Entire Place • 3 bedrooms

Welcome to Les Couannelles
Entire Place • 4 bedrooms
Gîte Yan Loubressac proche de Rocamadour
Entire Place • 4 bedrooms
Note: Performance varies based on location, size, amenities, seasonality, and management quality. Data reflects the past 12 months.
Top Performing Airbnb Hosts in Loubressac (2025)
Learn from the best! This table showcases top-performing Airbnb hosts in Loubressac based on the number of properties managed and estimated total revenue over the past year. Analyze their scale and performance metrics.
| Host Name | Properties | Grossing Revenue | Stay Reviews | Avg Rating |
|---|---|---|---|---|
| Elodie | 2 | $37,913 | 54 | 4.92/5.0 |
| Antoine | 1 | $28,849 | 38 | 5.00/5.0 |
| Isabelle | 2 | $26,213 | 88 | 4.91/5.0 |
| Marie Christine | 1 | $25,204 | 34 | 5.00/5.0 |
| Béatrice | 1 | $22,329 | 18 | 4.94/5.0 |
| Joseph Et Brigitte | 2 | $18,833 | 950 | 4.75/5.0 |
| Margaux | 2 | $12,750 | 87 | 4.62/5.0 |
| Hôtel | 1 | $11,678 | 25 | 4.80/5.0 |
| Eve | 1 | $10,104 | 9 | 4.67/5.0 |
| Gontrand | 1 | $10,045 | 17 | 4.88/5.0 |
Analyzing the strategies of top hosts, such as their property selection, pricing, and guest communication, can offer valuable lessons for optimizing your own Airbnb operations in Loubressac.
Dive Deeper: Advanced Loubressac STR Market Data (2025)
Ready to unlock more insights? AirROI provides access to advanced metrics and comprehensive Airbnb data for Loubressac. Explore detailed analytics beyond this report to refine your investment strategy, optimize pricing, and maximize your vacation rental profits.
Explore Advanced MetricsLoubressac Short-Term Rental Market Composition (2025): Property & Room Types
Room Type Distribution
Property Type Distribution
Market Composition Insights for Loubressac
- The Loubressac Airbnb market composition is heavily skewed towards Entire Home/Apt listings, which make up 84% of the 25 active rentals. This indicates strong guest preference for privacy and space.
- Looking at the property type distribution in Loubressac, House properties are the most common (80%), reflecting the local real estate landscape.
- Houses represent a significant 80% portion, catering likely to families or larger groups.
- The presence of 16% Hotel/Boutique listings indicates integration with traditional hospitality.
- Smaller segments like outdoor/unique (combined 4.0%) offer potential for unique stay experiences.
Loubressac Airbnb Room Capacity Analysis (2025): Bedroom Distribution
Distribution of Listings by Number of Bedrooms
Room Capacity Insights for Loubressac
- The dominant room capacity in Loubressac is 2 bedrooms listings, making up 32% of the market. This suggests a strong demand for properties suitable for couples or solo travelers.
- Together, 2 bedrooms and 3 bedrooms properties represent 60.0% of the active Airbnb listings in Loubressac, indicating a high concentration in these sizes.
- A significant 44.0% of listings offer 3+ bedrooms, catering to larger groups and families seeking more space in Loubressac.
Loubressac Vacation Rental Guest Capacity Trends (2025)
Distribution of Listings by Guest Capacity
Guest Capacity Insights for Loubressac
- The most common guest capacity trend in Loubressac vacation rentals is listings accommodating 8+ guests (36%). This suggests the primary traveler segment is likely larger groups.
- Properties designed for 8+ guests and 5 guests dominate the Loubressac STR market, accounting for 56.0% of listings.
- 36.0% of properties accommodate 6+ guests, serving the market segment for larger families or group travel in Loubressac.
- On average, properties in Loubressac are equipped to host 4.9 guests.
Loubressac Airbnb Booking Patterns (2025): Available vs. Booked Days
Available Days Distribution
Booked Days Distribution
Booking Pattern Insights for Loubressac
- The most common availability pattern in Loubressac falls within the 271-366 days range, representing 52% of listings. This suggests many properties have significant open periods on their calendars.
- Approximately 88.0% of listings show high availability (181+ days open annually), indicating potential for increased bookings or specific owner usage patterns.
- For booked days, the 91-180 days range is most frequent in Loubressac (36%), reflecting common guest stay durations or potential owner blocking patterns.
- A notable 12.0% of properties secure long booking periods (181+ days booked per year), highlighting successful long-term rental strategies or significant owner usage.
Loubressac Airbnb Minimum Stay Requirements Analysis
Distribution of Listings by Minimum Night Requirement
1 Night
4 listings
17.4% of total
2 Nights
4 listings
17.4% of total
3 Nights
3 listings
13% of total
4-6 Nights
3 listings
13% of total
7-29 Nights
7 listings
30.4% of total
30+ Nights
2 listings
8.7% of total
Key Insights
- The most prevalent minimum stay requirement in Loubressac is 7-29 Nights, adopted by 30.4% of listings. This highlights the market's preference for shorter, flexible bookings.
Recommendations
- Align with the market by considering a 7-29 Nights minimum stay, as 30.4% of Loubressac hosts use this setting.
- If feasible, allowing 1-night stays, especially midweek or during low season, could capture last-minute bookings, as only 17.4% currently do.
- Explore offering discounts for stays of 30+ nights to attract the 8.7% of the market seeking extended stays.
- Adjust minimum nights based on seasonality – potentially shorter during low season and longer during peak demand periods in Loubressac.
Loubressac Airbnb Cancellation Policy Trends Analysis (2025)
Super Strict 30 Days
1 listings
4.2% of total
Flexible
6 listings
25% of total
Moderate
5 listings
20.8% of total
Firm
3 listings
12.5% of total
Strict
9 listings
37.5% of total
Cancellation Policy Insights for Loubressac
- The prevailing Airbnb cancellation policy trend in Loubressac is Strict, used by 37.5% of listings.
- There's a relatively balanced mix between guest-friendly (45.8%) and stricter (50.0%) policies, offering choices for different guest needs.
Recommendations for Hosts
- Consider adopting a Strict policy to align with the 37.5% market standard in Loubressac.
- With 37.5% using Strict terms, this is a viable option in Loubressac, particularly for high-value properties or during peak demand periods.
- Regularly review your cancellation policy against competitors and market demand shifts in Loubressac.
Loubressac STR Booking Lead Time Analysis (2025)
Average Booking Lead Time by Month
Booking Lead Time Insights for Loubressac
- The overall average booking lead time for vacation rentals in Loubressac is 75 days.
- Guests book furthest in advance for stays during July (average 110 days), likely coinciding with peak travel demand or local events.
- The shortest booking windows occur for stays in March (average 24 days), indicating more last-minute travel plans during this time.
- Seasonally, Summer (97 days avg.) sees the longest lead times, while Winter (43 days avg.) has the shortest, reflecting typical travel planning cycles.
Recommendations for Hosts
- Use the overall average lead time (75 days) as a baseline for your pricing and availability strategy in Loubressac.
- For July stays, consider implementing length-of-stay discounts or slightly higher rates for bookings made less than 110 days out to capitalize on advance planning.
- Target marketing efforts for the Summer season well in advance (at least 97 days) to capture early planners.
- Monitor your own booking lead times against these Loubressac averages to identify opportunities for dynamic pricing adjustments.
Popular & Essential Airbnb Amenities in Loubressac (2025)
Amenity Prevalence
Amenity Insights for Loubressac
- Popular amenities like Free parking on premises, Kitchen, Heating are common but not universal. Offering these can provide a competitive edge.
- Warning: Wifi is not universally provided but is considered essential globally. Ensure reliable Wifi is offered.
Recommendations for Hosts
- Consider adding popular differentiators like Free parking on premises or Kitchen to increase appeal.
- Highlight unique or less common amenities you offer (e.g., hot tub, dedicated workspace, EV charger) in your listing description and photos.
- Regularly check competitor amenities in Loubressac to stay competitive.
Loubressac Airbnb Guest Demographics & Profile Analysis (2025)
Guest Profile Summary for Loubressac
- The typical guest profile for Airbnb in Loubressac consists of primarily domestic travelers (86%), often arriving from nearby Toulouse, typically belonging to the Post-2000s (Gen Z/Alpha) group (50%), primarily speaking French or English.
- Domestic travelers account for 86.4% of guests.
- Key international markets include France (86.4%) and Spain (3.2%).
- Top languages spoken are French (47.9%) followed by English (31.1%).
- A significant demographic segment is the Post-2000s (Gen Z/Alpha) group, representing 50% of guests.
Recommendations for Hosts
- Target domestic marketing efforts towards travelers from Toulouse and Paris.
- Tailor amenities and listing descriptions to appeal to the dominant Post-2000s (Gen Z/Alpha) demographic (e.g., highlight fast WiFi, smart home features, local guides).
- Highlight unique local experiences or amenities relevant to the primary guest profile.
- Consider seasonal promotions aligned with peak travel times for key origin markets.
Nearby Short-Term Rental Market Comparison
How does the Loubressac Airbnb market stack up against its neighbors? Compare key performance metrics like average monthly revenue, ADR, and occupancy rates in surrounding areas to understand the broader regional STR landscape.
| Market | Active Properties | Monthly Revenue | Daily Rate | Avg. Occupancy |
|---|---|---|---|---|
| Astaffort | 10 | $3,393 | $314.20 | 35% |
| Saint-Pierre-Roche | 11 | $2,627 | $166.21 | 48% |
| Eynesse | 14 | $2,564 | $282.87 | 36% |
| Bourrou | 10 | $2,475 | $247.57 | 36% |
| Saint-Jean-d'Alcapiès | 10 | $2,429 | $169.43 | 43% |
| Jayac | 11 | $2,388 | $202.75 | 40% |
| La Magdelaine-sur-Tarn | 10 | $2,383 | $243.17 | 32% |
| Lanta | 14 | $2,306 | $270.81 | 44% |
| Pont-de-Larn | 17 | $2,254 | $239.90 | 32% |
| Gout-Rossignol | 11 | $2,212 | $251.86 | 38% |