Llo Airbnb Market Analysis 2025: Short Term Rental Data & Vacation Rental Statistics in Occitania, France
Is Airbnb profitable in Llo in 2025? Explore comprehensive Airbnb analytics for Llo, Occitania, France to uncover income potential. This 2025 STR market report for Llo, based on AirROI data from April 2024 to March 2025, reveals key trends in the niche market of 18 active listings.
Whether you're considering an Airbnb investment in Llo, optimizing your existing vacation rental, or exploring rental arbitrage opportunities, understanding the Llo Airbnb data is crucial. Leveraging the low regulation environment is key to maximizing your short term rental income potential. Let's dive into the specifics.
Key Llo Airbnb Performance Metrics Overview
Monthly Airbnb Revenue Variations & Income Potential in Llo (2025)
Understanding the monthly revenue variations for Airbnb listings in Llo is key to maximizing your short term rental income potential. Seasonality significantly impacts earnings. Our analysis, based on data from the past 12 months, shows that the peak revenue month for STRs in Llo is typically December, while June often presents the lowest earnings, highlighting opportunities for strategic pricing adjustments during shoulder and low seasons. Explore the typical Airbnb income in Llo across different performance tiers:
- Best-in-class properties (Top 10%) achieve $2,498+ monthly, often utilizing dynamic pricing and superior guest experiences.
- Strong performing properties (Top 25%) earn $1,660 or more, indicating effective management and desirable locations/amenities.
- Typical properties (Median) generate around $1,074 per month, representing the average market performance.
- Entry-level properties (Bottom 25%) see earnings around $565, often with potential for optimization.
Average Monthly Airbnb Earnings Trend in Llo
Llo Airbnb Occupancy Rate Trends (2025)
Maximize your bookings by understanding the Llo STR occupancy trends. Seasonal demand shifts significantly influence how often properties are booked. Typically, Aprilsees the highest demand (peak season occupancy), while June experiences the lowest (low season). Effective strategies, like adjusting minimum stays or offering promotions, can boost occupancy during slower periods. Here's how different property tiers perform in Llo:
- Best-in-class properties (Top 10%) achieve 68%+ occupancy, indicating high desirability and potentially optimized availability.
- Strong performing properties (Top 25%) maintain 49% or higher occupancy, suggesting good market fit and guest satisfaction.
- Typical properties (Median) have an occupancy rate around 29%.
- Entry-level properties (Bottom 25%) average 17% occupancy, potentially facing higher vacancy.
Average Monthly Occupancy Rate Trend in Llo
Average Daily Rate (ADR) Airbnb Trends in Llo (2025)
Effective short term rental pricing strategy in Llo involves understanding monthly ADR fluctuations. The Average Daily Rate (ADR) for Airbnb in Llo typically peaks in December and dips lowest during April. Leveraging Airbnb dynamic pricing tools or strategies based on this seasonality can significantly boost revenue. Here's a look at the typical nightly rates achieved:
- Best-in-class properties (Top 10%) command rates of $185+ per night, often due to premium features or locations.
- Strong performing properties (Top 25%) achieve nightly rates of $155 or more.
- Typical properties (Median) charge around $127 per night.
- Entry-level properties (Bottom 25%) earn around $94 per night.
Average Daily Rate (ADR) Trend by Month in Llo
Get Live Llo Market Intelligence 👇

Explore Real-time Analytics
Airbnb Seasonality Analysis & Trends in Llo (2025)
Peak Season (December, April, February)
- Revenue averages $1,800 per month
- Occupancy rates average 48.2%
- Daily rates average $136
Shoulder Season
- Revenue averages $1,244 per month
- Occupancy maintains around 35.5%
- Daily rates hold near $130
Low Season (May, June, November)
- Revenue drops to average $911 per month
- Occupancy decreases to average 24.5%
- Daily rates adjust to average $126
Seasonality Insights for Llo
- The Airbnb seasonality in Llo shows highly seasonal trends requiring careful strategy. While the sections above show seasonal averages, it's also insightful to look at the extremes:
- During the high season, the absolute peak month showcases Llo's highest earning potential, with monthly revenues capable of climbing to $1,927, occupancy reaching a high of 61.1%, and ADRs peaking at $142.
- Conversely, the slowest single month of the year, typically falling within the low season, marks the market's lowest point. In this month, revenue might dip to $870, occupancy could drop to 23.3%, and ADRs may adjust down to $124.
- Understanding both the seasonal averages and these monthly peaks and troughs in revenue, occupancy, and ADR is crucial for maximizing your Airbnb profit potential in Llo.
Seasonal Strategies for Maximizing Profit
- Peak Season: Maximize revenue through premium pricing and potentially longer minimum stays. Ensure high availability.
- Low Season: Offer competitive pricing, special promotions (e.g., extended stay discounts), and flexible cancellation policies. Target off-season travelers like remote workers or budget-conscious guests.
- Shoulder Seasons: Implement dynamic pricing that balances peak and low rates. Target weekend travelers or specific events. Offer slightly more flexible terms than peak season.
- Regularly analyze your own performance against these Llo seasonality benchmarks and adjust your pricing and availability strategy accordingly.
Best Areas for Airbnb Investment in Llo (2025)
Exploring the top neighborhoods for short-term rentals in Llo? This section highlights key areas, outlining why they are attractive for hosts and guests, along with notable local attractions. Consider these locations based on your target guest profile and investment strategy.
| Neighborhood / Area | Why Host Here? (Target Guests & Appeal) | Key Attractions & Landmarks |
|---|---|---|
| Llo Village | Picturesque village known for its stunning mountainous landscapes and thermal spa. Ideal for tourists seeking relaxation and nature activities all year round. | Thermal Spa of Llo, Mountain hikes, Llo village architecture, Scenic viewpoints, Picnic areas |
| Font Romeu-Odeillo-Via | Popular ski resort with excellent winter sports facilities and stunning views. A hub for winter vacationers and outdoor enthusiasts. | Font Romeu Ski Resort, Via Ferrata, Golf courses, Nature parks, Local shops and restaurants |
| Cerdagne | A scenic area known for its beautiful natural landscapes and traditional Catalan culture. Great for tourists seeking authenticity combined with outdoor activities. | Cerdagne Plateau, Local markets, Hiking trails, Cultural festivals, Historic sites |
| Bolquère | Charming mountain village that offers skiing in winter and hiking in summer. Ideal for nature lovers and adventure seekers. | Bolquère Ski Resort, Hiking paths, Lake Puigcerdà, Mountain biking, Stunning vistas |
| Prades | Rich in history and culture, known for its markets and close proximity to natural parks. Great for visitors wanting a mix of culture and nature. | Prades Market, Maillol Museum, Pirineos Nature Park, Historic town center, Local wineries |
| Mont-Louis | A fortified town with a rich history and beautiful architecture. Attractive to tourists interested in culture and history as well as outdoor activities. | Fortified citadel, Historic sites, Nature trails, Viewpoint of the Catalan Pyrenees, Cultural events |
| Villeneuve-de-la-Raho | Close to Perpignan, known for its lake and recreational opportunities. Perfect for families and active vacationers. | Lac de Villeneuve-de-la-Raho, Water sports, Hiking and biking trails, Picnic areas, Nearby Perpignan attractions |
| Les Angles | A vibrant resort village famous for its skiing and summer activities. Perfect for both winter sports fans and summer explorers. | Les Angles Ski Resort, Lac de Matemale, Animal Park, Water sports in summer, Summer festivals |
Understanding Airbnb License Requirements & STR Laws in Llo (2025)
While Llo, Occitania, France currently shows low STR regulations, specific Airbnb license requirements might still exist or change. Always verify the latest short term rental regulations and Airbnb license requirements directly with local government authorities for Llo to ensure full compliance before hosting.
(Source: AirROI data, 2025, based on 6% licensed listings)
Top Performing Airbnb Properties in Llo (2025)
Benchmark your potential! Explore examples of top-performing Airbnb properties in Llobased on Trailing Twelve Month (TTM) revenue. Analyze their characteristics, revenue, occupancy rate, and ADR to understand what drives success in this market.
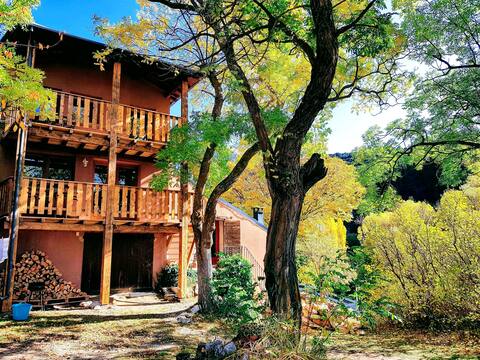
Terraced house on the top of Llo
Entire Place • 2 bedrooms
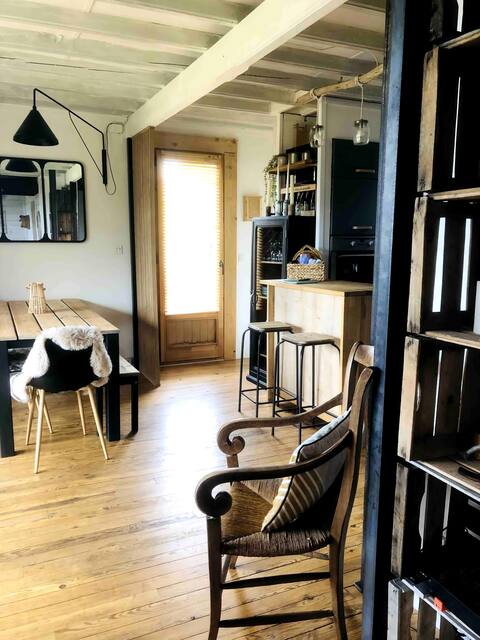
Home, Chalet de Montagne
Entire Place • 4 bedrooms
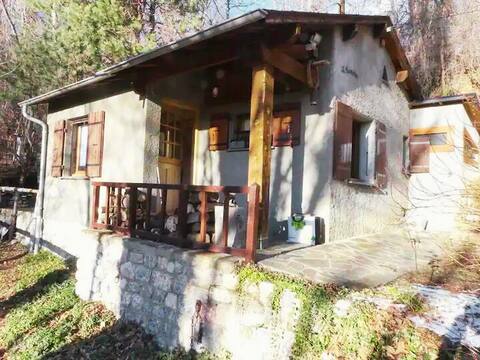
Comfort house in nature Llo
Entire Place • 2 bedrooms
Apartment in a house.
Entire Place • 1 bedroom
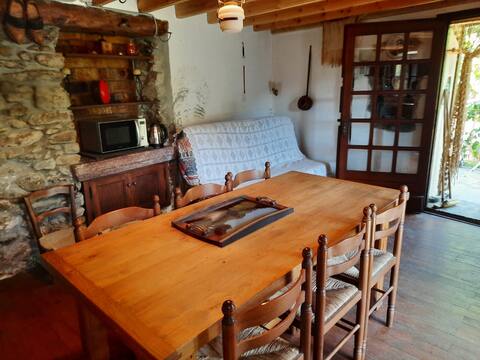
Old house on the top of Llo
Entire Place • 4 bedrooms
Habitación familiar 2-3-4 personas
Private Room • 1 bedroom
Note: Performance varies based on location, size, amenities, seasonality, and management quality. Data reflects the past 12 months.
Top Performing Airbnb Hosts in Llo (2025)
Learn from the best! This table showcases top-performing Airbnb hosts in Llo based on the number of properties managed and estimated total revenue over the past year. Analyze their scale and performance metrics.
| Host Name | Properties | Grossing Revenue | Stay Reviews | Avg Rating |
|---|---|---|---|---|
| José Antonio | 5 | $42,899 | 6 | 1.00/5.0 |
| Julie | 3 | $42,526 | 459 | 4.65/5.0 |
| Gîte De Llo | 3 | $23,782 | 30 | 4.58/5.0 |
| Julie | 1 | $14,762 | 29 | 4.97/5.0 |
| Jean-Philippe | 1 | $12,925 | 14 | 4.64/5.0 |
| Roquelaure | 1 | $8,359 | 8 | 4.38/5.0 |
| Laurent | 1 | $6,312 | 27 | 4.85/5.0 |
| Jean Luc | 1 | $6,124 | 77 | 4.82/5.0 |
| Marta | 1 | $4,766 | 21 | 4.86/5.0 |
| Marie | 1 | $4,554 | 3 | 5.00/5.0 |
Analyzing the strategies of top hosts, such as their property selection, pricing, and guest communication, can offer valuable lessons for optimizing your own Airbnb operations in Llo.
Dive Deeper: Advanced Llo STR Market Data (2025)
Ready to unlock more insights? AirROI provides access to advanced metrics and comprehensive Airbnb data for Llo. Explore detailed analytics beyond this report to refine your investment strategy, optimize pricing, and maximize your vacation rental profits.
Explore Advanced MetricsLlo Short-Term Rental Market Composition (2025): Property & Room Types
Room Type Distribution
Property Type Distribution
Market Composition Insights for Llo
- The Llo Airbnb market composition is heavily skewed towards Entire Home/Apt listings, which make up 61.1% of the 18 active rentals. This indicates strong guest preference for privacy and space.
- However, a notable 38.9% share for Private Rooms suggests opportunities for budget-conscious travelers or hosts renting out spare rooms.
- Looking at the property type distribution in Llo, Hotel/Boutique properties are the most common (38.9%), reflecting the local real estate landscape.
- Houses represent a significant 38.9% portion, catering likely to families or larger groups.
- The presence of 38.9% Hotel/Boutique listings indicates integration with traditional hospitality.
Llo Airbnb Room Capacity Analysis (2025): Bedroom Distribution
Distribution of Listings by Number of Bedrooms
Room Capacity Insights for Llo
- The dominant room capacity in Llo is 1 bedroom listings, making up 44.4% of the market. This suggests a strong demand for properties suitable for couples or solo travelers.
- Together, 1 bedroom and 2 bedrooms properties represent 66.6% of the active Airbnb listings in Llo, indicating a high concentration in these sizes.
- A significant 27.9% of listings offer 3+ bedrooms, catering to larger groups and families seeking more space in Llo.
Llo Vacation Rental Guest Capacity Trends (2025)
Distribution of Listings by Guest Capacity
Guest Capacity Insights for Llo
- The most common guest capacity trend in Llo vacation rentals is listings accommodating 2 guests (33.3%). This suggests the primary traveler segment is likely couples or solo travelers.
- Properties designed for 2 guests and 4 guests dominate the Llo STR market, accounting for 55.5% of listings.
- 33.4% of properties accommodate 6+ guests, serving the market segment for larger families or group travel in Llo.
- On average, properties in Llo are equipped to host 4.0 guests.
Llo Airbnb Booking Patterns (2025): Available vs. Booked Days
Available Days Distribution
Booked Days Distribution
Booking Pattern Insights for Llo
- The most common availability pattern in Llo falls within the 271-366 days range, representing 66.7% of listings. This suggests many properties have significant open periods on their calendars.
- Approximately 83.4% of listings show high availability (181+ days open annually), indicating potential for increased bookings or specific owner usage patterns.
- For booked days, the 31-90 days range is most frequent in Llo (61.1%), reflecting common guest stay durations or potential owner blocking patterns.
- A notable 16.7% of properties secure long booking periods (181+ days booked per year), highlighting successful long-term rental strategies or significant owner usage.
Llo Airbnb Minimum Stay Requirements Analysis
Distribution of Listings by Minimum Night Requirement
2 Nights
8 listings
44.4% of total
3 Nights
1 listings
5.6% of total
4-6 Nights
2 listings
11.1% of total
30+ Nights
7 listings
38.9% of total
Key Insights
- The most prevalent minimum stay requirement in Llo is 2 Nights, adopted by 44.4% of listings. This highlights the market's preference for shorter, flexible bookings.
- A significant segment (38.9%) caters to monthly stays (30+ nights) in Llo, pointing to opportunities in the extended-stay market.
Recommendations
- Align with the market by considering a 2 Nights minimum stay, as 44.4% of Llo hosts use this setting.
- A 2-night minimum appears standard (44.4%). Consider this for weekends or peak periods.
- Explore offering discounts for stays of 30+ nights to attract the 38.9% of the market seeking extended stays.
- Adjust minimum nights based on seasonality – potentially shorter during low season and longer during peak demand periods in Llo.
Llo Airbnb Cancellation Policy Trends Analysis (2025)
Flexible
6 listings
42.9% of total
Moderate
2 listings
14.3% of total
Firm
1 listings
7.1% of total
Strict
5 listings
35.7% of total
Cancellation Policy Insights for Llo
- The prevailing Airbnb cancellation policy trend in Llo is Flexible, used by 42.9% of listings.
- There's a relatively balanced mix between guest-friendly (57.2%) and stricter (42.8%) policies, offering choices for different guest needs.
Recommendations for Hosts
- Consider adopting a Flexible policy to align with the 42.9% market standard in Llo.
- With 35.7% using Strict terms, this is a viable option in Llo, particularly for high-value properties or during peak demand periods.
- Regularly review your cancellation policy against competitors and market demand shifts in Llo.
Llo STR Booking Lead Time Analysis (2025)
Average Booking Lead Time by Month
Booking Lead Time Insights for Llo
- The overall average booking lead time for vacation rentals in Llo is 58 days.
- Guests book furthest in advance for stays during September (average 154 days), likely coinciding with peak travel demand or local events.
- The shortest booking windows occur for stays in April (average 23 days), indicating more last-minute travel plans during this time.
- Seasonally, Summer (94 days avg.) sees the longest lead times, while Spring (35 days avg.) has the shortest, reflecting typical travel planning cycles.
Recommendations for Hosts
- Use the overall average lead time (58 days) as a baseline for your pricing and availability strategy in Llo.
- For September stays, consider implementing length-of-stay discounts or slightly higher rates for bookings made less than 154 days out to capitalize on advance planning.
- Target marketing efforts for the Summer season well in advance (at least 94 days) to capture early planners.
- Monitor your own booking lead times against these Llo averages to identify opportunities for dynamic pricing adjustments.
Popular & Essential Airbnb Amenities in Llo (2025)
Amenity Prevalence
Amenity Insights for Llo
- Popular amenities like Heating, Hot water, Smoke alarm are common but not universal. Offering these can provide a competitive edge.
- Warning: Wifi is not universally provided but is considered essential globally. Ensure reliable Wifi is offered.
Recommendations for Hosts
- Consider adding popular differentiators like Heating or Hot water to increase appeal.
- Highlight unique or less common amenities you offer (e.g., hot tub, dedicated workspace, EV charger) in your listing description and photos.
- Regularly check competitor amenities in Llo to stay competitive.
Llo Airbnb Guest Demographics & Profile Analysis (2025)
Guest Profile Summary for Llo
- The typical guest profile for Airbnb in Llo consists of a mix of domestic (59%) and international guests, often arriving from nearby Barcelona, typically belonging to the Post-2000s (Gen Z/Alpha) group (50%), primarily speaking Spanish or English.
- Domestic travelers account for 58.6% of guests.
- Key international markets include France (58.6%) and Spain (35.6%).
- Top languages spoken are Spanish (27.6%) followed by English (27.6%).
- A significant demographic segment is the Post-2000s (Gen Z/Alpha) group, representing 50% of guests.
Recommendations for Hosts
- Balance marketing efforts between domestic and international channels based on the guest mix.
- Tailor amenities and listing descriptions to appeal to the dominant Post-2000s (Gen Z/Alpha) demographic (e.g., highlight fast WiFi, smart home features, local guides).
- Highlight unique local experiences or amenities relevant to the primary guest profile.
- Consider seasonal promotions aligned with peak travel times for key origin markets.
Nearby Short-Term Rental Market Comparison
How does the Llo Airbnb market stack up against its neighbors? Compare key performance metrics like average monthly revenue, ADR, and occupancy rates in surrounding areas to understand the broader regional STR landscape.
| Market | Active Properties | Monthly Revenue | Daily Rate | Avg. Occupancy |
|---|---|---|---|---|
| Vall-llobrega | 15 | $10,261 | $798.88 | 44% |
| Canyelles | 49 | $5,958 | $1023.94 | 37% |
| Arenys de Munt | 28 | $5,100 | $514.27 | 41% |
| Teià | 25 | $5,027 | $348.45 | 45% |
| Cornellà del Terri | 17 | $4,960 | $460.96 | 41% |
| Tiana | 12 | $4,955 | $299.97 | 48% |
| Amer | 10 | $4,848 | $397.58 | 40% |
| Bescanó | 11 | $4,761 | $445.38 | 41% |
| Porqueres | 12 | $4,714 | $469.05 | 36% |
| Premià de Dalt | 28 | $4,630 | $345.43 | 49% |