Langlade Airbnb Market Analysis 2025: Short Term Rental Data & Vacation Rental Statistics in Occitania, France
Is Airbnb profitable in Langlade in 2025? Explore comprehensive Airbnb analytics for Langlade, Occitania, France to uncover income potential. This 2025 STR market report for Langlade, based on AirROI data from April 2024 to March 2025, reveals key trends in the niche market of 22 active listings.
Whether you're considering an Airbnb investment in Langlade, optimizing your existing vacation rental, or exploring rental arbitrage opportunities, understanding the Langlade Airbnb data is crucial. Understanding the local regulations is key to maximizing your short term rental income potential. Let's dive into the specifics.
Key Langlade Airbnb Performance Metrics Overview
Monthly Airbnb Revenue Variations & Income Potential in Langlade (2025)
Understanding the monthly revenue variations for Airbnb listings in Langlade is key to maximizing your short term rental income potential. Seasonality significantly impacts earnings. Our analysis, based on data from the past 12 months, shows that the peak revenue month for STRs in Langlade is typically August, while February often presents the lowest earnings, highlighting opportunities for strategic pricing adjustments during shoulder and low seasons. Explore the typical Airbnb income in Langlade across different performance tiers:
- Best-in-class properties (Top 10%) achieve $6,243+ monthly, often utilizing dynamic pricing and superior guest experiences.
- Strong performing properties (Top 25%) earn $4,285 or more, indicating effective management and desirable locations/amenities.
- Typical properties (Median) generate around $2,610 per month, representing the average market performance.
- Entry-level properties (Bottom 25%) see earnings around $1,473, often with potential for optimization.
Average Monthly Airbnb Earnings Trend in Langlade
Langlade Airbnb Occupancy Rate Trends (2025)
Maximize your bookings by understanding the Langlade STR occupancy trends. Seasonal demand shifts significantly influence how often properties are booked. Typically, Augustsees the highest demand (peak season occupancy), while February experiences the lowest (low season). Effective strategies, like adjusting minimum stays or offering promotions, can boost occupancy during slower periods. Here's how different property tiers perform in Langlade:
- Best-in-class properties (Top 10%) achieve 88%+ occupancy, indicating high desirability and potentially optimized availability.
- Strong performing properties (Top 25%) maintain 70% or higher occupancy, suggesting good market fit and guest satisfaction.
- Typical properties (Median) have an occupancy rate around 49%.
- Entry-level properties (Bottom 25%) average 29% occupancy, potentially facing higher vacancy.
Average Monthly Occupancy Rate Trend in Langlade
Average Daily Rate (ADR) Airbnb Trends in Langlade (2025)
Effective short term rental pricing strategy in Langlade involves understanding monthly ADR fluctuations. The Average Daily Rate (ADR) for Airbnb in Langlade typically peaks in July and dips lowest during November. Leveraging Airbnb dynamic pricing tools or strategies based on this seasonality can significantly boost revenue. Here's a look at the typical nightly rates achieved:
- Best-in-class properties (Top 10%) command rates of $385+ per night, often due to premium features or locations.
- Strong performing properties (Top 25%) achieve nightly rates of $293 or more.
- Typical properties (Median) charge around $188 per night.
- Entry-level properties (Bottom 25%) earn around $108 per night.
Average Daily Rate (ADR) Trend by Month in Langlade
Get Live Langlade Market Intelligence 👇

Explore Real-time Analytics
Airbnb Seasonality Analysis & Trends in Langlade (2025)
Peak Season (August, July, June)
- Revenue averages $4,928 per month
- Occupancy rates average 65.2%
- Daily rates average $242
Shoulder Season
- Revenue averages $2,859 per month
- Occupancy maintains around 50.7%
- Daily rates hold near $218
Low Season (February, March, November)
- Revenue drops to average $1,593 per month
- Occupancy decreases to average 37.7%
- Daily rates adjust to average $193
Seasonality Insights for Langlade
- The Airbnb seasonality in Langlade shows highly seasonal trends requiring careful strategy. While the sections above show seasonal averages, it's also insightful to look at the extremes:
- During the high season, the absolute peak month showcases Langlade's highest earning potential, with monthly revenues capable of climbing to $5,719, occupancy reaching a high of 75.7%, and ADRs peaking at $246.
- Conversely, the slowest single month of the year, typically falling within the low season, marks the market's lowest point. In this month, revenue might dip to $993, occupancy could drop to 18.7%, and ADRs may adjust down to $191.
- Understanding both the seasonal averages and these monthly peaks and troughs in revenue, occupancy, and ADR is crucial for maximizing your Airbnb profit potential in Langlade.
Seasonal Strategies for Maximizing Profit
- Peak Season: Maximize revenue through premium pricing and potentially longer minimum stays. Ensure high availability.
- Low Season: Offer competitive pricing, special promotions (e.g., extended stay discounts), and flexible cancellation policies. Target off-season travelers like remote workers or budget-conscious guests.
- Shoulder Seasons: Implement dynamic pricing that balances peak and low rates. Target weekend travelers or specific events. Offer slightly more flexible terms than peak season.
- Regularly analyze your own performance against these Langlade seasonality benchmarks and adjust your pricing and availability strategy accordingly.
Best Areas for Airbnb Investment in Langlade (2025)
Exploring the top neighborhoods for short-term rentals in Langlade? This section highlights key areas, outlining why they are attractive for hosts and guests, along with notable local attractions. Consider these locations based on your target guest profile and investment strategy.
| Neighborhood / Area | Why Host Here? (Target Guests & Appeal) | Key Attractions & Landmarks |
|---|---|---|
| Saint-Lary-Soulan | A popular ski resort in the Pyrenees, Saint-Lary-Soulan attracts winter sports enthusiasts and nature lovers. It's known for its stunning alpine scenery and vibrant local culture. | Cable Car to Pic du Midi, Thermal Spa, Ski slopes, Hiking trails, Local markets |
| Luchon | Known as the 'Queen of the Pyrenees', Luchon is famous for its thermal baths and beautiful mountain landscapes. It offers excellent opportunities for both winter and summer tourism. | Thermal Baths, Luchon Superbagnères ski area, Hiking trails, Local festivals, Botanical Gardens |
| Bagnères-de-Luchon | A charming town with thermal springs and access to numerous outdoor activities. It's a great base for tourists looking for adventure and relaxation in the mountains. | Parcours Aventure, Luchon Ski Resort, Luchon Valley, Mountain biking trails, Historic architecture |
| Agen | Located in the heart of Gascony, Agen is known for its gastronomy and beautiful riverside scenery. A great place for tourists wanting a taste of rural French life. | Agen's Canal, Pruneaux d'Agen, Historic center, Parc des Expositions, Local markets |
| Foix | The capital of Ariège, Foix is known for its historical castle and stunning views of the Pyrenees. It attracts visitors interested in history and natural beauty. | Foix Castle, Ariege Museum, Local hiking trails, Historic town center, Caves of Niaux |
| Mirepoix | A picturesque medieval town known for its beautiful square and half-timbered houses. Attracts visitors interested in history and architecture. | Mirepoix Cathedral, Market square, Local art shops, Café culture, Surrounding countryside |
| Saint-Girons | Located in a valley surrounded by the Pyrenees, this town offers a laid-back atmosphere with easy access to outdoor activities. It’s popular among nature enthusiasts. | Saint-Girons Market, Laparan River, Hiking trails in the Pyrenees, Historical monuments, Cultural events |
| Pamiers | As a gateway to the Ariège region, Pamiers is known for its rich history and close proximity to nature and outdoor activities. Ideal for tourists exploring the region. | Pamiers Cathedral, Local hiking trails, Historic town center, Ariège River, Cultural festivals |
Understanding Airbnb License Requirements & STR Laws in Langlade (2025)
With 18% of listings showing registration in 2025, understanding potential Airbnb license requirements is crucial in Langlade. Always verify the latest short term rental regulations and Airbnb license requirements directly with local government authorities for Langlade to ensure full compliance before hosting.
(Source: AirROI data, 2025, based on 18% licensed listings)
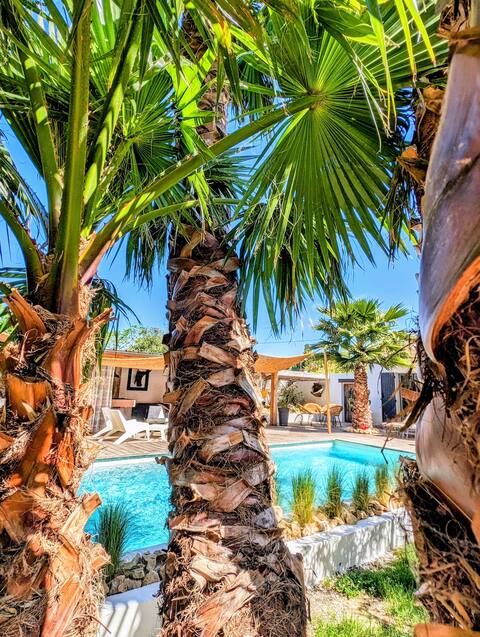
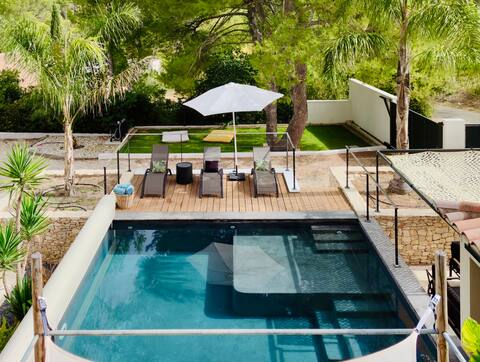
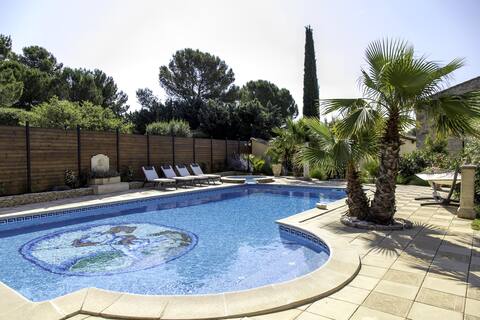
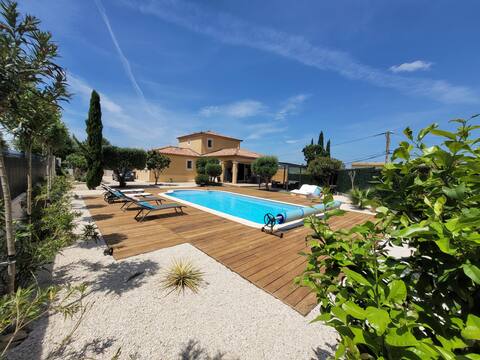
Top Performing Airbnb Properties in Langlade (2025)
Benchmark your potential! Explore examples of top-performing Airbnb properties in Langladebased on Trailing Twelve Month (TTM) revenue. Analyze their characteristics, revenue, occupancy rate, and ADR to understand what drives success in this market.
heated pool/hot tub/ sauna/billiards/7km Nîmes
Entire Place • 3 bedrooms
Guesthouse with Heated Pool
Entire Place • 3 bedrooms
Villa "Lou Simbèu 2": Quiet and Authenticity
Entire Place • 3 bedrooms
La Bergerie de Langlade
Entire Place • 3 bedrooms
Beautiful villa with swimming pool near Nîmes
Entire Place • N/A

Les Amourettes - Air-conditioned villa with swimming pool
Entire Place • 3 bedrooms
Note: Performance varies based on location, size, amenities, seasonality, and management quality. Data reflects the past 12 months.
Top Performing Airbnb Hosts in Langlade (2025)
Learn from the best! This table showcases top-performing Airbnb hosts in Langlade based on the number of properties managed and estimated total revenue over the past year. Analyze their scale and performance metrics.
| Host Name | Properties | Grossing Revenue | Stay Reviews | Avg Rating |
|---|---|---|---|---|
| Roselyne | 1 | $64,175 | 26 | 4.88/5.0 |
| Christophe | 3 | $57,100 | 68 | 4.89/5.0 |
| Julien | 1 | $51,669 | 31 | 5.00/5.0 |
| Kate | 1 | $42,609 | 60 | 4.82/5.0 |
| Najet | 1 | $37,339 | 99 | 4.98/5.0 |
| Cindy | 1 | $31,061 | 4 | 5.00/5.0 |
| La Conciergerie Du Croco | 1 | $26,663 | 8 | 4.88/5.0 |
| Anders Valdemar | 1 | $24,500 | 22 | 4.77/5.0 |
| Alexandre | 1 | $24,035 | 5 | 5.00/5.0 |
| Camille | 1 | $23,192 | 9 | 5.00/5.0 |
Analyzing the strategies of top hosts, such as their property selection, pricing, and guest communication, can offer valuable lessons for optimizing your own Airbnb operations in Langlade.
Dive Deeper: Advanced Langlade STR Market Data (2025)
Ready to unlock more insights? AirROI provides access to advanced metrics and comprehensive Airbnb data for Langlade. Explore detailed analytics beyond this report to refine your investment strategy, optimize pricing, and maximize your vacation rental profits.
Explore Advanced MetricsLanglade Short-Term Rental Market Composition (2025): Property & Room Types
Room Type Distribution
Property Type Distribution
Market Composition Insights for Langlade
- The Langlade Airbnb market composition is heavily skewed towards Entire Home/Apt listings, which make up 100% of the 22 active rentals. This indicates strong guest preference for privacy and space.
- Looking at the property type distribution in Langlade, House properties are the most common (77.3%), reflecting the local real estate landscape.
- Houses represent a significant 77.3% portion, catering likely to families or larger groups.
- Smaller segments like others (combined 4.5%) offer potential for unique stay experiences.
Langlade Airbnb Room Capacity Analysis (2025): Bedroom Distribution
Distribution of Listings by Number of Bedrooms
Room Capacity Insights for Langlade
- The dominant room capacity in Langlade is 3 bedrooms listings, making up 36.4% of the market. This suggests a strong demand for properties suitable for families or small groups.
- Together, 3 bedrooms and 4 bedrooms properties represent 59.1% of the active Airbnb listings in Langlade, indicating a high concentration in these sizes.
- A significant 63.6% of listings offer 3+ bedrooms, catering to larger groups and families seeking more space in Langlade.
Langlade Vacation Rental Guest Capacity Trends (2025)
Distribution of Listings by Guest Capacity
Guest Capacity Insights for Langlade
- The most common guest capacity trend in Langlade vacation rentals is listings accommodating 8+ guests (40.9%). This suggests the primary traveler segment is likely larger groups.
- Properties designed for 8+ guests and 6 guests dominate the Langlade STR market, accounting for 72.7% of listings.
- 77.2% of properties accommodate 6+ guests, serving the market segment for larger families or group travel in Langlade.
- On average, properties in Langlade are equipped to host 6.1 guests.
Langlade Airbnb Booking Patterns (2025): Available vs. Booked Days
Available Days Distribution
Booked Days Distribution
Booking Pattern Insights for Langlade
- The most common availability pattern in Langlade falls within the 271-366 days range, representing 50% of listings. This suggests many properties have significant open periods on their calendars.
- Approximately 77.3% of listings show high availability (181+ days open annually), indicating potential for increased bookings or specific owner usage patterns.
- For booked days, the 31-90 days range is most frequent in Langlade (40.9%), reflecting common guest stay durations or potential owner blocking patterns.
- A notable 27.2% of properties secure long booking periods (181+ days booked per year), highlighting successful long-term rental strategies or significant owner usage.
Langlade Airbnb Minimum Stay Requirements Analysis
Distribution of Listings by Minimum Night Requirement
1 Night
2 listings
9.5% of total
2 Nights
3 listings
14.3% of total
3 Nights
2 listings
9.5% of total
4-6 Nights
6 listings
28.6% of total
7-29 Nights
8 listings
38.1% of total
Key Insights
- The most prevalent minimum stay requirement in Langlade is 7-29 Nights, adopted by 38.1% of listings. This highlights the market's preference for shorter, flexible bookings.
Recommendations
- Align with the market by considering a 7-29 Nights minimum stay, as 38.1% of Langlade hosts use this setting.
- If feasible, allowing 1-night stays, especially midweek or during low season, could capture last-minute bookings, as only 9.5% currently do.
- Adjust minimum nights based on seasonality – potentially shorter during low season and longer during peak demand periods in Langlade.
Langlade Airbnb Cancellation Policy Trends Analysis (2025)
Flexible
6 listings
28.6% of total
Moderate
3 listings
14.3% of total
Firm
5 listings
23.8% of total
Strict
7 listings
33.3% of total
Cancellation Policy Insights for Langlade
- The prevailing Airbnb cancellation policy trend in Langlade is Strict, used by 33.3% of listings.
- A majority (57.1%) of hosts in Langlade utilize Firm or Strict policies, indicating a market where hosts prioritize booking security.
Recommendations for Hosts
- Consider adopting a Strict policy to align with the 33.3% market standard in Langlade.
- With 33.3% using Strict terms, this is a viable option in Langlade, particularly for high-value properties or during peak demand periods.
- Regularly review your cancellation policy against competitors and market demand shifts in Langlade.
Langlade STR Booking Lead Time Analysis (2025)
Average Booking Lead Time by Month
Booking Lead Time Insights for Langlade
- The overall average booking lead time for vacation rentals in Langlade is 97 days.
- Guests book furthest in advance for stays during July (average 161 days), likely coinciding with peak travel demand or local events.
- The shortest booking windows occur for stays in January (average 61 days), indicating more last-minute travel plans during this time.
- Seasonally, Summer (135 days avg.) sees the longest lead times, while Winter (83 days avg.) has the shortest, reflecting typical travel planning cycles.
Recommendations for Hosts
- Use the overall average lead time (97 days) as a baseline for your pricing and availability strategy in Langlade.
- For July stays, consider implementing length-of-stay discounts or slightly higher rates for bookings made less than 161 days out to capitalize on advance planning.
- Target marketing efforts for the Summer season well in advance (at least 135 days) to capture early planners.
- Monitor your own booking lead times against these Langlade averages to identify opportunities for dynamic pricing adjustments.
Popular & Essential Airbnb Amenities in Langlade (2025)
Amenity Prevalence
Amenity Insights for Langlade
- Essential amenities in Langlade that guests expect include: Wifi, TV, Kitchen, Heating, Free parking on premises, Hot water, Iron, Coffee maker, Smoke alarm, Air conditioning. Lacking these (any) could significantly impact bookings.
Recommendations for Hosts
- Ensure your listing includes all essential amenities for Langlade: Wifi, TV, Kitchen, Heating, Free parking on premises, Hot water, Iron, Coffee maker, Smoke alarm, Air conditioning.
- Prioritize adding missing essentials: Iron, Coffee maker, Smoke alarm, Air conditioning.
- Highlight unique or less common amenities you offer (e.g., hot tub, dedicated workspace, EV charger) in your listing description and photos.
- Regularly check competitor amenities in Langlade to stay competitive.
Langlade Airbnb Guest Demographics & Profile Analysis (2025)
Guest Profile Summary for Langlade
- The typical guest profile for Airbnb in Langlade consists of a mix of domestic (52%) and international guests, often arriving from nearby Lyon, typically belonging to the Post-2000s (Gen Z/Alpha) group (50%), primarily speaking English or French.
- Domestic travelers account for 51.6% of guests.
- Key international markets include France (51.6%) and United Kingdom (10.8%).
- Top languages spoken are English (35.1%) followed by French (28.6%).
- A significant demographic segment is the Post-2000s (Gen Z/Alpha) group, representing 50% of guests.
Recommendations for Hosts
- Balance marketing efforts between domestic and international channels based on the guest mix.
- Tailor amenities and listing descriptions to appeal to the dominant Post-2000s (Gen Z/Alpha) demographic (e.g., highlight fast WiFi, smart home features, local guides).
- Highlight unique local experiences or amenities relevant to the primary guest profile.
- Consider seasonal promotions aligned with peak travel times for key origin markets.
Nearby Short-Term Rental Market Comparison
How does the Langlade Airbnb market stack up against its neighbors? Compare key performance metrics like average monthly revenue, ADR, and occupancy rates in surrounding areas to understand the broader regional STR landscape.
| Market | Active Properties | Monthly Revenue | Daily Rate | Avg. Occupancy |
|---|---|---|---|---|
| Villeneuvette | 13 | $4,150 | $337.56 | 44% |
| Divajeu | 19 | $3,941 | $410.65 | 42% |
| Chantepérier | 20 | $3,057 | $281.60 | 37% |
| Rupià | 11 | $3,046 | $386.95 | 40% |
| Gordes | 225 | $2,913 | $366.32 | 43% |
| Redessan | 19 | $2,834 | $334.82 | 34% |
| Fontarèches | 11 | $2,802 | $525.31 | 34% |
| Ménerbes | 97 | $2,800 | $453.86 | 41% |
| La Bruguière | 14 | $2,732 | $277.64 | 50% |
| Soyans | 12 | $2,721 | $193.55 | 45% |