Fourques Airbnb Market Analysis 2025: Short Term Rental Data & Vacation Rental Statistics in Occitania, France
Is Airbnb profitable in Fourques in 2025? Explore comprehensive Airbnb analytics for Fourques, Occitania, France to uncover income potential. This 2025 STR market report for Fourques, based on AirROI data from April 2024 to March 2025, reveals key trends in the niche market of 60 active listings.
Whether you're considering an Airbnb investment in Fourques, optimizing your existing vacation rental, or exploring rental arbitrage opportunities, understanding the Fourques Airbnb data is crucial. Leveraging the low regulation environment is key to maximizing your short term rental income potential. Let's dive into the specifics.
Key Fourques Airbnb Performance Metrics Overview
Monthly Airbnb Revenue Variations & Income Potential in Fourques (2025)
Understanding the monthly revenue variations for Airbnb listings in Fourques is key to maximizing your short term rental income potential. Seasonality significantly impacts earnings. Our analysis, based on data from the past 12 months, shows that the peak revenue month for STRs in Fourques is typically August, while March often presents the lowest earnings, highlighting opportunities for strategic pricing adjustments during shoulder and low seasons. Explore the typical Airbnb income in Fourques across different performance tiers:
- Best-in-class properties (Top 10%) achieve $3,810+ monthly, often utilizing dynamic pricing and superior guest experiences.
- Strong performing properties (Top 25%) earn $1,954 or more, indicating effective management and desirable locations/amenities.
- Typical properties (Median) generate around $1,124 per month, representing the average market performance.
- Entry-level properties (Bottom 25%) see earnings around $543, often with potential for optimization.
Average Monthly Airbnb Earnings Trend in Fourques
Fourques Airbnb Occupancy Rate Trends (2025)
Maximize your bookings by understanding the Fourques STR occupancy trends. Seasonal demand shifts significantly influence how often properties are booked. Typically, Augustsees the highest demand (peak season occupancy), while March experiences the lowest (low season). Effective strategies, like adjusting minimum stays or offering promotions, can boost occupancy during slower periods. Here's how different property tiers perform in Fourques:
- Best-in-class properties (Top 10%) achieve 67%+ occupancy, indicating high desirability and potentially optimized availability.
- Strong performing properties (Top 25%) maintain 49% or higher occupancy, suggesting good market fit and guest satisfaction.
- Typical properties (Median) have an occupancy rate around 29%.
- Entry-level properties (Bottom 25%) average 13% occupancy, potentially facing higher vacancy.
Average Monthly Occupancy Rate Trend in Fourques
Average Daily Rate (ADR) Airbnb Trends in Fourques (2025)
Effective short term rental pricing strategy in Fourques involves understanding monthly ADR fluctuations. The Average Daily Rate (ADR) for Airbnb in Fourques typically peaks in July and dips lowest during October. Leveraging Airbnb dynamic pricing tools or strategies based on this seasonality can significantly boost revenue. Here's a look at the typical nightly rates achieved:
- Best-in-class properties (Top 10%) command rates of $314+ per night, often due to premium features or locations.
- Strong performing properties (Top 25%) achieve nightly rates of $195 or more.
- Typical properties (Median) charge around $116 per night.
- Entry-level properties (Bottom 25%) earn around $81 per night.
Average Daily Rate (ADR) Trend by Month in Fourques
Get Live Fourques Market Intelligence 👇

Explore Real-time Analytics
Airbnb Seasonality Analysis & Trends in Fourques (2025)
Peak Season (August, July, May)
- Revenue averages $2,865 per month
- Occupancy rates average 49.8%
- Daily rates average $178
Shoulder Season
- Revenue averages $1,524 per month
- Occupancy maintains around 29.8%
- Daily rates hold near $170
Low Season (January, February, March)
- Revenue drops to average $706 per month
- Occupancy decreases to average 23.6%
- Daily rates adjust to average $174
Seasonality Insights for Fourques
- The Airbnb seasonality in Fourques shows highly seasonal trends requiring careful strategy. While the sections above show seasonal averages, it's also insightful to look at the extremes:
- During the high season, the absolute peak month showcases Fourques's highest earning potential, with monthly revenues capable of climbing to $3,072, occupancy reaching a high of 56.3%, and ADRs peaking at $182.
- Conversely, the slowest single month of the year, typically falling within the low season, marks the market's lowest point. In this month, revenue might dip to $628, occupancy could drop to 20.5%, and ADRs may adjust down to $166.
- Understanding both the seasonal averages and these monthly peaks and troughs in revenue, occupancy, and ADR is crucial for maximizing your Airbnb profit potential in Fourques.
Seasonal Strategies for Maximizing Profit
- Peak Season: Maximize revenue through premium pricing and potentially longer minimum stays. Ensure high availability.
- Low Season: Offer competitive pricing, special promotions (e.g., extended stay discounts), and flexible cancellation policies. Target off-season travelers like remote workers or budget-conscious guests.
- Shoulder Seasons: Implement dynamic pricing that balances peak and low rates. Target weekend travelers or specific events. Offer slightly more flexible terms than peak season.
- Regularly analyze your own performance against these Fourques seasonality benchmarks and adjust your pricing and availability strategy accordingly.
Best Areas for Airbnb Investment in Fourques (2025)
Exploring the top neighborhoods for short-term rentals in Fourques? This section highlights key areas, outlining why they are attractive for hosts and guests, along with notable local attractions. Consider these locations based on your target guest profile and investment strategy.
| Neighborhood / Area | Why Host Here? (Target Guests & Appeal) | Key Attractions & Landmarks |
|---|---|---|
| Les Baux-de-Provence | A picturesque and historic village renowned for its stunning landscapes and rich heritage. Popular among tourists visiting the nearby Alpilles mountains. | Château des Baux, Carrières de Lumières, Saint-Vincent Church, Alpilles Natural Regional Park |
| Saint-Rémy-de-Provence | A charming Provençal town famous for its art, history, and proximity to Van Gogh's inspirations. A hub for tourists seeking cultural experiences. | Saint-Paul de Mausole, Roman ruins, Les Antiques, Crèches de Noël |
| Arles | A city rich in Roman history with many well-preserved ruins. Attracts tourists interested in history and arts. | Roman Amphitheatre, Van Gogh's Café, Arles Antique, Church of St. Trophime |
| Avignon | Known for its historical architecture and the famous Palais des Papes, Avignon draws many visitors each year, making it a prime location for Airbnb. | Palais des Papes, Pont Saint-Bénézet, Avignon Festival, Rocher des Doms |
| Orange | Famous for its Roman theatre and rich history, Orange attracts history enthusiasts and tourists looking for cultural experiences. | Théâtre antique d'Orange, Triumphal Arch, Musée d'Orange, Château de Orange |
| Camargue | Known for its unique natural landscapes and biodiversity. Perfect for nature lovers and those seeking outdoor activities. | Camargue Regional Nature Park, Wild horses, Flamingos, Saintes-Maries-de-la-Mer |
| Nîmes | Another city rich in Roman history, offering a wealth of attractions, making it a good target for Airbnb investments. | Les Arènes de Nîmes, Maison Carrée, Jardin de la Fontaine, Temple de Diane |
| Uzès | A stunning medieval town known for its charming streets and the famous Pont du Gard nearby. Attracts tourists who enjoy history and architecture. | Uzès Cathedral, Duche Castle, Pont du Gard, Place aux Herbes |
Understanding Airbnb License Requirements & STR Laws in Fourques (2025)
While Fourques, Occitania, France currently shows low STR regulations, specific Airbnb license requirements might still exist or change. Always verify the latest short term rental regulations and Airbnb license requirements directly with local government authorities for Fourques to ensure full compliance before hosting.
(Source: AirROI data, 2025, based on 8% licensed listings)
Top Performing Airbnb Properties in Fourques (2025)
Benchmark your potential! Explore examples of top-performing Airbnb properties in Fourquesbased on Trailing Twelve Month (TTM) revenue. Analyze their characteristics, revenue, occupancy rate, and ADR to understand what drives success in this market.
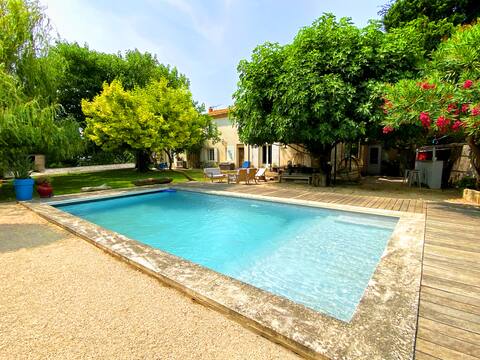
5 bedroom house, garden/pool 5 min from Arles
Entire Place • 5 bedrooms
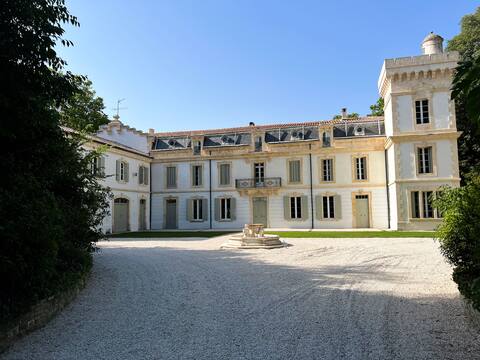
Chateau de Paon - Le Coeur (20 people)
Entire Place • 10 bedrooms
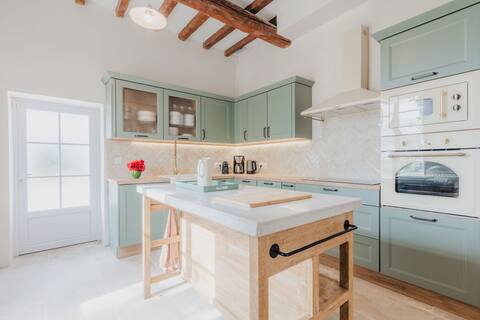
Sunny Provence - Countryside home with pool
Entire Place • 4 bedrooms
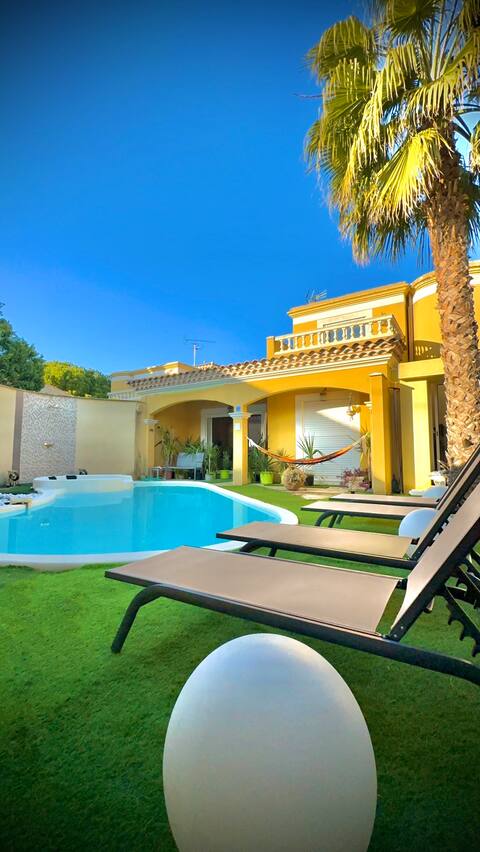
The Soleil villa
Entire Place • 3 bedrooms
Near Arles, a Riad in the Camargue
Entire Place • 5 bedrooms
Remy and Maricarmen's Home
Entire Place • 4 bedrooms
Note: Performance varies based on location, size, amenities, seasonality, and management quality. Data reflects the past 12 months.
Top Performing Airbnb Hosts in Fourques (2025)
Learn from the best! This table showcases top-performing Airbnb hosts in Fourques based on the number of properties managed and estimated total revenue over the past year. Analyze their scale and performance metrics.
| Host Name | Properties | Grossing Revenue | Stay Reviews | Avg Rating |
|---|---|---|---|---|
| Béatrice | 12 | $94,701 | 74 | 4.41/5.0 |
| Zoe | 2 | $74,051 | 7 | 2.50/5.0 |
| Alexandre | 1 | $68,751 | 10 | 4.90/5.0 |
| Jacky | 2 | $64,443 | 63 | 4.54/5.0 |
| Valerie Jerome | 2 | $48,035 | 204 | 4.97/5.0 |
| Garret | 1 | $43,623 | 12 | 5.00/5.0 |
| Philippe Et Leila | 1 | $38,855 | 157 | 4.83/5.0 |
| Maricarmen | 1 | $38,749 | 14 | 4.93/5.0 |
| Patrice | 1 | $26,867 | 15 | 4.80/5.0 |
| Thierry | 1 | $26,180 | 10 | 5.00/5.0 |
Analyzing the strategies of top hosts, such as their property selection, pricing, and guest communication, can offer valuable lessons for optimizing your own Airbnb operations in Fourques.
Dive Deeper: Advanced Fourques STR Market Data (2025)
Ready to unlock more insights? AirROI provides access to advanced metrics and comprehensive Airbnb data for Fourques. Explore detailed analytics beyond this report to refine your investment strategy, optimize pricing, and maximize your vacation rental profits.
Explore Advanced MetricsFourques Short-Term Rental Market Composition (2025): Property & Room Types
Room Type Distribution
Property Type Distribution
Market Composition Insights for Fourques
- The Fourques Airbnb market composition is heavily skewed towards Entire Home/Apt listings, which make up 83.3% of the 60 active rentals. This indicates strong guest preference for privacy and space.
- Looking at the property type distribution in Fourques, House properties are the most common (60%), reflecting the local real estate landscape.
- Houses represent a significant 60% portion, catering likely to families or larger groups.
- The presence of 11.7% Hotel/Boutique listings indicates integration with traditional hospitality.
- Smaller segments like unique stays, outdoor/unique, others (combined 8.3%) offer potential for unique stay experiences.
Fourques Airbnb Room Capacity Analysis (2025): Bedroom Distribution
Distribution of Listings by Number of Bedrooms
Room Capacity Insights for Fourques
- The dominant room capacity in Fourques is 1 bedroom listings, making up 36.7% of the market. This suggests a strong demand for properties suitable for couples or solo travelers.
- Together, 1 bedroom and 2 bedrooms properties represent 60.0% of the active Airbnb listings in Fourques, indicating a high concentration in these sizes.
- A significant 30.0% of listings offer 3+ bedrooms, catering to larger groups and families seeking more space in Fourques.
Fourques Vacation Rental Guest Capacity Trends (2025)
Distribution of Listings by Guest Capacity
Guest Capacity Insights for Fourques
- The most common guest capacity trend in Fourques vacation rentals is listings accommodating 4 guests (28.3%). This suggests the primary traveler segment is likely small families or groups.
- Properties designed for 4 guests and 2 guests dominate the Fourques STR market, accounting for 50.0% of listings.
- 31.7% of properties accommodate 6+ guests, serving the market segment for larger families or group travel in Fourques.
- On average, properties in Fourques are equipped to host 4.1 guests.
Fourques Airbnb Booking Patterns (2025): Available vs. Booked Days
Available Days Distribution
Booked Days Distribution
Booking Pattern Insights for Fourques
- The most common availability pattern in Fourques falls within the 271-366 days range, representing 53.3% of listings. This suggests many properties have significant open periods on their calendars.
- Approximately 85.0% of listings show high availability (181+ days open annually), indicating potential for increased bookings or specific owner usage patterns.
- For booked days, the 91-180 days range is most frequent in Fourques (35%), reflecting common guest stay durations or potential owner blocking patterns.
- A notable 15.0% of properties secure long booking periods (181+ days booked per year), highlighting successful long-term rental strategies or significant owner usage.
Fourques Airbnb Minimum Stay Requirements Analysis
Distribution of Listings by Minimum Night Requirement
1 Night
13 listings
23.2% of total
2 Nights
19 listings
33.9% of total
3 Nights
11 listings
19.6% of total
4-6 Nights
9 listings
16.1% of total
7-29 Nights
1 listings
1.8% of total
30+ Nights
3 listings
5.4% of total
Key Insights
- The most prevalent minimum stay requirement in Fourques is 2 Nights, adopted by 33.9% of listings. This highlights the market's preference for shorter, flexible bookings.
Recommendations
- Align with the market by considering a 2 Nights minimum stay, as 33.9% of Fourques hosts use this setting.
- If feasible, allowing 1-night stays, especially midweek or during low season, could capture last-minute bookings, as only 23.2% currently do.
- Explore offering discounts for stays of 30+ nights to attract the 5.4% of the market seeking extended stays.
- Adjust minimum nights based on seasonality – potentially shorter during low season and longer during peak demand periods in Fourques.
Fourques Airbnb Cancellation Policy Trends Analysis (2025)
Flexible
20 listings
37% of total
Moderate
14 listings
25.9% of total
Firm
15 listings
27.8% of total
Strict
5 listings
9.3% of total
Cancellation Policy Insights for Fourques
- The prevailing Airbnb cancellation policy trend in Fourques is Flexible, used by 37% of listings.
- There's a relatively balanced mix between guest-friendly (62.9%) and stricter (37.1%) policies, offering choices for different guest needs.
- Strict cancellation policies are quite rare (9.3%), potentially making listings with this policy less competitive unless justified by high demand or property type.
Recommendations for Hosts
- Consider adopting a Flexible policy to align with the 37% market standard in Fourques.
- Using a Strict policy might deter some guests, as only 9.3% of listings use it. Evaluate if potential revenue protection outweighs possible lower booking rates.
- Regularly review your cancellation policy against competitors and market demand shifts in Fourques.
Fourques STR Booking Lead Time Analysis (2025)
Average Booking Lead Time by Month
Booking Lead Time Insights for Fourques
- The overall average booking lead time for vacation rentals in Fourques is 57 days.
- Guests book furthest in advance for stays during July (average 87 days), likely coinciding with peak travel demand or local events.
- The shortest booking windows occur for stays in January (average 25 days), indicating more last-minute travel plans during this time.
- Seasonally, Summer (78 days avg.) sees the longest lead times, while Winter (41 days avg.) has the shortest, reflecting typical travel planning cycles.
Recommendations for Hosts
- Use the overall average lead time (57 days) as a baseline for your pricing and availability strategy in Fourques.
- For July stays, consider implementing length-of-stay discounts or slightly higher rates for bookings made less than 87 days out to capitalize on advance planning.
- Target marketing efforts for the Summer season well in advance (at least 78 days) to capture early planners.
- Monitor your own booking lead times against these Fourques averages to identify opportunities for dynamic pricing adjustments.
Popular & Essential Airbnb Amenities in Fourques (2025)
Amenity Prevalence
Amenity Insights for Fourques
- Essential amenities in Fourques that guests expect include: Wifi. Lacking these (this) could significantly impact bookings.
- Popular amenities like Heating, TV, Kitchen are common but not universal. Offering these can provide a competitive edge.
Recommendations for Hosts
- Ensure your listing includes all essential amenities for Fourques: Wifi.
- Prioritize adding missing essentials: Wifi.
- Consider adding popular differentiators like Heating or TV to increase appeal.
- Highlight unique or less common amenities you offer (e.g., hot tub, dedicated workspace, EV charger) in your listing description and photos.
- Regularly check competitor amenities in Fourques to stay competitive.
Fourques Airbnb Guest Demographics & Profile Analysis (2025)
Guest Profile Summary for Fourques
- The typical guest profile for Airbnb in Fourques consists of primarily domestic travelers (71%), often arriving from nearby Paris, typically belonging to the Post-2000s (Gen Z/Alpha) group (50%), primarily speaking French or English.
- Domestic travelers account for 70.8% of guests.
- Key international markets include France (70.8%) and Italy (6.6%).
- Top languages spoken are French (38%) followed by English (33.4%).
- A significant demographic segment is the Post-2000s (Gen Z/Alpha) group, representing 50% of guests.
Recommendations for Hosts
- Target domestic marketing efforts towards travelers from Paris and Lyon.
- Tailor amenities and listing descriptions to appeal to the dominant Post-2000s (Gen Z/Alpha) demographic (e.g., highlight fast WiFi, smart home features, local guides).
- Highlight unique local experiences or amenities relevant to the primary guest profile.
- Consider seasonal promotions aligned with peak travel times for key origin markets.
Nearby Short-Term Rental Market Comparison
How does the Fourques Airbnb market stack up against its neighbors? Compare key performance metrics like average monthly revenue, ADR, and occupancy rates in surrounding areas to understand the broader regional STR landscape.
| Market | Active Properties | Monthly Revenue | Daily Rate | Avg. Occupancy |
|---|---|---|---|---|
| Villeneuvette | 13 | $4,150 | $337.56 | 44% |
| Divajeu | 19 | $3,941 | $410.65 | 42% |
| Chantepérier | 20 | $3,057 | $281.60 | 37% |
| Rupià | 11 | $3,046 | $386.95 | 40% |
| Gordes | 225 | $2,913 | $366.32 | 43% |
| Redessan | 19 | $2,834 | $334.82 | 34% |
| Fontarèches | 11 | $2,802 | $525.31 | 34% |
| Ménerbes | 97 | $2,800 | $453.86 | 41% |
| La Bruguière | 14 | $2,732 | $277.64 | 50% |
| Soyans | 12 | $2,721 | $193.55 | 45% |