Fleurance Airbnb Market Analysis 2025: Short Term Rental Data & Vacation Rental Statistics in Occitania, France
Is Airbnb profitable in Fleurance in 2025? Explore comprehensive Airbnb analytics for Fleurance, Occitania, France to uncover income potential. This 2025 STR market report for Fleurance, based on AirROI data from April 2024 to March 2025, reveals key trends in the niche market of 17 active listings.
Whether you're considering an Airbnb investment in Fleurance, optimizing your existing vacation rental, or exploring rental arbitrage opportunities, understanding the Fleurance Airbnb data is crucial. Leveraging the low regulation environment is key to maximizing your short term rental income potential. Let's dive into the specifics.
Key Fleurance Airbnb Performance Metrics Overview
Monthly Airbnb Revenue Variations & Income Potential in Fleurance (2025)
Understanding the monthly revenue variations for Airbnb listings in Fleurance is key to maximizing your short term rental income potential. Seasonality significantly impacts earnings. Our analysis, based on data from the past 12 months, shows that the peak revenue month for STRs in Fleurance is typically August, while March often presents the lowest earnings, highlighting opportunities for strategic pricing adjustments during shoulder and low seasons. Explore the typical Airbnb income in Fleurance across different performance tiers:
- Best-in-class properties (Top 10%) achieve $2,164+ monthly, often utilizing dynamic pricing and superior guest experiences.
- Strong performing properties (Top 25%) earn $1,540 or more, indicating effective management and desirable locations/amenities.
- Typical properties (Median) generate around $942 per month, representing the average market performance.
- Entry-level properties (Bottom 25%) see earnings around $390, often with potential for optimization.
Average Monthly Airbnb Earnings Trend in Fleurance
Fleurance Airbnb Occupancy Rate Trends (2025)
Maximize your bookings by understanding the Fleurance STR occupancy trends. Seasonal demand shifts significantly influence how often properties are booked. Typically, Augustsees the highest demand (peak season occupancy), while March experiences the lowest (low season). Effective strategies, like adjusting minimum stays or offering promotions, can boost occupancy during slower periods. Here's how different property tiers perform in Fleurance:
- Best-in-class properties (Top 10%) achieve 71%+ occupancy, indicating high desirability and potentially optimized availability.
- Strong performing properties (Top 25%) maintain 53% or higher occupancy, suggesting good market fit and guest satisfaction.
- Typical properties (Median) have an occupancy rate around 32%.
- Entry-level properties (Bottom 25%) average 19% occupancy, potentially facing higher vacancy.
Average Monthly Occupancy Rate Trend in Fleurance
Average Daily Rate (ADR) Airbnb Trends in Fleurance (2025)
Effective short term rental pricing strategy in Fleurance involves understanding monthly ADR fluctuations. The Average Daily Rate (ADR) for Airbnb in Fleurance typically peaks in July and dips lowest during December. Leveraging Airbnb dynamic pricing tools or strategies based on this seasonality can significantly boost revenue. Here's a look at the typical nightly rates achieved:
- Best-in-class properties (Top 10%) command rates of $118+ per night, often due to premium features or locations.
- Strong performing properties (Top 25%) achieve nightly rates of $98 or more.
- Typical properties (Median) charge around $73 per night.
- Entry-level properties (Bottom 25%) earn around $57 per night.
Average Daily Rate (ADR) Trend by Month in Fleurance
Get Live Fleurance Market Intelligence 👇

Explore Real-time Analytics
Airbnb Seasonality Analysis & Trends in Fleurance (2025)
Peak Season (August, June, July)
- Revenue averages $1,465 per month
- Occupancy rates average 42.6%
- Daily rates average $92
Shoulder Season
- Revenue averages $1,141 per month
- Occupancy maintains around 38.4%
- Daily rates hold near $87
Low Season (January, February, March)
- Revenue drops to average $566 per month
- Occupancy decreases to average 27.8%
- Daily rates adjust to average $77
Seasonality Insights for Fleurance
- The Airbnb seasonality in Fleurance shows highly seasonal trends requiring careful strategy. While the sections above show seasonal averages, it's also insightful to look at the extremes:
- During the high season, the absolute peak month showcases Fleurance's highest earning potential, with monthly revenues capable of climbing to $1,613, occupancy reaching a high of 51.4%, and ADRs peaking at $92.
- Conversely, the slowest single month of the year, typically falling within the low season, marks the market's lowest point. In this month, revenue might dip to $410, occupancy could drop to 22.3%, and ADRs may adjust down to $76.
- Understanding both the seasonal averages and these monthly peaks and troughs in revenue, occupancy, and ADR is crucial for maximizing your Airbnb profit potential in Fleurance.
Seasonal Strategies for Maximizing Profit
- Peak Season: Maximize revenue through premium pricing and potentially longer minimum stays. Ensure high availability.
- Low Season: Offer competitive pricing, special promotions (e.g., extended stay discounts), and flexible cancellation policies. Target off-season travelers like remote workers or budget-conscious guests.
- Shoulder Seasons: Implement dynamic pricing that balances peak and low rates. Target weekend travelers or specific events. Offer slightly more flexible terms than peak season.
- Regularly analyze your own performance against these Fleurance seasonality benchmarks and adjust your pricing and availability strategy accordingly.
Best Areas for Airbnb Investment in Fleurance (2025)
Exploring the top neighborhoods for short-term rentals in Fleurance? This section highlights key areas, outlining why they are attractive for hosts and guests, along with notable local attractions. Consider these locations based on your target guest profile and investment strategy.
| Neighborhood / Area | Why Host Here? (Target Guests & Appeal) | Key Attractions & Landmarks |
|---|---|---|
| Fleurance Town Center | The heart of Fleurance with quaint streets, local shops, and eateries. Ideal for tourists looking to experience the local culture and community of this charming town. | Fleurance Market, Church of St. John the Baptist, Local artisan shops, Théâtre de Fleurance, Bicycle paths along the Garonne |
| Historical Sites Area | Rich in history, this area showcases the beautiful architecture and heritage of Fleurance, attracting history buffs and culture seekers alike. | Ancient Roman ruins, Historical buildings, Museums, Cultural events in summer, Local festivals |
| Nearby Vineyards | Situated in the vicinity of renowned vineyards, this area attracts wine enthusiasts and those looking to relax amidst beautiful landscapes and wine tours. | Wine tasting tours, Vineyard visits, Scenic picnic spots, Local wine festivals, Gastronomic experiences |
| Parks and Outdoor Spaces | Fleurance is surrounded by lush parks and natural landscapes, perfect for families and outdoor lovers seeking recreation and relaxation. | Parc de la Mairie, River Garonne trails, Picnic areas, Playgrounds, Outdoor sports facilities |
| Village Life | Experience the charm of the French countryside in this area filled with picturesque villages, small farms, and a slower pace of life. | Local farmer's markets, Artisan workshops, Traditional cuisine, Biking and hiking trails, Community gatherings |
| Cultural Events District | This area hosts various cultural events throughout the year, attracting visitors interested in local art and festivities. | Annual music festivals, Art exhibitions, Food fairs, Theater performances, Craft markets |
| Golf and Recreation | Home to a beautfiul golf course, this area appeals to sports enthusiasts and travelers looking for recreational activities. | Golf courses, Tennis courts, Horseback riding, Hiking trails, Wellness retreats |
| Family-friendly Zones | Areas filled with amenities that cater to families, making it a suitable choice for visitors traveling with children. | Play areas, Family restaurants, Kids' activities, Outdoor parks, Friendly local services |
Understanding Airbnb License Requirements & STR Laws in Fleurance (2025)
While Fleurance, Occitania, France currently shows low STR regulations, specific Airbnb license requirements might still exist or change. Always verify the latest short term rental regulations and Airbnb license requirements directly with local government authorities for Fleurance to ensure full compliance before hosting.
(Source: AirROI data, 2025, finding no licensed listings among those analyzed)
Top Performing Airbnb Properties in Fleurance (2025)
Benchmark your potential! Explore examples of top-performing Airbnb properties in Fleurancebased on Trailing Twelve Month (TTM) revenue. Analyze their characteristics, revenue, occupancy rate, and ADR to understand what drives success in this market.
Authentic family home.
Entire Place • 3 bedrooms
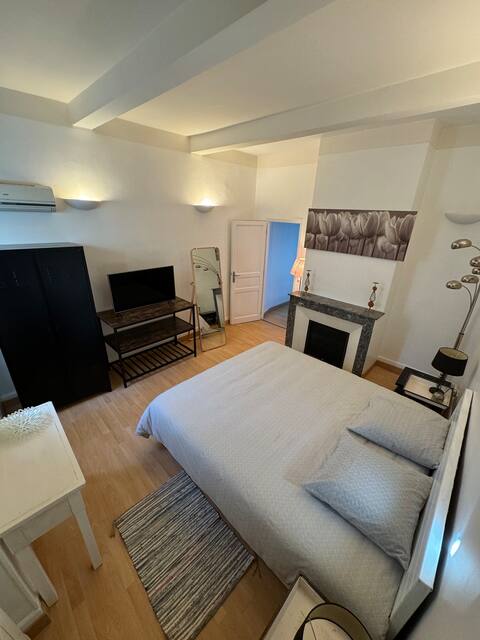
Charming townhouse
Entire Place • 3 bedrooms
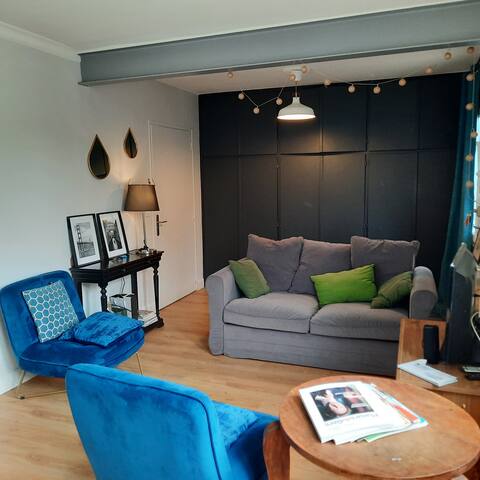
Hypercenter apartment
Entire Place • 1 bedroom
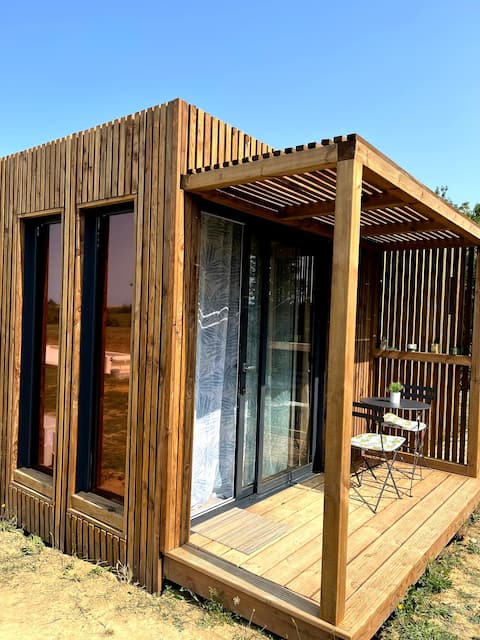
Cozy wooden chalet with pool to share
Entire Place • 1 bedroom
Gersoise Family Home
Entire Place • 4 bedrooms

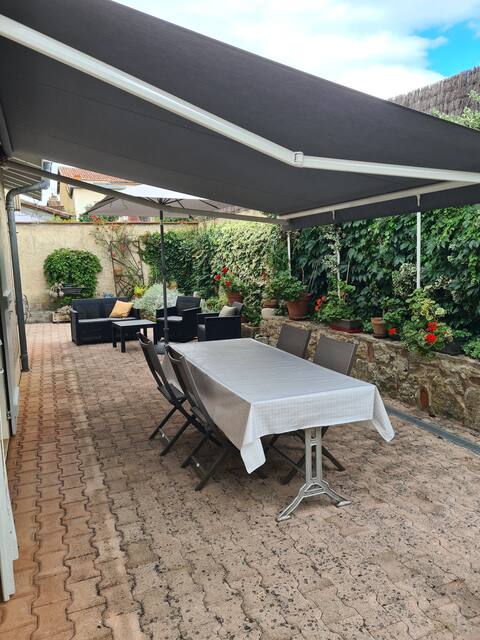
House with summer pool.
Entire Place • 2 bedrooms
Note: Performance varies based on location, size, amenities, seasonality, and management quality. Data reflects the past 12 months.
Top Performing Airbnb Hosts in Fleurance (2025)
Learn from the best! This table showcases top-performing Airbnb hosts in Fleurance based on the number of properties managed and estimated total revenue over the past year. Analyze their scale and performance metrics.
| Host Name | Properties | Grossing Revenue | Stay Reviews | Avg Rating |
|---|---|---|---|---|
| Claire Dom | 1 | $20,375 | 9 | 5.00/5.0 |
| Severine | 1 | $13,622 | 7 | 5.00/5.0 |
| Sabah | 1 | $13,008 | 11 | 5.00/5.0 |
| Jennifer | 1 | $12,946 | 35 | 4.91/5.0 |
| Marion | 1 | $12,653 | 33 | 4.85/5.0 |
| Anne-Lie | 2 | $11,500 | 23 | 4.92/5.0 |
| Marie-Line | 1 | $9,679 | 12 | 5.00/5.0 |
| Thibaut | 1 | $9,404 | 19 | 4.47/5.0 |
| Celine | 1 | $9,130 | 161 | 4.74/5.0 |
| Jean Michel | 1 | $8,804 | 22 | 4.91/5.0 |
Analyzing the strategies of top hosts, such as their property selection, pricing, and guest communication, can offer valuable lessons for optimizing your own Airbnb operations in Fleurance.
Dive Deeper: Advanced Fleurance STR Market Data (2025)
Ready to unlock more insights? AirROI provides access to advanced metrics and comprehensive Airbnb data for Fleurance. Explore detailed analytics beyond this report to refine your investment strategy, optimize pricing, and maximize your vacation rental profits.
Explore Advanced MetricsFleurance Short-Term Rental Market Composition (2025): Property & Room Types
Room Type Distribution
Property Type Distribution
Market Composition Insights for Fleurance
- The Fleurance Airbnb market composition is heavily skewed towards Entire Home/Apt listings, which make up 94.1% of the 17 active rentals. This indicates strong guest preference for privacy and space.
- Looking at the property type distribution in Fleurance, House properties are the most common (58.8%), reflecting the local real estate landscape.
- Houses represent a significant 58.8% portion, catering likely to families or larger groups.
- The presence of 5.9% Hotel/Boutique listings indicates integration with traditional hospitality.
Fleurance Airbnb Room Capacity Analysis (2025): Bedroom Distribution
Distribution of Listings by Number of Bedrooms
Room Capacity Insights for Fleurance
- The dominant room capacity in Fleurance is 1 bedroom listings, making up 41.2% of the market. This suggests a strong demand for properties suitable for couples or solo travelers.
- Together, 1 bedroom and 3 bedrooms properties represent 64.7% of the active Airbnb listings in Fleurance, indicating a high concentration in these sizes.
- A significant 29.4% of listings offer 3+ bedrooms, catering to larger groups and families seeking more space in Fleurance.
Fleurance Vacation Rental Guest Capacity Trends (2025)
Distribution of Listings by Guest Capacity
Guest Capacity Insights for Fleurance
- The most common guest capacity trend in Fleurance vacation rentals is listings accommodating 6 guests (29.4%). This suggests the primary traveler segment is likely larger groups.
- Properties designed for 6 guests and 2 guests dominate the Fleurance STR market, accounting for 58.8% of listings.
- 35.3% of properties accommodate 6+ guests, serving the market segment for larger families or group travel in Fleurance.
- On average, properties in Fleurance are equipped to host 4.1 guests.
Fleurance Airbnb Booking Patterns (2025): Available vs. Booked Days
Available Days Distribution
Booked Days Distribution
Booking Pattern Insights for Fleurance
- The most common availability pattern in Fleurance falls within the 181-270 days range, representing 47.1% of listings. This suggests many properties have significant open periods on their calendars.
- Approximately 88.3% of listings show high availability (181+ days open annually), indicating potential for increased bookings or specific owner usage patterns.
- For booked days, the 91-180 days range is most frequent in Fleurance (47.1%), reflecting common guest stay durations or potential owner blocking patterns.
- A notable 11.8% of properties secure long booking periods (181+ days booked per year), highlighting successful long-term rental strategies or significant owner usage.
Fleurance Airbnb Minimum Stay Requirements Analysis
Distribution of Listings by Minimum Night Requirement
1 Night
8 listings
47.1% of total
2 Nights
5 listings
29.4% of total
3 Nights
1 listings
5.9% of total
4-6 Nights
2 listings
11.8% of total
30+ Nights
1 listings
5.9% of total
Key Insights
- The most prevalent minimum stay requirement in Fleurance is 1 Night, adopted by 47.1% of listings. This highlights the market's preference for shorter, flexible bookings.
- A strong majority (76.5%) of the Fleurance Airbnb data shows acceptance of very short stays (1-2 nights), indicating a dynamic, high-turnover market.
Recommendations
- Align with the market by considering a 1 Night minimum stay, as 47.1% of Fleurance hosts use this setting.
- Explore offering discounts for stays of 30+ nights to attract the 5.9% of the market seeking extended stays.
- Adjust minimum nights based on seasonality – potentially shorter during low season and longer during peak demand periods in Fleurance.
Fleurance Airbnb Cancellation Policy Trends Analysis (2025)
Flexible
7 listings
46.7% of total
Moderate
4 listings
26.7% of total
Firm
3 listings
20% of total
Strict
1 listings
6.7% of total
Cancellation Policy Insights for Fleurance
- The prevailing Airbnb cancellation policy trend in Fleurance is Flexible, used by 46.7% of listings.
- The market strongly favors guest-friendly terms, with 73.4% of listings offering Flexible or Moderate policies. This suggests guests in Fleurance may expect booking flexibility.
- Strict cancellation policies are quite rare (6.7%), potentially making listings with this policy less competitive unless justified by high demand or property type.
Recommendations for Hosts
- Consider adopting a Flexible policy to align with the 46.7% market standard in Fleurance.
- Using a Strict policy might deter some guests, as only 6.7% of listings use it. Evaluate if potential revenue protection outweighs possible lower booking rates.
- Regularly review your cancellation policy against competitors and market demand shifts in Fleurance.
Fleurance STR Booking Lead Time Analysis (2025)
Average Booking Lead Time by Month
Booking Lead Time Insights for Fleurance
- The overall average booking lead time for vacation rentals in Fleurance is 34 days.
- Guests book furthest in advance for stays during July (average 76 days), likely coinciding with peak travel demand or local events.
- The shortest booking windows occur for stays in November (average 9 days), indicating more last-minute travel plans during this time.
- Seasonally, Summer (58 days avg.) sees the longest lead times, while Fall (14 days avg.) has the shortest, reflecting typical travel planning cycles.
Recommendations for Hosts
- Use the overall average lead time (34 days) as a baseline for your pricing and availability strategy in Fleurance.
- For July stays, consider implementing length-of-stay discounts or slightly higher rates for bookings made less than 76 days out to capitalize on advance planning.
- During November, focus on last-minute booking availability and promotions, as guests book with very short notice (9 days avg.).
- Target marketing efforts for the Summer season well in advance (at least 58 days) to capture early planners.
- Monitor your own booking lead times against these Fleurance averages to identify opportunities for dynamic pricing adjustments.
Popular & Essential Airbnb Amenities in Fleurance (2025)
Amenity Prevalence
Amenity Insights for Fleurance
- Popular amenities like Kitchen, Free parking on premises, TV are common but not universal. Offering these can provide a competitive edge.
- Warning: Wifi is not universally provided but is considered essential globally. Ensure reliable Wifi is offered.
Recommendations for Hosts
- Consider adding popular differentiators like Kitchen or Free parking on premises to increase appeal.
- Highlight unique or less common amenities you offer (e.g., hot tub, dedicated workspace, EV charger) in your listing description and photos.
- Regularly check competitor amenities in Fleurance to stay competitive.
Fleurance Airbnb Guest Demographics & Profile Analysis (2025)
Guest Profile Summary for Fleurance
- The typical guest profile for Airbnb in Fleurance consists of primarily domestic travelers (91%), often arriving from nearby Bordeaux, typically belonging to the Post-2000s (Gen Z/Alpha) group (50%), primarily speaking French or English.
- Domestic travelers account for 91.2% of guests.
- Key international markets include France (91.2%) and Spain (2%).
- Top languages spoken are French (50.5%) followed by English (29.7%).
- A significant demographic segment is the Post-2000s (Gen Z/Alpha) group, representing 50% of guests.
Recommendations for Hosts
- Target domestic marketing efforts towards travelers from Bordeaux and Paris.
- Tailor amenities and listing descriptions to appeal to the dominant Post-2000s (Gen Z/Alpha) demographic (e.g., highlight fast WiFi, smart home features, local guides).
- Highlight unique local experiences or amenities relevant to the primary guest profile.
- Consider seasonal promotions aligned with peak travel times for key origin markets.
Nearby Short-Term Rental Market Comparison
How does the Fleurance Airbnb market stack up against its neighbors? Compare key performance metrics like average monthly revenue, ADR, and occupancy rates in surrounding areas to understand the broader regional STR landscape.
| Market | Active Properties | Monthly Revenue | Daily Rate | Avg. Occupancy |
|---|---|---|---|---|
| la Baronia de Rialb | 14 | $4,296 | $393.88 | 43% |
| Saint-Laurent-des-Combes | 11 | $3,526 | $706.18 | 23% |
| Astaffort | 10 | $3,393 | $314.20 | 35% |
| Coll de Nargó | 14 | $2,843 | $254.89 | 37% |
| les Escaldes | 30 | $2,832 | $230.13 | 43% |
| Andorra la Vella | 43 | $2,776 | $189.18 | 43% |
| Cénac | 18 | $2,773 | $268.58 | 53% |
| Cérons | 11 | $2,635 | $196.16 | 39% |
| Galgon | 12 | $2,599 | $210.34 | 48% |
| Eynesse | 14 | $2,564 | $282.87 | 36% |