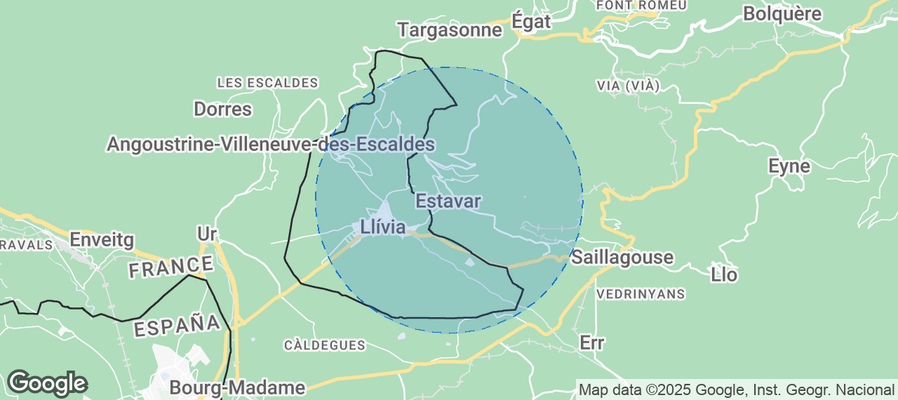
Estavar Airbnb Market Analysis 2025: Short Term Rental Data & Vacation Rental Statistics in Occitania, France
Is Airbnb profitable in Estavar in 2025? Explore comprehensive Airbnb analytics for Estavar, Occitania, France to uncover income potential. This 2025 STR market report for Estavar, based on AirROI data from April 2024 to March 2025, reveals key trends in the niche market of 48 active listings.
Whether you're considering an Airbnb investment in Estavar, optimizing your existing vacation rental, or exploring rental arbitrage opportunities, understanding the Estavar Airbnb data is crucial. Leveraging the low regulation environment is key to maximizing your short term rental income potential. Let's dive into the specifics.
Key Estavar Airbnb Performance Metrics Overview
Monthly Airbnb Revenue Variations & Income Potential in Estavar (2025)
Understanding the monthly revenue variations for Airbnb listings in Estavar is key to maximizing your short term rental income potential. Seasonality significantly impacts earnings. Our analysis, based on data from the past 12 months, shows that the peak revenue month for STRs in Estavar is typically August, while September often presents the lowest earnings, highlighting opportunities for strategic pricing adjustments during shoulder and low seasons. Explore the typical Airbnb income in Estavar across different performance tiers:
- Best-in-class properties (Top 10%) achieve $3,497+ monthly, often utilizing dynamic pricing and superior guest experiences.
- Strong performing properties (Top 25%) earn $2,266 or more, indicating effective management and desirable locations/amenities.
- Typical properties (Median) generate around $1,279 per month, representing the average market performance.
- Entry-level properties (Bottom 25%) see earnings around $675, often with potential for optimization.
Average Monthly Airbnb Earnings Trend in Estavar
Estavar Airbnb Occupancy Rate Trends (2025)
Maximize your bookings by understanding the Estavar STR occupancy trends. Seasonal demand shifts significantly influence how often properties are booked. Typically, Februarysees the highest demand (peak season occupancy), while September experiences the lowest (low season). Effective strategies, like adjusting minimum stays or offering promotions, can boost occupancy during slower periods. Here's how different property tiers perform in Estavar:
- Best-in-class properties (Top 10%) achieve 67%+ occupancy, indicating high desirability and potentially optimized availability.
- Strong performing properties (Top 25%) maintain 41% or higher occupancy, suggesting good market fit and guest satisfaction.
- Typical properties (Median) have an occupancy rate around 24%.
- Entry-level properties (Bottom 25%) average 13% occupancy, potentially facing higher vacancy.
Average Monthly Occupancy Rate Trend in Estavar
Average Daily Rate (ADR) Airbnb Trends in Estavar (2025)
Effective short term rental pricing strategy in Estavar involves understanding monthly ADR fluctuations. The Average Daily Rate (ADR) for Airbnb in Estavar typically peaks in December and dips lowest during September. Leveraging Airbnb dynamic pricing tools or strategies based on this seasonality can significantly boost revenue. Here's a look at the typical nightly rates achieved:
- Best-in-class properties (Top 10%) command rates of $270+ per night, often due to premium features or locations.
- Strong performing properties (Top 25%) achieve nightly rates of $217 or more.
- Typical properties (Median) charge around $160 per night.
- Entry-level properties (Bottom 25%) earn around $108 per night.
Average Daily Rate (ADR) Trend by Month in Estavar
Get Live Estavar Market Intelligence 👇
Explore Real-time Analytics
Airbnb Seasonality Analysis & Trends in Estavar (2025)
Peak Season (August, February, May)
- Revenue averages $2,348 per month
- Occupancy rates average 41.7%
- Daily rates average $169
Shoulder Season
- Revenue averages $1,654 per month
- Occupancy maintains around 28.3%
- Daily rates hold near $170
Low Season (September, October, November)
- Revenue drops to average $1,001 per month
- Occupancy decreases to average 23.2%
- Daily rates adjust to average $161
Seasonality Insights for Estavar
- The Airbnb seasonality in Estavar shows highly seasonal trends requiring careful strategy. While the sections above show seasonal averages, it's also insightful to look at the extremes:
- During the high season, the absolute peak month showcases Estavar's highest earning potential, with monthly revenues capable of climbing to $2,841, occupancy reaching a high of 45.4%, and ADRs peaking at $184.
- Conversely, the slowest single month of the year, typically falling within the low season, marks the market's lowest point. In this month, revenue might dip to $916, occupancy could drop to 23.1%, and ADRs may adjust down to $158.
- Understanding both the seasonal averages and these monthly peaks and troughs in revenue, occupancy, and ADR is crucial for maximizing your Airbnb profit potential in Estavar.
Seasonal Strategies for Maximizing Profit
- Peak Season: Maximize revenue through premium pricing and potentially longer minimum stays. Ensure high availability.
- Low Season: Offer competitive pricing, special promotions (e.g., extended stay discounts), and flexible cancellation policies. Target off-season travelers like remote workers or budget-conscious guests.
- Shoulder Seasons: Implement dynamic pricing that balances peak and low rates. Target weekend travelers or specific events. Offer slightly more flexible terms than peak season.
- Regularly analyze your own performance against these Estavar seasonality benchmarks and adjust your pricing and availability strategy accordingly.
Best Areas for Airbnb Investment in Estavar (2025)
Exploring the top neighborhoods for short-term rentals in Estavar? This section highlights key areas, outlining why they are attractive for hosts and guests, along with notable local attractions. Consider these locations based on your target guest profile and investment strategy.
| Neighborhood / Area | Why Host Here? (Target Guests & Appeal) | Key Attractions & Landmarks |
|---|---|---|
| Estavar Village | A charming mountain village offering a picturesque setting and access to nature, perfect for guests seeking a quiet retreat. | Historic church of Saint Martin, Walking trails in the surrounding mountains, Local shops and cafes |
| Les Angles | A ski resort town known for its winter sports and summer hiking trails, attracting outdoor enthusiasts year-round. | Les Angles Ski Resort, Lake of Les Angles, Mountain biking trails, Summer festivals |
| Font-Romeu-Odeillo-Via | Known for its sunny climate and thermal springs, this area appeals to health-conscious travelers and skiers alike. | Font-Romeu Ski Resort, Cerdagne's thermal baths, Museum of modern art, Scenic viewpoints |
| Bolquère | Another ski resort area with a family-friendly vibe, perfect for families looking for ski holidays or summer hiking trips. | Puyvalador Lake, Bolquère Ski Resort, Hiking paths, Local markets |
| Mont-Louis | A fortified town with rich history and unique architecture, appealing to history buffs and cultural travelers. | Concealed fortress of Mont-Louis, Historical architecture, La Llagonne trails |
| Espace Cambre d'Aze | Great for both ski and summer activities, it attracts a diverse range of travelers, including families and sports enthusiasts. | Cambre d'Aze Ski Resort, Summer hiking routes, Hermitage of St. Bernard |
| Les Corts | A peaceful area just outside the busy tourist spots, ideal for guests looking for tranquility and nature. | Vast open fields, Scenic picnic areas, Bird-watching spots |
| Cerdagne | Known for its beautiful landscapes and cultural heritage, this region attracts travelers interested in nature and local traditions. | Cerdagne natural parks, Local farm tours, Traditional festivals |
Understanding Airbnb License Requirements & STR Laws in Estavar (2025)
While Estavar, Occitania, France currently shows low STR regulations, specific Airbnb license requirements might still exist or change. Always verify the latest short term rental regulations and Airbnb license requirements directly with local government authorities for Estavar to ensure full compliance before hosting.
(Source: AirROI data, 2025, based on 6% licensed listings)
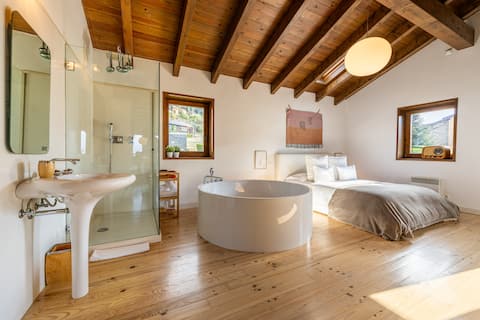
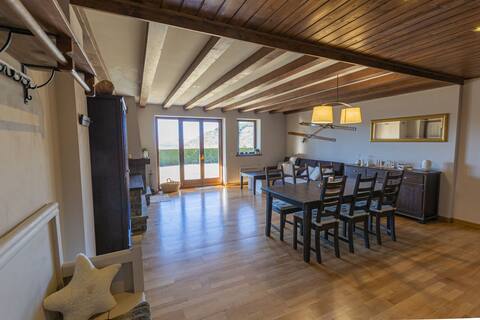
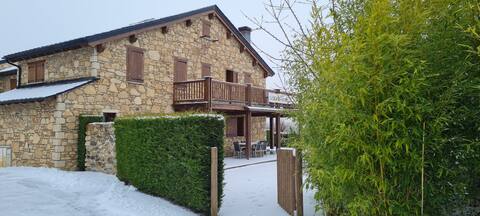
Top Performing Airbnb Properties in Estavar (2025)
Benchmark your potential! Explore examples of top-performing Airbnb properties in Estavarbased on Trailing Twelve Month (TTM) revenue. Analyze their characteristics, revenue, occupancy rate, and ADR to understand what drives success in this market.
Home Sweet Estavar
Entire Place • 1 bedroom
Apartament las Coses del Cadí
Entire Place • 3 bedrooms
8 House with large garden, views and pool.
Entire Place • 4 bedrooms
Sun Costs II
Entire Place • 2 bedrooms
House in Estavar
Entire Place • 3 bedrooms

Grand chalet cosy, belle vue, terrain clos, 5 chb
Entire Place • 5 bedrooms
Note: Performance varies based on location, size, amenities, seasonality, and management quality. Data reflects the past 12 months.
Top Performing Airbnb Hosts in Estavar (2025)
Learn from the best! This table showcases top-performing Airbnb hosts in Estavar based on the number of properties managed and estimated total revenue over the past year. Analyze their scale and performance metrics.
| Host Name | Properties | Grossing Revenue | Stay Reviews | Avg Rating |
|---|---|---|---|---|
| Isabel | 5 | $106,286 | 289 | 4.60/5.0 |
| Welcome | 6 | $51,013 | 21 | 3.59/5.0 |
| Karine | 2 | $48,719 | 275 | 4.92/5.0 |
| Host #151260158 | 3 | $36,601 | 4 | 1.42/5.0 |
| Quim | 1 | $34,781 | 17 | 4.94/5.0 |
| Frederic | 1 | $29,345 | 31 | 4.81/5.0 |
| Alejandro | 1 | $23,754 | 18 | 4.67/5.0 |
| Elena | 1 | $21,840 | 111 | 4.68/5.0 |
| Biel | 1 | $21,546 | 77 | 4.95/5.0 |
| Xavier | 1 | $20,861 | 160 | 4.92/5.0 |
Analyzing the strategies of top hosts, such as their property selection, pricing, and guest communication, can offer valuable lessons for optimizing your own Airbnb operations in Estavar.
Dive Deeper: Advanced Estavar STR Market Data (2025)
Ready to unlock more insights? AirROI provides access to advanced metrics and comprehensive Airbnb data for Estavar. Explore detailed analytics beyond this report to refine your investment strategy, optimize pricing, and maximize your vacation rental profits.
Explore Advanced MetricsEstavar Short-Term Rental Market Composition (2025): Property & Room Types
Room Type Distribution
Property Type Distribution
Market Composition Insights for Estavar
- The Estavar Airbnb market composition is heavily skewed towards Entire Home/Apt listings, which make up 95.8% of the 48 active rentals. This indicates strong guest preference for privacy and space.
- Looking at the property type distribution in Estavar, House properties are the most common (45.8%), reflecting the local real estate landscape.
- Houses represent a significant 45.8% portion, catering likely to families or larger groups.
- The presence of 10.4% Hotel/Boutique listings indicates integration with traditional hospitality.
- Smaller segments like others (combined 2.1%) offer potential for unique stay experiences.
Estavar Airbnb Room Capacity Analysis (2025): Bedroom Distribution
Distribution of Listings by Number of Bedrooms
Room Capacity Insights for Estavar
- The dominant room capacity in Estavar is 2 bedrooms listings, making up 35.4% of the market. This suggests a strong demand for properties suitable for couples or solo travelers.
- Together, 2 bedrooms and 3 bedrooms properties represent 62.5% of the active Airbnb listings in Estavar, indicating a high concentration in these sizes.
- A significant 45.9% of listings offer 3+ bedrooms, catering to larger groups and families seeking more space in Estavar.
Estavar Vacation Rental Guest Capacity Trends (2025)
Distribution of Listings by Guest Capacity
Guest Capacity Insights for Estavar
- The most common guest capacity trend in Estavar vacation rentals is listings accommodating 8+ guests (29.2%). This suggests the primary traveler segment is likely larger groups.
- Properties designed for 8+ guests and 4 guests dominate the Estavar STR market, accounting for 54.2% of listings.
- 50.1% of properties accommodate 6+ guests, serving the market segment for larger families or group travel in Estavar.
- On average, properties in Estavar are equipped to host 5.4 guests.
Estavar Airbnb Booking Patterns (2025): Available vs. Booked Days
Available Days Distribution
Booked Days Distribution
Booking Pattern Insights for Estavar
- The most common availability pattern in Estavar falls within the 271-366 days range, representing 72.9% of listings. This suggests many properties have significant open periods on their calendars.
- Approximately 89.6% of listings show high availability (181+ days open annually), indicating potential for increased bookings or specific owner usage patterns.
- For booked days, the 1-30 days range is most frequent in Estavar (37.5%), reflecting common guest stay durations or potential owner blocking patterns.
- A notable 10.4% of properties secure long booking periods (181+ days booked per year), highlighting successful long-term rental strategies or significant owner usage.
Estavar Airbnb Minimum Stay Requirements Analysis
Distribution of Listings by Minimum Night Requirement
1 Night
2 listings
4.5% of total
2 Nights
23 listings
52.3% of total
3 Nights
2 listings
4.5% of total
7-29 Nights
3 listings
6.8% of total
30+ Nights
14 listings
31.8% of total
Key Insights
- The most prevalent minimum stay requirement in Estavar is 2 Nights, adopted by 52.3% of listings. This highlights the market's preference for shorter, flexible bookings.
- A significant segment (31.8%) caters to monthly stays (30+ nights) in Estavar, pointing to opportunities in the extended-stay market.
Recommendations
- Align with the market by considering a 2 Nights minimum stay, as 52.3% of Estavar hosts use this setting.
- If feasible, allowing 1-night stays, especially midweek or during low season, could capture last-minute bookings, as only 4.5% currently do.
- A 2-night minimum appears standard (52.3%). Consider this for weekends or peak periods.
- Explore offering discounts for stays of 30+ nights to attract the 31.8% of the market seeking extended stays.
- Adjust minimum nights based on seasonality – potentially shorter during low season and longer during peak demand periods in Estavar.
Estavar Airbnb Cancellation Policy Trends Analysis (2025)
Flexible
13 listings
32.5% of total
Moderate
12 listings
30% of total
Firm
9 listings
22.5% of total
Strict
6 listings
15% of total
Cancellation Policy Insights for Estavar
- The prevailing Airbnb cancellation policy trend in Estavar is Flexible, used by 32.5% of listings.
- There's a relatively balanced mix between guest-friendly (62.5%) and stricter (37.5%) policies, offering choices for different guest needs.
Recommendations for Hosts
- Consider adopting a Flexible policy to align with the 32.5% market standard in Estavar.
- Regularly review your cancellation policy against competitors and market demand shifts in Estavar.
Estavar STR Booking Lead Time Analysis (2025)
Average Booking Lead Time by Month
Booking Lead Time Insights for Estavar
- The overall average booking lead time for vacation rentals in Estavar is 50 days.
- Guests book furthest in advance for stays during August (average 85 days), likely coinciding with peak travel demand or local events.
- The shortest booking windows occur for stays in October (average 17 days), indicating more last-minute travel plans during this time.
- Seasonally, Summer (66 days avg.) sees the longest lead times, while Fall (23 days avg.) has the shortest, reflecting typical travel planning cycles.
Recommendations for Hosts
- Use the overall average lead time (50 days) as a baseline for your pricing and availability strategy in Estavar.
- For August stays, consider implementing length-of-stay discounts or slightly higher rates for bookings made less than 85 days out to capitalize on advance planning.
- Target marketing efforts for the Summer season well in advance (at least 66 days) to capture early planners.
- Monitor your own booking lead times against these Estavar averages to identify opportunities for dynamic pricing adjustments.
Popular & Essential Airbnb Amenities in Estavar (2025)
Amenity Prevalence
Amenity Insights for Estavar
- Essential amenities in Estavar that guests expect include: TV, Heating. Lacking these (any) could significantly impact bookings.
- Popular amenities like Kitchen, Free parking on premises, Hot water are common but not universal. Offering these can provide a competitive edge.
Recommendations for Hosts
- Ensure your listing includes all essential amenities for Estavar: TV, Heating.
- Prioritize adding missing essentials: TV, Heating.
- Consider adding popular differentiators like Kitchen or Free parking on premises to increase appeal.
- Highlight unique or less common amenities you offer (e.g., hot tub, dedicated workspace, EV charger) in your listing description and photos.
- Regularly check competitor amenities in Estavar to stay competitive.
Estavar Airbnb Guest Demographics & Profile Analysis (2025)
Guest Profile Summary for Estavar
- The typical guest profile for Airbnb in Estavar consists of predominantly international visitors (82%), with top international origins including France, typically belonging to the Post-2000s (Gen Z/Alpha) group (50%), primarily speaking English or Spanish.
- Domestic travelers account for 18.4% of guests.
- Key international markets include Spain (71.6%) and France (18.4%).
- Top languages spoken are English (30.7%) followed by Spanish (29.1%).
- A significant demographic segment is the Post-2000s (Gen Z/Alpha) group, representing 50% of guests.
Recommendations for Hosts
- Focus marketing internationally, particularly towards travelers from France.
- Tailor amenities and listing descriptions to appeal to the dominant Post-2000s (Gen Z/Alpha) demographic (e.g., highlight fast WiFi, smart home features, local guides).
- Highlight unique local experiences or amenities relevant to the primary guest profile.
- Consider seasonal promotions aligned with peak travel times for key origin markets.
Nearby Short-Term Rental Market Comparison
How does the Estavar Airbnb market stack up against its neighbors? Compare key performance metrics like average monthly revenue, ADR, and occupancy rates in surrounding areas to understand the broader regional STR landscape.
| Market | Active Properties | Monthly Revenue | Daily Rate | Avg. Occupancy |
|---|---|---|---|---|
| Canyelles | 49 | $5,958 | $1023.94 | 37% |
| Arenys de Munt | 28 | $5,100 | $514.27 | 41% |
| Teià | 25 | $5,027 | $348.45 | 45% |
| Cornellà del Terri | 17 | $4,960 | $460.96 | 41% |
| Tiana | 12 | $4,955 | $299.97 | 48% |
| Amer | 10 | $4,848 | $397.58 | 40% |
| Bescanó | 11 | $4,761 | $445.38 | 41% |
| Porqueres | 12 | $4,714 | $469.05 | 36% |
| Premià de Dalt | 28 | $4,630 | $345.43 | 49% |
| Cabrils | 53 | $4,474 | $436.58 | 48% |