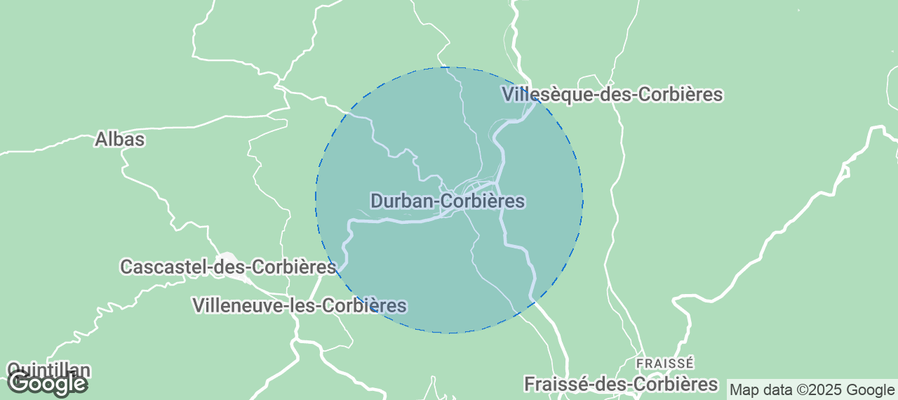
Durban-Corbières Airbnb Market Analysis 2025: Short Term Rental Data & Vacation Rental Statistics in Occitania, France
Is Airbnb profitable in Durban-Corbières in 2025? Explore comprehensive Airbnb analytics for Durban-Corbières, Occitania, France to uncover income potential. This 2025 STR market report for Durban-Corbières, based on AirROI data from April 2024 to March 2025, reveals key trends in the niche market of 30 active listings.
Whether you're considering an Airbnb investment in Durban-Corbières, optimizing your existing vacation rental, or exploring rental arbitrage opportunities, understanding the Durban-Corbières Airbnb data is crucial. Leveraging the low regulation environment is key to maximizing your short term rental income potential. Let's dive into the specifics.
Key Durban-Corbières Airbnb Performance Metrics Overview
Monthly Airbnb Revenue Variations & Income Potential in Durban-Corbières (2025)
Understanding the monthly revenue variations for Airbnb listings in Durban-Corbières is key to maximizing your short term rental income potential. Seasonality significantly impacts earnings. Our analysis, based on data from the past 12 months, shows that the peak revenue month for STRs in Durban-Corbières is typically September, while October often presents the lowest earnings, highlighting opportunities for strategic pricing adjustments during shoulder and low seasons. Explore the typical Airbnb income in Durban-Corbières across different performance tiers:
- Best-in-class properties (Top 10%) achieve $4,049+ monthly, often utilizing dynamic pricing and superior guest experiences.
- Strong performing properties (Top 25%) earn $2,062 or more, indicating effective management and desirable locations/amenities.
- Typical properties (Median) generate around $826 per month, representing the average market performance.
- Entry-level properties (Bottom 25%) see earnings around $280, often with potential for optimization.
Average Monthly Airbnb Earnings Trend in Durban-Corbières
Durban-Corbières Airbnb Occupancy Rate Trends (2025)
Maximize your bookings by understanding the Durban-Corbières STR occupancy trends. Seasonal demand shifts significantly influence how often properties are booked. Typically, Julysees the highest demand (peak season occupancy), while October experiences the lowest (low season). Effective strategies, like adjusting minimum stays or offering promotions, can boost occupancy during slower periods. Here's how different property tiers perform in Durban-Corbières:
- Best-in-class properties (Top 10%) achieve 55%+ occupancy, indicating high desirability and potentially optimized availability.
- Strong performing properties (Top 25%) maintain 41% or higher occupancy, suggesting good market fit and guest satisfaction.
- Typical properties (Median) have an occupancy rate around 24%.
- Entry-level properties (Bottom 25%) average 13% occupancy, potentially facing higher vacancy.
Average Monthly Occupancy Rate Trend in Durban-Corbières
Average Daily Rate (ADR) Airbnb Trends in Durban-Corbières (2025)
Effective short term rental pricing strategy in Durban-Corbières involves understanding monthly ADR fluctuations. The Average Daily Rate (ADR) for Airbnb in Durban-Corbières typically peaks in August and dips lowest during April. Leveraging Airbnb dynamic pricing tools or strategies based on this seasonality can significantly boost revenue. Here's a look at the typical nightly rates achieved:
- Best-in-class properties (Top 10%) command rates of $242+ per night, often due to premium features or locations.
- Strong performing properties (Top 25%) achieve nightly rates of $148 or more.
- Typical properties (Median) charge around $97 per night.
- Entry-level properties (Bottom 25%) earn around $55 per night.
Average Daily Rate (ADR) Trend by Month in Durban-Corbières
Get Live Durban-Corbières Market Intelligence 👇
Explore Real-time Analytics
Airbnb Seasonality Analysis & Trends in Durban-Corbières (2025)
Peak Season (September, August, June)
- Revenue averages $2,075 per month
- Occupancy rates average 32.9%
- Daily rates average $116
Shoulder Season
- Revenue averages $1,479 per month
- Occupancy maintains around 30.1%
- Daily rates hold near $113
Low Season (February, April, October)
- Revenue drops to average $922 per month
- Occupancy decreases to average 21.1%
- Daily rates adjust to average $109
Seasonality Insights for Durban-Corbières
- The Airbnb seasonality in Durban-Corbières shows highly seasonal trends requiring careful strategy. While the sections above show seasonal averages, it's also insightful to look at the extremes:
- During the high season, the absolute peak month showcases Durban-Corbières's highest earning potential, with monthly revenues capable of climbing to $2,386, occupancy reaching a high of 41.6%, and ADRs peaking at $124.
- Conversely, the slowest single month of the year, typically falling within the low season, marks the market's lowest point. In this month, revenue might dip to $751, occupancy could drop to 17.8%, and ADRs may adjust down to $102.
- Understanding both the seasonal averages and these monthly peaks and troughs in revenue, occupancy, and ADR is crucial for maximizing your Airbnb profit potential in Durban-Corbières.
Seasonal Strategies for Maximizing Profit
- Peak Season: Maximize revenue through premium pricing and potentially longer minimum stays. Ensure high availability.
- Low Season: Offer competitive pricing, special promotions (e.g., extended stay discounts), and flexible cancellation policies. Target off-season travelers like remote workers or budget-conscious guests.
- Shoulder Seasons: Implement dynamic pricing that balances peak and low rates. Target weekend travelers or specific events. Offer slightly more flexible terms than peak season.
- Regularly analyze your own performance against these Durban-Corbières seasonality benchmarks and adjust your pricing and availability strategy accordingly.
Best Areas for Airbnb Investment in Durban-Corbières (2025)
Exploring the top neighborhoods for short-term rentals in Durban-Corbières? This section highlights key areas, outlining why they are attractive for hosts and guests, along with notable local attractions. Consider these locations based on your target guest profile and investment strategy.
| Neighborhood / Area | Why Host Here? (Target Guests & Appeal) | Key Attractions & Landmarks |
|---|---|---|
| Narbonne Plage | A beautiful coastal area perfect for beach lovers and families. Popular during the summer months for sunbathing and water sports, making it ideal for vacation rentals. | Narbonne Plage Beach, Local seafood restaurants, Water sports facilities, Beaches, Nature reserves |
| Leucate | Known for its wonderful beaches and watersports opportunities, especially windsurfing and kitesurfing. An attractive destination for active travelers and beachgoers. | Leucate Beach, Château de Leucate, Windsurfing and kitesurfing, Natural parks, Wine tasting |
| Fitou | This charming village is famous for its wines and offers a picturesque setting. Great for tourists interested in wine tourism and exploring the Cathar castles. | Fitou Castle, Wine cellars, Scenic views, Local markets, Historic village center |
| Caves de Roquefort | Known for its stunning natural caves and outdoor activities. Great for nature tourists, especially those interested in hiking and exploration. | Roquefort caves, Hiking trails, Natural landscapes, Wine tourism, Historic sites |
| Saint-Pierre-la-Mer | A popular seaside resort with a laid-back atmosphere, ideal for families and couples looking for a beach getaway. Offers good amenities and activities. | Saint-Pierre-la-Mer Beach, Water parks, Dining options, Family-friendly activities, Scenic promenades |
| Bize-Minervois | This small village is known for its historic architecture and tranquil surroundings. Perfect for tourists looking to experience the rural side of France. | Canal du Midi, Village architecture, Wine tasting, Local trails, Cultural heritage sites |
| Sigean | Home to the famous Sigean African Reserve, attracting animal lovers and families. A unique area for nature and wildlife enthusiasts. | Sigean African Reserve, Historic sites, Natural parks, Family-friendly attractions, Local cuisine |
| Port-Leucate | A vibrant coastal community with a marina and plenty of water activities. A hotspot for tourists seeking leisure and adventure on the water. | Port-Leucate beach, Marina, Water sports, Dining options, Nightlife events |
Understanding Airbnb License Requirements & STR Laws in Durban-Corbières (2025)
While Durban-Corbières, Occitania, France currently shows low STR regulations, specific Airbnb license requirements might still exist or change. Always verify the latest short term rental regulations and Airbnb license requirements directly with local government authorities for Durban-Corbières to ensure full compliance before hosting.
(Source: AirROI data, 2025, finding no licensed listings among those analyzed)
Top Performing Airbnb Properties in Durban-Corbières (2025)
Benchmark your potential! Explore examples of top-performing Airbnb properties in Durban-Corbièresbased on Trailing Twelve Month (TTM) revenue. Analyze their characteristics, revenue, occupancy rate, and ADR to understand what drives success in this market.
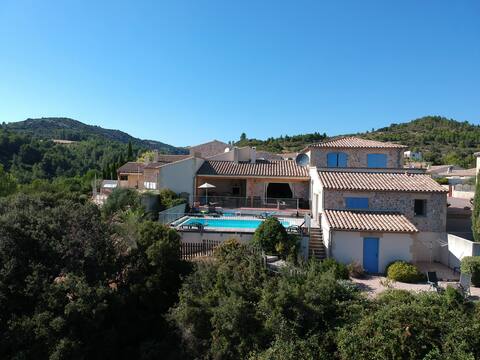
Air-conditioned Villa with a View! Wow!
Entire Place • 5 bedrooms
Between land and sea, villa in the Cathar area
Entire Place • 2 bedrooms

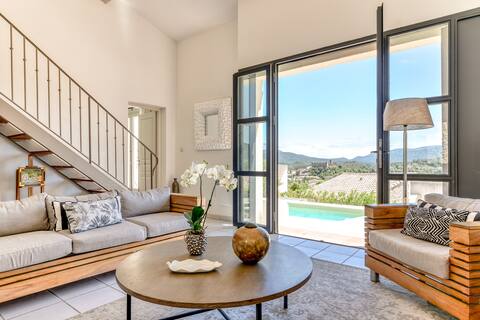
Beautiful modern villa 3 ch, gardens terrace pool
Entire Place • 3 bedrooms
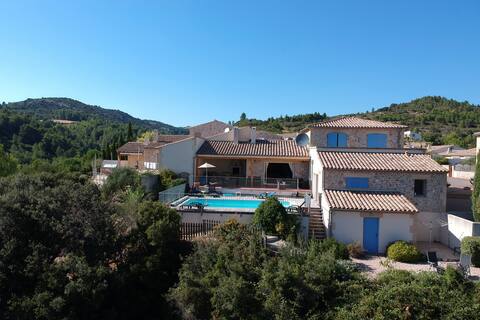
Air-conditioned 2 Bed Villa with a View. Wow!
Entire Place • 2 bedrooms

Large deco holiday home between land and see
Entire Place • 4 bedrooms
Petit appartement
Entire Place • 1 bedroom
Note: Performance varies based on location, size, amenities, seasonality, and management quality. Data reflects the past 12 months.
Top Performing Airbnb Hosts in Durban-Corbières (2025)
Learn from the best! This table showcases top-performing Airbnb hosts in Durban-Corbières based on the number of properties managed and estimated total revenue over the past year. Analyze their scale and performance metrics.
| Host Name | Properties | Grossing Revenue | Stay Reviews | Avg Rating |
|---|---|---|---|---|
| Mark | 2 | $76,452 | 39 | 4.97/5.0 |
| Claire Et Jean-Marc | 1 | $38,953 | 59 | 4.86/5.0 |
| Julien | 1 | $27,232 | 46 | 4.83/5.0 |
| Host #125391649 | 3 | $18,271 | 12 | 2.54/5.0 |
| Host #371786949 | 5 | $15,720 | 1 | 0.00/5.0 |
| Anne Et Eric | 1 | $8,383 | 52 | 4.83/5.0 |
| Cécilia | 1 | $7,810 | 6 | 4.67/5.0 |
| Host #15416791 | 1 | $7,307 | 0 | 0.00/5.0 |
| Host #106374372 | 2 | $7,255 | 76 | 4.62/5.0 |
| Carole | 5 | $5,707 | 71 | 5.00/5.0 |
Analyzing the strategies of top hosts, such as their property selection, pricing, and guest communication, can offer valuable lessons for optimizing your own Airbnb operations in Durban-Corbières.
Dive Deeper: Advanced Durban-Corbières STR Market Data (2025)
Ready to unlock more insights? AirROI provides access to advanced metrics and comprehensive Airbnb data for Durban-Corbières. Explore detailed analytics beyond this report to refine your investment strategy, optimize pricing, and maximize your vacation rental profits.
Explore Advanced MetricsDurban-Corbières Short-Term Rental Market Composition (2025): Property & Room Types
Room Type Distribution
Property Type Distribution
Market Composition Insights for Durban-Corbières
- The Durban-Corbières Airbnb market composition is heavily skewed towards Entire Home/Apt listings, which make up 63.3% of the 30 active rentals. This indicates strong guest preference for privacy and space.
- However, a notable 20% share for Private Rooms suggests opportunities for budget-conscious travelers or hosts renting out spare rooms.
- Looking at the property type distribution in Durban-Corbières, House properties are the most common (56.7%), reflecting the local real estate landscape.
- Houses represent a significant 56.7% portion, catering likely to families or larger groups.
- The presence of 23.3% Hotel/Boutique listings indicates integration with traditional hospitality.
- Smaller segments like unique stays, outdoor/unique (combined 6.6%) offer potential for unique stay experiences.
Durban-Corbières Airbnb Room Capacity Analysis (2025): Bedroom Distribution
Distribution of Listings by Number of Bedrooms
Room Capacity Insights for Durban-Corbières
- The dominant room capacity in Durban-Corbières is 2 bedrooms listings, making up 43.3% of the market. This suggests a strong demand for properties suitable for couples or solo travelers.
- Together, 2 bedrooms and 1 bedroom properties represent 66.6% of the active Airbnb listings in Durban-Corbières, indicating a high concentration in these sizes.
Durban-Corbières Vacation Rental Guest Capacity Trends (2025)
Distribution of Listings by Guest Capacity
Guest Capacity Insights for Durban-Corbières
- The most common guest capacity trend in Durban-Corbières vacation rentals is listings accommodating 4 guests (26.7%). This suggests the primary traveler segment is likely small families or groups.
- Properties designed for 4 guests and 6 guests dominate the Durban-Corbières STR market, accounting for 46.7% of listings.
- 26.7% of properties accommodate 6+ guests, serving the market segment for larger families or group travel in Durban-Corbières.
- On average, properties in Durban-Corbières are equipped to host 3.5 guests.
Durban-Corbières Airbnb Booking Patterns (2025): Available vs. Booked Days
Available Days Distribution
Booked Days Distribution
Booking Pattern Insights for Durban-Corbières
- The most common availability pattern in Durban-Corbières falls within the 271-366 days range, representing 83.3% of listings. This suggests many properties have significant open periods on their calendars.
- Approximately 100.0% of listings show high availability (181+ days open annually), indicating potential for increased bookings or specific owner usage patterns.
- For booked days, the 31-90 days range is most frequent in Durban-Corbières (43.3%), reflecting common guest stay durations or potential owner blocking patterns.
Durban-Corbières Airbnb Minimum Stay Requirements Analysis
Distribution of Listings by Minimum Night Requirement
1 Night
12 listings
48% of total
2 Nights
1 listings
4% of total
3 Nights
5 listings
20% of total
4-6 Nights
4 listings
16% of total
7-29 Nights
1 listings
4% of total
30+ Nights
2 listings
8% of total
Key Insights
- The most prevalent minimum stay requirement in Durban-Corbières is 1 Night, adopted by 48% of listings. This highlights the market's preference for shorter, flexible bookings.
Recommendations
- Align with the market by considering a 1 Night minimum stay, as 48% of Durban-Corbières hosts use this setting.
- Explore offering discounts for stays of 30+ nights to attract the 8% of the market seeking extended stays.
- Adjust minimum nights based on seasonality – potentially shorter during low season and longer during peak demand periods in Durban-Corbières.
Durban-Corbières Airbnb Cancellation Policy Trends Analysis (2025)
Flexible
10 listings
52.6% of total
Moderate
3 listings
15.8% of total
Firm
2 listings
10.5% of total
Strict
4 listings
21.1% of total
Cancellation Policy Insights for Durban-Corbières
- The prevailing Airbnb cancellation policy trend in Durban-Corbières is Flexible, used by 52.6% of listings.
- There's a relatively balanced mix between guest-friendly (68.4%) and stricter (31.6%) policies, offering choices for different guest needs.
Recommendations for Hosts
- Consider adopting a Flexible policy to align with the 52.6% market standard in Durban-Corbières.
- Given the high prevalence of Flexible policies (52.6%), offering this can enhance booking appeal, especially during shoulder seasons.
- Regularly review your cancellation policy against competitors and market demand shifts in Durban-Corbières.
Durban-Corbières STR Booking Lead Time Analysis (2025)
Average Booking Lead Time by Month
Booking Lead Time Insights for Durban-Corbières
- The overall average booking lead time for vacation rentals in Durban-Corbières is 64 days.
- Guests book furthest in advance for stays during July (average 106 days), likely coinciding with peak travel demand or local events.
- The shortest booking windows occur for stays in February (average 7 days), indicating more last-minute travel plans during this time.
- Seasonally, Summer (89 days avg.) sees the longest lead times, while Winter (12 days avg.) has the shortest, reflecting typical travel planning cycles.
Recommendations for Hosts
- Use the overall average lead time (64 days) as a baseline for your pricing and availability strategy in Durban-Corbières.
- For July stays, consider implementing length-of-stay discounts or slightly higher rates for bookings made less than 106 days out to capitalize on advance planning.
- During February, focus on last-minute booking availability and promotions, as guests book with very short notice (7 days avg.).
- Target marketing efforts for the Summer season well in advance (at least 89 days) to capture early planners.
- Monitor your own booking lead times against these Durban-Corbières averages to identify opportunities for dynamic pricing adjustments.
Popular & Essential Airbnb Amenities in Durban-Corbières (2025)
Amenity Prevalence
Amenity Insights for Durban-Corbières
- Essential amenities in Durban-Corbières that guests expect include: Kitchen. Lacking these (this) could significantly impact bookings.
- Popular amenities like Heating, Essentials, Washer are common but not universal. Offering these can provide a competitive edge.
- Warning: Wifi is not universally provided but is considered essential globally. Ensure reliable Wifi is offered.
Recommendations for Hosts
- Ensure your listing includes all essential amenities for Durban-Corbières: Kitchen.
- Prioritize adding missing essentials: Kitchen.
- Consider adding popular differentiators like Heating or Essentials to increase appeal.
- Highlight unique or less common amenities you offer (e.g., hot tub, dedicated workspace, EV charger) in your listing description and photos.
- Regularly check competitor amenities in Durban-Corbières to stay competitive.
Durban-Corbières Airbnb Guest Demographics & Profile Analysis (2025)
Guest Profile Summary for Durban-Corbières
- The typical guest profile for Airbnb in Durban-Corbières consists of a mix of domestic (59%) and international guests, often arriving from nearby Barcelona, typically belonging to the Post-2000s (Gen Z/Alpha) group (50%), primarily speaking English or French.
- Domestic travelers account for 58.6% of guests.
- Key international markets include France (58.6%) and Germany (10.3%).
- Top languages spoken are English (35.7%) followed by French (31%).
- A significant demographic segment is the Post-2000s (Gen Z/Alpha) group, representing 50% of guests.
Recommendations for Hosts
- Balance marketing efforts between domestic and international channels based on the guest mix.
- Tailor amenities and listing descriptions to appeal to the dominant Post-2000s (Gen Z/Alpha) demographic (e.g., highlight fast WiFi, smart home features, local guides).
- Highlight unique local experiences or amenities relevant to the primary guest profile.
- Consider seasonal promotions aligned with peak travel times for key origin markets.
Nearby Short-Term Rental Market Comparison
How does the Durban-Corbières Airbnb market stack up against its neighbors? Compare key performance metrics like average monthly revenue, ADR, and occupancy rates in surrounding areas to understand the broader regional STR landscape.
| Market | Active Properties | Monthly Revenue | Daily Rate | Avg. Occupancy |
|---|---|---|---|---|
| Vall-llobrega | 15 | $10,261 | $798.88 | 44% |
| Canyelles | 49 | $5,958 | $1023.94 | 37% |
| Arenys de Munt | 28 | $5,100 | $514.27 | 41% |
| Teià | 25 | $5,027 | $348.45 | 45% |
| Cornellà del Terri | 17 | $4,960 | $460.96 | 41% |
| Tiana | 12 | $4,955 | $299.97 | 48% |
| Amer | 10 | $4,848 | $397.58 | 40% |
| Bescanó | 11 | $4,761 | $445.38 | 41% |
| Porqueres | 12 | $4,714 | $469.05 | 36% |
| Premià de Dalt | 28 | $4,630 | $345.43 | 49% |